Bot. Bull. Acad. Sin. (1995) 36: 135-141

Kim and Chung — Genetic variation in Calystegia japonica

Genetic and clonal structure in Korean populations of Calystegia japonica (Convolvulaceae)

Seung Tae Kim1 and Myong Gi Chung2,3

1Department of Biology, Pusan National University, Pusan 609-735, The Republic of Korea

2Department of Biology, Gyeongsang National University, Chinju 660-701, The Republic of Korea

(Received February 13, 1995; Accepted May 2, 1995)

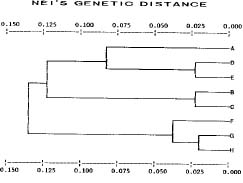
Abstract. The genetic and genotypic diversity of Korean Calystegia japonica Choisy populations were investigated using starch gel electrophoresis. Calystegia japonica is a clonal plant species that inhabits fields and roadsides and reproduces vegetatively by rhizomes. Although populations of the species are small, isolated, and distributed in patches, the species maintains a moderate level of genetic diversity—60% of the loci examined were polymorphic and the mean genetic diversity within populations (HeP) was 0.099. The mean number of multilocus genotypes per population was 11.6, and the genotypic diversity index (DG) was 0.74. Slightly more than 38% of the total genetic variation was found among populations (GST = 0.383). In addition, significant differences in allele frequency were detected among populations at all loci examined (P < 0.001), suggesting low gene flow among Korean populations. Indirect estimates of the number of migrants per generation (Nm) were 0.40 (calculated from GST) and 0.20 (calculated from the mean frequency of five private alleles). Widespread geographical distribution, isolated populations in patchy distribution, clonal reproduction with relatively high genotypic diversity, low gene flow among populations, fragmentation of a once continuous range, and genetic drift may have played roles in shaping the population genetic structure of the species.

Keywords: Calystegia japonica; Clonal diversity; Gene flow; Genetic diversity; Genetic drift; Population genetic structure.

genetic diversity and modes of reproduction is still unclear. Further study of predominantly asexual plant species is necessary.

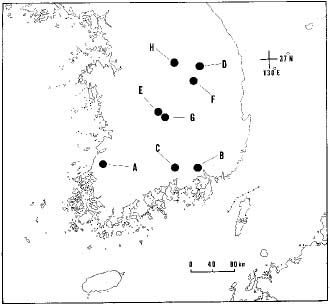
Calystegia japonica Choisy, a herbaceous perennial vine, is widely distributed in China, Korea, and Japan (Kitamura et al., 1986). In Korea, the species usually grows on small mounds in paddy fields and along roadsides, rarely colonizing sites or waste places which have been recently disturbed (S. Kang and M. Chung, pers. obs.). Typical populations of C. japonica are small and distributed in patches. Pink flowers (5_6 cm in diameter) are axillary and solitary from several axils. Mature capsules have not been encountered during field trips. It appears that the species is a nearly obligate clonal plant that propagates predominantly by rhizome. The species is diploid (2n = 22) (M. Chung, unpubl. data). In this paper we report levels and partitioning of allozyme diversity within and among populations, and the extent of cloning within populations of Calystegia japonica. The purposes of this study were 1) to estimate how much total genetic diversity is maintained in the species, 2) to describe how genetic variation is distributed within and among populations, 3) to compare the level of genetic diversity in populations of C. japonica with that of plant species having similar life history traits, and 4) to characterize the population genetic structure to determine whether patches of the species comprise single clones or a mixture of genets.

Introduction

Electrophoretic techniques have increasingly been applied to the study of clonal plants, because they provide genetic markers for the recognition of individual plant genotypes (e.g. Pleasants and Wendel, 1989; Bayer, 1990; Aspinwall and Christian, 1992; Chung, 1994; Kim and Chung, 1995). This has made it possible to better understand the spatial distributions of clones and the genotypic diversity maintained within populations. According to a recent review of the study of clonal plants (Ellstrand and Roose, 1987), species with predominantly vegetative reproduction generally have lower levels of genetic diversity than do species that successfully produce progeny by sexual reproduction. More recently, however, contrasting results were encountered in the study of Vallisneria americana (Lokker et al., 1994) and Filipendula rubra (Aspinwall and Christian, 1992). Although these two species are capable of clonal growth and sexual reproduction, V. americana has high levels of genetic diversity within populations, but the genotypic diversity of F. rubra is quite low. This may be partially because species, even congeners, often differ in many other aspects of their biology and ecology (Chung et al., 1991). The relationship between

3 Corresponding author.


Botanical Bulletin of Academia Sinica, Vol. 36, 1995

Materials and Methods

Population Samples

Leaves were collected from eight populations of C. japonica in Korea (Figure 1). Population samples of 25 or 50 were employed. Population codes and sample sizes are given in Table 1. Because the species exhibits extensive clonal growth, samples were collected randomly at intervals of greater than 2 m within each patch or population to avoid biasing samples toward certain clones. Leaf samples were wrapped with a wet paper towel, placed in plastic bags, and stored on ice for transport to the laboratory. Samples were then stored at 4°C until protein extraction.

Enzyme Extraction and Electrophoresis

Leaf samples were cut finely, and crushed with a mortar and pestle. A phosphate-polyvinylpyrrolidone extraction buffer (Mitton et al., 1979) was added to the leaf samples to facilitate crushing and to aid enzyme stabilization. The crushed extract was absorbed onto 4 × 6-mm wicks cut from Whatman 3MM chromatography paper, which were then stored at -70°C until needed for analysis. Electrophoresis was performed using 10.5% starch gel. Sixteen putative loci for C. japonica from seven enzyme systems were resolved using two systems of electrode and gel buffer. A Poulik buffer system, a modification (Haufler, 1985) of the Soltis et al. (1983) system 8, resolved phosphoglucomutase (PGM), leucine aminopeptidase (LAP), triosephosphate isomerase (TPI), and phosphoglucoisomerase (PGI). A morpholine citrate buffer system, a modification (Chung and Kang, 1994) of that of Clayton and Tretiak (1972), was used to resolve 6-phosphogluconate dehydrogenase (PGD), peroxidase (PER), and isocitrate dehydrogenase (IDH). All stain recipes were identical to those described by Soltis et al. (1983). Putative loci were designated sequentially, with the most anodally migrating isozyme designated 1', the next 2', etc. Likewise, alleles were designated sequentially with the most anodally migrating alleles designated a'. Although the genetic bases of the loci were not documented by controlled crosses, the isozymes expressed phenotypes that were consistent in subunit structure and genetic interpretation with most isozyme studies in plants, as documented by Weeden and Wendel (1989). Lap-2 was expressed, but because of poor activity and/or resolution, it was not scored.

Data Analyses

A locus was considered polymorphic if two or more alleles were detected, regardless of their frequencies. Four standard genetic parameters were estimated using a com

H

37°N

D

130°E

E

F

G

C

B

A

0 40 80 km


Figure 1. The locations of the eight Korean populations examined in this study (alphabetic codes as in Table 1).

Table 1. Summary of allozyme variation and clonal diversity for 15 loci within eight populations of Calystegia japonicaa.

Popb Nc ALd P A Ae Ho (SE) He (SE) G DG G/N PG

A 25 80 26.7 1.33 1.16 0.104 (0.014) 0.089 (0.017) 9 0.78 0.36 0.36

B 50 50 40.0 1.47 1.28 0.206 (0.012) 0.158 (0.019) 26 0.95 0.52 0.18

C 50 70 33.3 1.33 1.15 0.148 (0.006) 0.085 (0.016) 5 0.40 0.10 0.76

D 50 850 40.0 1.47 1.24 0.160 (0.010) 0.122 (0.019) 15 0.84 0.30 0.30

E 50 750 26.7 1.33 1.15 0.096 (0.008) 0.078 (0.016) 12 0.80 0.24 0.34

F 50 920 20.0 1.27 1.17 0.120 (0.007) 0.079 (0.018) 7 0.73 0.14 0.46

G 25 650 26.7 1.27 1.15 0.139 (0.008) 0.081 (0.016) 4 0.47 0.16 0.72

H 25 820 40.0 1.40 1.14 0.088 (0.016) 0.097 (0.013) 15 0.93 0.60 0.24

Mean

40.6 31.7 1.36 1.18 0.133 (0.004) 0.099 (0.006) 11.6 0.74 0.30 0.42

aAbbreviations: P, percentage of polymorphic loci; A, mean number of alleles per locus; Ae, effective number of alleles per locus; Ho, observed heterozygosity; He, HardyWeinberg expected heterozygosity or genetic diversity; G, number of multilocus genotypes; DG, multilocus genotypic diversity indices; G/N, number of genotypes per population samples ("proportion of distinguishable genotypes" per population); PG, probability of the most common multilocus genotype.

bAlphabetic codes as in Figure 1.

cSample size.

dAltitude (m).


Kim and Chung — Genetic variation in Calystegia japonica

puter program developed by M. D. Loveless and A. Schnabel—percent polymorphic loci (P), mean number of alleles per locus (A), effective number of alleles per locus (Ae), and gene diversity (He) (Chung and Chung, 1994; Hamrick et al., 1992). Subscripts refer to species (s) or population (p) level parameters.

Because C. japonica reproduces vegetatively, we assessed the amount of clonal diversity within and among populations. The first measure of clonal diversity we used was the probability that the next individual sample is a new multilocus genotype. This is simply G/N, where G is the number of distinct genotypes in a population and N is the number of individual samples ("proportion of distinguishable genotypes", Ellstrand and Roose, 1987). The second measure was the probability of getting the most common genotype by chance in each population (PG). The third measure of multilocus genotype diversity (DG) was calculated as a modification (Pielou, 1969) of the Simpson index: DG = 1 - {[ni(ni-1)]/[N(N-1)]}, where ni is the number of individuals of genotype i and N is the total number of individuals in the population. Finally, for comparisons of genotypic diversity among populations, numbers of "widespread genotypes" (genotype occurring in more than 75% of the populations) and "local genotypes" (genotypes occurring only one population) were counted (Ellstrand and Roose, 1987).

Observed heterozygosity was compared to Hardy-Weinberg expected values using Wright's (1922) fixation indices (F) or inbreeding coefficients. These indices were tested for deviation from zero by X2-statistics following Li and Horvitz (1953).

Nei's (1973, 1977) gene diversity formulae (HT, HS, DST, and GST) were used to evaluate the distribution of genetic diversity within and among populations. In addition, an X2-statistic was used to detect significant differences in allele frequency among populations for each locus (Workman and Niswander, 1970). Nei's (1972) genetic identity (I) was calculated for each pairwise combination of populations. A correlation between genetic distance and geographical distance was calculated using the PC-SAS program (SAS Institute Inc., 1989). In addition, we used NTSYS (Rohlf, 1988) to conduct a cluster analysis on genetic distances via the unweighted pairwise groups method using arithmetic average (UPGMA).

The genetic structure within and among populations was also evaluated using Wright's (1965) F-statistics: FIT, FIS, and FST . The FIT and FIS coefficients measure excesses of homozygotes or heterozygotes relative to the panmictic expectations within the entire sample and within populations, respectively. The FST coefficient estimates relative population differentiation. Deviation of FIT and FIS from zero were tested using X2-statistics (Li and Horvitz, 1953). Two indirect estimates of gene flow were calculated. One estimate of Nm (the number of migrants per generation) was based on FST (Wright, 1951). The second estimate was based on the average frequency of private alleles (Slatkin, 1985; Barton and Slatkin, 1986).

Results

For Calystegia japonica, 9 of the 15 scoreable loci (PS = 60%) were polymorphic in at least one population. Tpi-1, Tpi-2, Pgi-1, Pgd-2, Idh-1, and Idh-2 were monomorphic in all eight populations. The mean number of alleles per locus was 2.13 for species (AS), and the effective number of alleles for the species (AeS) was 1.82. At the population level, relatively low mean estimates of genetic variation were observed—PP of 31.7%, AP of 1.36, and AeP of 1.18. In addition, mean expected heterozygosity or genetic diversity within populations (HeP = 0.099) was lower than the overall values for the species (HeS = 0.178) (Table 1).

The number of multilocus genotypes in populations ranged from four to 26 (mean = 11.6). All populations comprised multiple genotypes. The proportion of resolved "distinguishable genotypes" (G/N) ranged from 0.10 to 0.60, with a mean of 0.30. The probability of getting the most common genotype by chance (PG) in each population ranged from 0.18 to 0.76, with a mean of 0.42. Genotype diversity indices (DG) ranged from 0.40 to 0.95, with a mean of 0.74. The level of genotypic diversity among populations was considerably higher. Ninety-three multilocus genotypes were found among the 325 samples from the eight populations. All but three multilocus genotypes were "local genotypes" (90/93; slightly < 97%). Two genotypes in population D were shared with population E, and one genotype was shared between population G and H.

Analysis of fixation indices, calculated for all polymorphic loci in each population of C. japonica, showed an overall excess of heterozygotes, relative to Hardy-Weinberg expectations. Sixty-seven percent of fixation indices were negative (24/36), and 12 of those departed significantly from zero (P < 0.05). All but one of 12 positive fixation indices were also significantly different from zero (P < 0.05) (Table 2). In addition, Wright's F-coefficients showed that significant excesses of heterozygotes exist for five and three of the nine loci at the level of population and the sample as a whole, respectively (Table 3). The values of FIS (Table 3) varied from -0.748 to 0.937, with a mean of -0.153. This range of values of the inbreeding coefficient was substantially greater than expected, suggesting that the unknown evolutionary forces have varied impact upon nine loci. It should be noted, however, that the species has an extensive rhizome and reproduces vegetatively, which violates basic assumptions of the Hardy-Weinberg Law. The Hardy-Weinberg model assumes that the reproduction is sexual. It is highly probable that the observed values of fixation indices are artifacts of clonal growth.

Significant differences in allele frequency among populations were found for all nine loci (P < 0.001 in each case). The GST values ranged from 0.058 for Per-3 to 0.739 for Pgd-1 (Table 3), and on average, about 62% of the total variation in the species is common to all populations. In addition, five private alleles were found in five popu


Botanical Bulletin of Academia Sinica, Vol. 36, 1995

Table 2. Fixation indices (F) for nine polymorphic loci in populations of Calystegia japonica.

Population

Locus

A B C D E F G H

Pgm_1 _ 0.3631** 0.0899ns _ 0.2369ns _ _ _

Pgm_2 -0.6333*** -0.6780*** 0.6598*** -0.8371*** -0.8165*** _ -0.9600*** -0.2895ns

Lap_1 _ _ _ _ _ -0.9800*** _ 1.000***

Pgi_2 _ -0.2891* -0.9800*** 1.0000*** _ _ _ -0.0889ns

Pgd_1 _ 1.0000*** _ 1.0000*** _ _ 1.0000*** _

Per_1 _ -0.9800*** -0.9800*** -0.0532ns -0.0206ns -0.0313ns _ 0.6525***

Per_2 -0.0331ns -0.2222ns _ -0.4863*** _ -0.1771ns -0.8148*** -0.3429ns

Per_3 -0.0280ns _ _ _ _ _ -0.0652ns 0.4674*

Idh_3 0.5116* _ _ _ 0.3631* _ _ _

* = P < 0.05, ** = P < 0.01, *** =P < 0.001, and ns = not significant in chi-square tests of deviations of F from zero. Populations that were monomorphic for a particular locus are indicated with a dash.

Table 3. Nei's (1973, 1977) statistics of genetic diversity and the estimates of Wright's Fstatistics for nine polymorphic loci in Calystegia japonica.

Locus # Allele HT HS GSTa FISb FITb

Pgm-1 3 0.1434 0.1171 0.1836*** 0.2643*** 0.3994***

Pgm-2 3 0.4322 0.3429 0.1919*** -0.7305*** -0.3983***

Lap-1 3 0.1644 0.0976 0.4064*** -0.5763*** 0.0644ns

Pgi-2 2 0.4924 0.1735 0.6477*** -0.5076*** 0.4689***

Pgd-1 3 0.1881 0.0490 0.7393*** 0.9371*** 0.986***

Per-1 4 0.3011 0.2006 0.3336*** -0.7482*** -0.1650***

Per-2 4 0.4225 0.3328 0.2122** -0.3498*** -0.0633ns

Per-3 2 0.0303 0.0286 0.0575*** 0.1379* 0.1875***

Idh-3 2 0.4920 0.1616 0.6715*** 0.2005*** 0.7374***

Mean 2.89 0.2963 0.1678 0.3826 -0.1525 0.2460

aAm X2 test for allele frequency heterogeneity between populations: ns = not significant; *** = P < 0.001.

bAsteriks indicate F values significantly different from zero: ns = not significant; * = P < 0.01; *** = P < 0.001.

lations: D (Per-2c), E (Pgm-1b), F (Lap-1c), G (Pgd-1c), and H (Lap-1b). The indirect estimate of gene flow, based on the mean GST, was low (Nm = 0.40), and was similar to the estimate based on private alleles (Nm = 0.20). Av

erage genetic identity for all pairs of populations was 0.90 (SE = 0.007). The UPGMA dendrogram provided a few insights into the genetic structuring of the eight populations (Figure 2). In addition, the correlation between genetic distance and geographic distance was low (r = 0.399, df = 26, P < 0.05), and indicated that 84% of the variation in genetic distances was caused by unknown factors other than distance.

Discussion

The levels of genetic variation found within Korean populations of C. japonica were moderate in relation to the mean values of short-lived herbaceous perennials. According to a recent review of plant allozyme literature (Hamrick and Godt, 1989), short-lived herbaceous perennials at the species (N=152) and population (N=159) levels, have a mean polymorphic loci (P) of 41.3 and 28.0, mean number of alleles per locus (A) of 1.70 and 1.40, mean effective number of alleles per locus (Ae) of 1.15 and 1.12, and mean genetic diversity (He) of 0.116 and 0.096, respectively. For C. japonica, PS is 60% and PP is 31.7%, AS is 2.13 and AP is 1.36, AeS is 1.82 and AeP is 1.18, and HeS is 0.178 and HeP is 0.099. This level of genetic diversity is comparable with that of Calystegia soldanella, a herbaceous clonal

Figure 2. Phenogram from UPGMA cluster analysis, based on Nei's (1972) genetic distance between the eight populations of Calystegia japonica.


Kim and Chung — Genetic variation in Calystegia japonica

perennial that occurs widely on beach dunes in Europe and the Pacific region (Kim and Chung, 1995). Ellstrand and Roose (1987), in a review of studies of population genetic structure of primarily obligate clonal plant species, concluded that clonal plant species tend to have intermediate levels of genetic diversity. The results of the present study are consistent with the general conclusion of Ellstrand and Roose (1987) about the levels of genetic diversity.

The geographic range of a species is significantly correlated to the amount of genetic variation at the population and species levels (Hamrick and Godt, 1989). Usually, plant species with geographically widespread distributions tend to maintain higher levels of allozyme diversity than do plants with more restricted ranges (Karron et al., 1988). In addition, species with discrete populations in a patchy distribution have lower levels of variation within populations than do species with more continuously distributed populations (Chung and Kang, 1994). Although C. japonica has a wide geographic range in East Asia, populations in Korea have a patchy distribution. Vegetative reproduction and spread can also affect the genetic structure of populations (Murawski and Hamrick, 1990). Clonal reproduction can retard the loss of genetic diversity within populations because, in species with independent ramets, there is a reduced probability of genet death (Cook, 1983). The mechanism that maintains genetic variation in clonal plants, however, is still a matter of controversy (Eriksson, 1993). The combination of these factors may contribute to the maintenance of moderate levels of genetic variability in the species.

Population B had the highest values of DG, G/N, and HeP (0.95, 0.52, and 0.158, respectively), but as expected, the lowest value of PG (0.18). Populations C and F had similar, and the lowest, "proportion of distinguishable genotypes" (G/N)—0.10 and 0.14, respectively, but population C had a considerably lower genotypic diversity index (DG)—0.40, vs. 0.73 for population F. This is supported by the values of probability of the most common multilocus genotype (PG)—population C had a PG value of 0.76 while population F had a PG value of 0.46. This indicates that genotypes in population F are more evenly distributed than those in population C. The average genotypic diversity index for C. japonica is higher (DG = 0.74) than the average (0.62) reported by Ellstrand and Roose (1987) in their review of primarily obligate clonal plant species. The mean "proportion of distinguishable genotypes" per population is also higher (0.30 vs. 0.17) for C. japonica. It has been known that the fruits of C. japonica are usually not fully matured (Kitamura et al., 1986). No fruit was encountered in the study areas during field trips, which suggests that the species propagates exclusively by a rhizome. If this is true, why was the genotypic diversity of C. japonica higher than mean values for primarily obligate clonal species? Genotypic diversity among populations was large. No "widespread genotypes" were observed. In addition, all but three multilocus genotypes were "local genotypes". These data suggest that the present populations might have been founded from sexu

ally produced seed rather than asexually by the fragmentation and dispersal of preexisting clones. Because C. japonica has a relatively long, branched rhizome, and independent ramets can reduce the probability of genet death, Korean populations of the species consist of several genotypes brought about by sexual recombination, mutation, and other evolutionary forces acting for a long time. In addition, we can not rule out the possibility that sexual reproduction now occurs at a very low rate. Detailed breeding and demography studies of C. japonica are needed to confirm this speculation.

An overall excess of heterozygotes was observed in C. japonica (mean FIS = -0.153, Table 3). The abundance of ramets of certain genets found in the populations may have been responsible for a potentially misleading "inbreeding-like effect" suggested by Lokker et al. (1994). If so, part of the fixation indices calculated here are probably artifacts of clonal growth. Similar results were observed in the populations of Aechmea magdalenae, a clone-forming tropical terrestrial bromeliad (Murawski and Hamrick, 1990).

The degree of population differentiation observed in C. japonica was higher than that in other plants with similar life-history characteristics (reviewed in Hamrick and Godt, 1989). Short-lived herbaceous perennials (GST = 0.233, N = 119), species with a widespread geographic range (GST = 0.213, N = 87), and species with sexual and asexual modes of reproduction (GST = 0.213, N = 54) have lower mean GST values than does C. japonica (GST = 0.383). This is supported by a low mean genetic identity for each pairwise combination of populations (mean I = 0.90). In addition, significant differences were found in allele frequencies among populations for all nine loci (P < 0.001). Because of their colonizing habit, populations of C. japonica may be founded by a few propagules, and generally have patchy distribution. Like C. japonica, species with discrete populations can be expected to show increased levels of genetic differentiation as gene flow decreases (Loveless and Hamrick, 1984). Overall, slightly less than 97% of the multilocus genotypes were unique to each population, and no "widespread genotypes" were observed. These factors may account for the rather-high observed GST value. The high GST value suggests that gene flow among populations is low. Indirect estimates of the number of migrants per generation (Nm) were 0.40 (calculated from GST) and 0.20 (calculated from the mean frequency of five private alleles). Similar results were observed in Hosta clausa (Liliaceae) (Nm = 0.48, recalculated from mean GST; Chung, 1994), a herbaceous perennial native to the central and northern Korean peninsula and northeastern China. This species reproduces vegetatively by rhizomes, and potentially by sexually produced seeds. In addition, populations of the species are small and isolated. For neutral genes, a Nm value of 1.0 is considered necessary to prevent divergence caused by genetic drift (Wright, 1931; Slatkin, 1987). The levels of gene flow calculated here are of insufficient magnitude to counterbalance genetic drift. It should be noted that there were differences in habitat altitude among populations exam


Botanical Bulletin of Academia Sinica, Vol. 36, 1995

ined (see Table 1). Since gene flow is low among populations, genetic differentiation may be the result of local selection. It appears that genetic drift and local selection are discriminating factors that affect the distribution of genetic variation among populations.

Although C. japonica maintains a moderate level of genetic diversity, the small, isolated populations that currently characterize the Korean populations of C. japonica, coupled with the recent increased destruction of natural habitats during the reconstruction of roads may result in further erosion of genetic diversity in the near future. The level of distribution of genetic variation among populations is of primary importance to the conservation of genetic diversity and the evolutionary potential of species (Hamrick and Godt, 1989). Based on the available data, such as relatively-high GST value, several populations of each group should be preserved, especially those with high variation, such as populations B, D, and H. These populations could be used as a source of genetic diversity for the restoration of genetically poor populations.

Acknowledgments. This paper represents part of a dissertation submitted by STK to the Graduate School of Pusan National University, in partial fulfillment of the requirements for the degree of Doctor of Philosophy. We thank Drs. Soon Hyung Hong, Won Haek Park, Won Ho Lee, and Hong Wook Huh, who have encouraged our studies of clonal diversity in Korean plant species. This research was supported in part by Korea Science Engineering Foundation grant (931-0500-030-2) to MGC.

Literature Cited

Aspinwall, N. and T. Christian. 1992. Clonal structure, genotypic diversity, and seed production in populations of Filipendula rubra (Rosaceae) from the north central United States. Am. J. Bot. 79: 294_299.

Barton, N. H. and M. Slatkin. 1986. A quasi-equilibrium theory of the distribution of rare alleles in a subdivided population. Heredity 56: 409_415.

Bayer, R. J. 1990. Patterns of clonal diversity in the Antennaria rosea (Asteraceae) polyploid agamic complex. Am. J. Bot. 77: 1313_1319.

Chung, M. G. 1994. Low levels of genetic diversity within populations of Hosta clausa (Liliaceae). Plant Species Biol. 9: 177_182.

Chung, M. G. and H. G. Chung. 1994. Allozyme diversity and population genetic structure in Korean endemic species: II. Hosta yingeri (Liliaceae). J. Plant Biol. 37: 141_149.

Chung, M. G. and S. S. Kang. 1994. Genetic variation and population structure in Korean populations of Eurya japonica (Theaceae). Am. J. Bot. 81: 1077_1082.

Chung, M. G., J. L. Hamrick, S. B. Jones, and G. S. Derda. 1991. Isozyme variation within and among populations of Hosta (Liliaceae) in Korea. Syst. Bot. 16: 667_684.

Clayton, J. W. and D. N. Tretiak. 1972. Amine citrate buffers for pH control in starch gel electrophoresis. J. Fish. Res. Board Can. 29: 1169_1172.

Cook, R. E. 1983. Clonal plant populations. Am. Sci. 71: 244_253.

Ellstrand, N. C. and M. L. Roose. 1987. Patterns of genotypic diversity in clonal plant species. Am. J. Bot. 74: 123_131.

Eriksson, O. 1993. Dynamics of genets in clonal plants. Trends Ecol. Evol. 8: 313_316.

Hamrick, J. L. and M. J. W. Godt. 1989. Allozyme diversity in plant species. In A. H. D. Brown, M. T. Clegg, A. L. Kahler, and B. S. Weir (eds.), Plant Population Genetics, Breeding and Genetic Resources. Sinauer Associates, Sunderland, Massachusetts, pp. 43_63.

Hamrick, J. L., M. J. W. Godt, and S. L. Sherman-Broyles. 1992. Factors influencing levels of genetic diversity in woody plant species. New Forests 6: 95_124.

Haufler, C. H. 1985. Enzyme variability and modes of evolution in Bommeria (Pteridaceae). Syst. Bot. 10: 92_104.

Karron, J. D., Y. B. Linhart, C. A. Chaulk, and C. A. Robertson. 1988. The genetic structure of populations of geographically restricted and widespread species of Astragalus (Fabaceae). Am. J. Bot. 75: 1114_1119.

Kim, S. T. and M. G. Chung. 1995. Genetic and clonal diversity in Korean populations of Calystegia soldanella (Convolvulaceae). Israel J. Plant Sci. (in press).

Kitamura, S., G. Murata, and M. Mori. 1986. Colored illustrations of herbaceous plants of Japan. Hoikusha Publishing Co., Ltd., Osaka, 297 pp. (in Japanese).

Li, C. C. and D. G. Horvitz. 1953. Some methods of estimating the inbreeding coefficient. Am. J. Hum. Genet. 5: 107_117.

Lokker, C., D. Susko, L. Lovett-Doust, and J. Lovett-Doust. 1994. Population genetic structure of Valisneria americana, a dioecious clonal macrophyte. Am. J. Bot. 81: 1004_1012.

Loveless, M. D. and J. L. Hamrick. 1984. Ecological determinants of genetic structure in plant populations. Ann. Rev. Ecol. Syst. 15: 65_95.

Mitton, J. B., Y. B. Linhart, K. B. Sturgeon, and J. L. Hamrick. 1979. Allozyme polymorphisms detected in mature needle tissue of ponderosa pine. J. Hered. 70: 86_89.

Murawski, D. A. and J. L. Hamrick. 1990. Local genetic and clonal structure in the tropical terrestrial bromeliad, Aechmea magdalenae. Am. J. Bot. 77: 1201_1208.

Nei, M. 1972. Genetic distance between populations. Am. Nat. 106: 283_292.

Nei, M. 1973. Analysis of gene diversity in subdivided populations. Proc. Natl. Acad. Sci. USA. 70: 3321_3323.

Nei, M. 1977. F-statistics and analysis of gene diversity in subdivided populations. Ann. Human Genet. 41: 225_233.

Pielou, C. E. 1969. An Introduction to Mathematical Ecology. Wiley-Interscience, New York, 327 pp.

Pleasants, J. M. and J. F. Wendel. 1989. Genetic diversity in a clonal narrow endemic, Erythronium propullans, and in its widespread progenitor, Erythronium albidium. Am. J. Bot. 76: 1136_1151.

Rohlf, F. J. 1988. Numerical taxonomy and multivariate analysis system. Exeter publishing, Setauket, New York, 148 pp.

SAS Institute Inc. 1989. SAS / SAT User's Guide, Ver. 6, 4th edn. SAS Institute Inc., Cary, North Carolina, 889 pp.

Slatkin, M. 1985. Rare alleles as indicators of gene flow. Evolution 39: 53_65.

Slatkin, M. 1987. Gene flow and the geographic structure of natural populations. Science 236: 787_792.

Soltis, D. E., C. H. Haufler, D. C. Darrow, and G. J. Gastony.


Kim and Chung — Genetic variation in Calystegia japonica

1983. Starch gel electrophoresis of ferns: A compilation of grinding buffers, and staining schedules. Am. Fern J. 73: 9_27.

Weeden, N. F. and J. F. Wendel. 1989. Genetics of plant isozymes. In D. E. Soltis and P. S. Soltis (eds.), Isozymes in Plant Biology. Dioscorides Press, Portland, Oregon, pp. 46_72.

Workman, P. L. and J. D. Niswander. 1970. Population studies on southwestern Indian tribes. II. Local genetic differentiation in the Papago. Am. J. Hum. Genet. 22: 24_49.

Wright, S. 1922. Coefficient of inbreeding and relationship. Am. Nat. 56: 330_338.

Wright, S. 1931. Evolution in Mendelian populations. Genetics 16: 97_159.

Wright, S. 1951. The genetic structure of populations. Ann. Eugen. 15: 313_354.

Wright, S. 1965. The interpretation of population structure by F-statistics with special regard to systems of mating. Evolution 19: 395_420.