Bot. Bull. Acad. Sin. (1996) 37: 25-30

Chung — Chung-Spatial genetic structure of Hosta

Spatial genetic structure among Korean populations of Hosta minor and H. capitata (Liliaceae)

Myong Gi Chung

Department of Biology, Gyeongsang National University, Chinju 660-701, The Republic of Korea

(Received May 9, 1995; Accepted October 20, 1995)

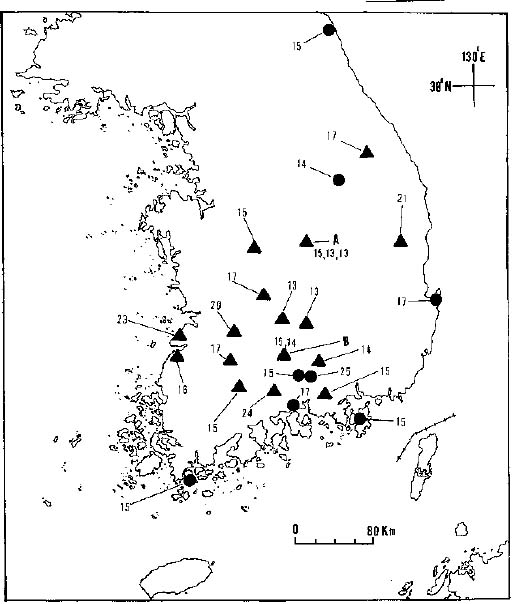
Abstract. I investigated the spatial distribution of genotypes among eight populations of Hosta minor and 19 populations of H. capitata from Korea using spatial autocorrelation analysis of enzyme polymorphisms. Both species are insect-pollinated, herbaceous perennials. Among 162 cases calculated for six distance classes among populations of both species, Moran's I was significant for 20 (12%) cases in H. minor and for 35 (21.6%) in H. capitata, respectively. In addition, the number of significant overall correlograms was different from each species (33.3%, 9/27 in H. minor vs. 11.1%, 3/27 in H. capitata). Eleven of 16 significant negative autocorrelations were observed for H. capitata in the longer distance classes (ca. 111_235 km boundary). On the other hand, no distinct trend with respect to distance was detected among populations of H. minor. The results of the study indicate that the level of gene flow among abundant, contiguous local populations of H. minor via winged seeds is higher than that of H. capitata, partly resulting from different distribution patterns and natural habitats of both species.

Keywords: Allozyme; Gene flow; Hosta capitata; H. minor; Moran's I; Spatial autocorrelation.

Introduction

Recent reviews of the plant allozyme literature have shown casual relationships between several life history and ecological traits of plants and the amount and patterns of genetic variation (e.g., Hamrick and Godt, 1989; Hamrick et al., 1992). For instance, species with narrow or endemic distributions maintain lower levels of genetic diversity than species with widespread distributions. Knowledge of geographic range, however, may not always be predictive of levels of genetic variation (Chung and Chung, 1994; Soltis and Soltis, 1991). This may be explained by the fact that species, even congeners, often differ in many other aspects of their biology. In their review of the plant allozyme literature, Hamrick and Godt (1989) included 653 taxa and classified each species for eight traits to find correlations between the traits and levels and distribution of genetic variation. Unfortunately, less than 50% of the variation among species was explained by their models, which is due to differences in the specific ecological, evolutionary history and other unknown factors among species (Hamrick et al., 1991). Spatial genetic patterns within and among populations affect the evolutionary dynamics of plant populations and species (Sokal and Oden, 1978b). An understanding of the pattern could give us a more explicit understanding of the evolutionary and ecological processes in plant species and thus has been of continued interest to evolutionary and conservation biologists (Heywood, 1991; Xie and Knowles, 1991). Spatial structure may be analyzed using spatial autocorrelation analysis (Sokal and Oden, 1978a). The analysis has only recently been applied to large scale structure on a number

of animal species (e.g., Sokal and Oden, 1978a,b; Sokal, 1988) and plant species (e.g., Jensen, 1986; Sokal et al., 1986) and to fine scale genetic structure within populations (e.g., Dewey and Heywood, 1988; Epperson and Clegg, 1988; Knowles et al., 1992). These studies have revealed several advantages of spatial autocorrelation analysis because the analysis includes all pair comparisons in samples and it makes no assumptions about the spatial scale of the structure within a population (Epperson, 1989; Heywood, 1991).

Population differentiation among plant populations is significantly associated with breeding systems (Hamrick and Godt, 1989). In other words, gene flow via pollen in plant species is one of the primary factors shaping genetic structure among populations. Hosta minor (Baker) Nakai and H. capitata (Koidz.) Nakai, are insect-pollinated, herbaceous perennials. Populations of H. minor, a Korean endemic species, are large and abundant on hillsides and grasslands in the middle eastern and southern Korean Peninsula (Chung and Kim, 1991). Flowers are visited by bees (Apis mellifera L. and A. cerana F.; Chung pers. obs.). On the other hand, H. capitata is native to South Korea (mainly in the southwestern Korean Peninsula) and southwestern Japan (Chung and Kim, 1991; Fujita, 1976). In Korea, most populations of the species are relatively small and isolated compared with other Korean hostas (Chung et al., 1991), and few pollinators (e.g., bees) were observed. Populations of H. capitata usually are found in pine-oak understories. The fruit of both species is a cylindrical capsule, with 10_30 small (3.0_5.5 mm) seeds in each capsule. Each seed is winged and dispersed by wind (Chung and Kim, 1991). Although both species are


Botanical Bulletin of Academia Sinica, Vol. 37, 1996

diploids (2n=60), they are considered to be of ancient polyploid origin because of gene duplication on several enzyme systems such as phosphoglucomutase, phosphoglucoisomerase, 6-phosphogluconate dehydrogenase, and triosephosphate isomerase (Chung, 1990; Chung et al., 1991). Both species are similar in their seed dispersal mechanism and breeding system. As population differentiation is most affected by several ecological traits, we might expect that H. minor and H. capitata would exhibit similar patterns of spatial genetic structure among populations. The purpose of this study is to compare spatial genetic structure among populations of H. minor and H. capitata.

Materials and Methods

A total of 443 leaf samples collected from eight populations (133 individuals) of H. minor and 19 populations (310 individuals) of H. capitata in Korea (Figure1) was used in the study. Isozyme extraction and electrophoresis, and interpretation of isozyme banding patterns (loci and alleles designation) have been described previously (Chung, 1990; Chung et al., 1991). Except as noted, gel and electrode buffers and enzyme staining procedures from Soltis et al. (1983) were used to assay four and six enzyme systems for H. capitata and H. minor, respectively: system 6 resolved phosphoglucomutase (PGM) for both species and phosphoglucoisomerase (PGI) for H. minor;

diaphorase (DIA) on system 7; isocitrate dehydrogenase (IDH) on system 2; 6-phosphogluconate dehydrogenase (PGD) on system 11; for H. minor, triosephosphate isomerase (TPI) on a modification (Haufler, 1985) of system 8. The staining procedures for DIA followed the method described by Cheliak and Pitel (1984).

A locus was considered polymorphic only if the most common allele occurred at a frequency of 0.95 or less in the population (a 95% criterion). For spatial autocorrelation analysis, the mean frequency values were assigned to each population for alleles at each locus. Every possible pair of populations was considered as a join and was assigned to one of six distance classes based on the geographic distance between them. These six distance classes were constructed by equalizing sample sizes among the classes. The distance classes for H. minor are 0<49, 49<119, 119<140, 140<175, 175<283, and 283<383 km. For H. capitata, they are 0<43, 43<70, 70<83, 83<110, 110<137, and 137<235 km. Moran's I values were calculated for interpopulational distance classes by

(Sokal and Oden, 1978a). Here, N is the number of populations, Wij is the join on weighting matrix, where Wij is set as one if ith and jth population are in the distance class and zero otherwise, Zi = Xi _ , Zj = Xj _ , the variables Xi and Xj are the mean allele frequency scores for ith and jth population, respectively, and is the mean score for all populations. The value of I ranges between +1 (complete positive autocorrelation, i.e., paired populations have identical values) and -1 (complete negative autocorrelation). Each I value was used to test significant deviations from the expected values, E(I)=-1/(N-1) (Cliff and Ord, 1981). A significant positive value of Moran's I indicates that the neighboring populations in the distance class considered tend to have different gene frequencies, whereas a significant negative value suggests that they tend to have different scores. Overall significance of individual correlograms was tested using Bonferroni's criteria (Sakai and Oden, 1983). All calculations and statistical analyses were performed using the SAAP program (ver. 4.3) written by D. Wartenberg.

Results

A total of 27 alleles for both species were used for spatial autocorrelation analysis on the basis of a 95% criterion for considering a polymorphic locus. If two alleles were detected at each locus, only one allele was considered because either allele would provide the same information. The spatial autocorrelation coefficients, Moran's I, for both species are presented in Tables 1 and 2. For H. minor, Moran's I values in all eight populations were calculated for the 27 alleles surveyed. Moran's I was significant in 20 of 162 cases (12%). The overall correlogram for Pgi-1c, Tpi-3a, and Tpi-3c was significant (Table 1). In the distance class 1 (0<49 Km), three positive and three

Figure 1. The location of 27 sampled populations in Korea. Closed circles indicate Hosta minor (eight populations) and closed triangles represent H. capitata (19 populations) respectively. A and B indicate three (ca. 5 km boundary) and two populations (ca. 10 km boundary), respectively, were collected. Sample size is indicated in each population.


Chung — Chung-Spatial genetic structure of Hosta

Table 1. Spatial autocorrelation coefficients (Moran's I) of 27 alleles among populations of Hosta minor for six distance classes (1_6).

Allele 1 2 3 4 5 6 Pa

Pgm-1 -0.89** 0.38 -0.21 0.09 -0.27 -0.01 0.054

Pgm-2 -0.03 -0.44 -0.73 0.21 0.21 -0.17 0.585

Pgm-3a -0.57 -0.21 0.43 0.29 -0.68 -0.09 0.493

Pgm-3b -0.50 -0.17 -0.13 -0.70 0.71* -0.14 0.087

Pgm-3c -0.83* 0.16 0.11 -0.40 0.19 -0.18 0.208

Pgi-1a 0.37 0.12 -0.75 -0.33 0.05 -0.33 0.516

Pgi-1b 0.76** -0.87* -0.24 -0.10 0.29 -0.37 0.054

Pgi-1c 0.63* -0.98** -0.11 0.02 0.20 -0.27 0.029

Pgi-2 -0.10 -0.15 0.33 -0.38 -0.47 0.02 0.668

Dia-1 -0.80* -0.00 0.62* -0.37 -0.10 -0.18 0.225

Dia-2a -0.38 -0.15 0.15 -0.48* 0.18 -0.16 0.237

Dia-2b 0.00 0.00 -0.84* 0.16 -0.33 0.04 0.277

Dia-2c 0.30 0.18 -0.97* -0.59 0.03 0.30 0.067

Dia-2d -0.11 -0.04 -0.85* -0.06 0.12 0.08 0.172

Dia-3a 0.11 0.15 -0.36 0.12 0.05 -0.91** 0.057

Dia-3b -0.01 0.02 -0.84 0.11 -0.42 0.17 0.300

Dia-3c -0.11 0.33 -0.01 -0.12 -0.67 -0.25 0.364

Pgd-1a 0.39 -0.34 -0.04 -0.63 0.02 -0.13 0.471

Pgd-1b -0.22 -0.38 -0.00 0.08 -0.10 -0.22 1.000

Pgd-1c -0.35 -0.31 -0.14 0.32 -0.37 -0.05 0.812

Idh-2a -0.43 -0.31 0.14 -0.09 -0.09 -0.09 0.472

Idh-2b 0.62* -0.62 -0.89* -0.03 0.22 -0.15 0.118

Idh-2c -0.04 -0.17 -0.91* 0.36 0.12 -0.20 0.125

Idh-2d 0.04 -0.68 -0.57 0.27 0.09 -0.05 0.506

Tpi-3a 0.17 0.28 -0.07 0.05 0.08 -0.89** 0.000

Tpi-3b -0.23 -0.35 0.07 -0.40 0.21 -0.13 0.438

Tpi-3c 0.38 0.44* -0.03 -0.18 0.12 -0.93** 0.000

aOverall correlogram significance (Bonferroni approximation).

* = P < 0.05; ** = P < 0.01.

Table 2. Spatial autocorrelation coefficients (Moran's I) of 27 alleles among populations of Hosta capitata for six distance classes (1_6).

Allele 1 2 3 4 5 6 Pa

Pgm-1a -0.06 -0.12 -0.10 -0.09 0.02 0.02 0.906

Pgm-1b 0.05 -0.17 -0.10 -0.18 0.01 0.06 1.000 Pgm-1c 0.07 -0.33* -0.19 0.06 0.05 0.02 0.159

Pgm-1d 0.04 -0.50** 0.04 0.21* -0.02 -0.07 0.004

Pgm-2a -0.01 -0.01 -0.08 0.01 -0.19* -0.06 0.270

Pgm-2b -0.02 -0.12 0.06* -0.13 -0.13 -0.02 0.105

Pgm-2c -0.29 0.10 -0.20 0.33** -0.22 -0.09 0.042

Pgm-2d -0.33* 0.12 -0.25 0.27* -0.13 -0.03 0.080

Pgm-3a 0.00 0.05 -0.05 -0.06 0.03 -0.31* 0.084

Pgm-3b 0.05 -0.03 0.00 -0.01 0.07 -0.41** 0.028

Pgm-3c 0.07 -0.07 -0.03 -0.04 0.07 -0.32* 0.165

Dia-1 -0.02 -0.01 -0.10 -0.09 -0.10 -0.02 1.000

Dia-2 -0.05 -0.09 -0.02 -0.05 0.06 -0.16 0.398

Dia-3a -0.05 -0.05 0.12* -0.18 -0.13 -0.03 0.175

Dia-3b 0.28* 0.15 0.17 -0.18 -0.47** -0.27 0.021

Dia-3c 0.34** 0.31** -0.12 -0.32 -0.48** -0.08 0.020

Dia-3d 0.12 -0.13 0.15* -0.05 -0.26* -0.14 0.250

Pgd-1 -0.13 -0.28 -0.13 0.28* 0.06 -0.14 0.079

Pgd-2a 0.46** 0.13 0.09 -0.52** -0.10 -0.37* 0.005

Pgd-2b 0.11 -0.03 0.24* -0.14 0.04 -0.53** 0.001 Pgd-2c 0.24* 0.22* -0.15 -0.38* -0.18 -0.09 0.145

Idh-1a -0.06 -0.09 -0.02 -0.05 0.06 -0.16 0.398

Idh-1b 0.41** -0.08 -0.17 -0.22 0.04 -0.30* 0.000

Idh-1c 0.54** -0.08 -0.23 -0.27 0.02 -0.31* 0.000

Idh-2a -0.18 0.22* -0.05 -0.17 0.02 -0.18 0.087 Idh-2b 0.02 0.21* -0.05 -0.28 -0.25 0.01 0.239

Idh-2c 0.01 0.20* -0.05 -0.28 -0.25 0.01 0.281

aOverall correlogram significance (Bonferroni approximation).

* = P < 0.05; ** = P < 0.01.


Botanical Bulletin of Academia Sinica, Vol. 37, 1996

negative I values were significantly different from the expected value (E[I])=-0.143 (Table 1). Beyond the distance class, 11 negative and three positive cases were significantly different from the expected value, indicating that populations are somewhat genetically heterogeneous beyond the distance class 1. For H. capitata, Moran's I was significant in 35 of 162 (21.6%) cases, and 19 of 35 values were positive (Table 2). The 19 positive values were only observed from distance classes 1 (0<43 km) to 4 (83<110 km), indicating overall genetic similarity within the distance classes. On the other hand, 11 negative values in the distance classes 5 (110<137 km) and 6 (137<235 km) were significantly different from the expected value E[I]=-0.056 (Table 2). The overall correlogram for Pgm-1d, Pgm-2c, Pgm-3b, Dia-3b, Dia-3c, Pgd-2a, Pgd-2b, Idh-1b, and Idh-1c were significant (Table 2).

Discussion

The results of this study indicate that the pattern of genetic distribution in H. minor is different from that of H. capitata. For example, 11 of 16 significant negative autocorrelations were observed for H. capitata in the longer distance classes (ca. 111_235 km boundary), and this implies that genetically more different populations are spaced farther apart. In addition, all 19 significant positive autocorrelation coefficients in distance classes 1 to 4 (ca. 0_110 km boundary) were detected among populations of H. capitata. Although three significant negative values were observed in the longest distance class, no distinct trend was observed among populations of H. minor. Among 162 cases calculated for all distance classes among populations of H. minor and H. capitata, Moran's I was significant for 20 (12%) cases in H. minor and for 35 (21.6%) in H. capitata, respectively. In addition, a higher number of significant overall correlograms was observed in H. capitata (9 vs. 3). Considering the similarity of the breeding systems (predominantly outcrossing because of herkogamy) and seed dispersal mechanisms (via wind) between the two species, the observed spatial pattern of genetic structure between them is somewhat surprising. The higher percentage of significant Moran's I values in H. capitata over H. minor indicates that the amount of gene flow among populations of H. minor is greater than that of H. capitata. Based on 22 polymorphic allozyme loci, Chung (1994a) reported that the partitioning of genetic variation among populations (Nei's [1973, 1977] GST) among the 19 Korean H. capitata populations (GST= 0.308) was considerably higher than those of mean values for similar life history traits. The high mean GST value observed in H. capitata is also indicative of a low level of gene flow. An indirect estimate of the number of migrants per generation (Nm) based on the mean GST was low (0.56). On the other hand, about 16% was due to differences among populations of the total variation found in H. minor on the basis of 19 polymorphic allozyme loci (GST=0.158; Chung, 1994b). In addition, indirect gene flow estimate of Nm (1.33) based on the GST was moderate, but this level was considerably higher than that for H. capitata. For

neutral genes, below Nm=1 genetic drift is the predominant factor affecting population structure, whereas above Nm=4 gene flow replaces drift (J. Hamrick of University of Georgia, pers. comm.). Thus, it appears that both genetic drift and gene flow may play roles in shaping the genetic structure in the Korean populations of H. minor. Species with more continuously distributed populations should experience more gene flow than species with discrete, isolated populations and therefore have relatively lower variation among populations (e.g., Gibson and Hamrick, 1991; Chung and Kang, 1994). Most Korean populations of H. capitata surveyed are small, isolated, and grow on dense pine-oak understory in hillsides and mountains (alt. ca. 500_1,400 m); whereas most populations of H. minor are large and abundant (several thousand individuals per local population), and contiguously distributed on hillsides along coastal areas (alt. ca. less than 100 m), over the eastern and southern Korean Peninsula (Chung, pers. obs.). The present distribution patterns of H. minor and H. capitata in Korea can be explained by the Pleistocene paleoclimatic history of the Korean Peninsula. It is supposed that, since the Ice Age (the glacial "Würm"), the glacial remnants of H. capitata have retreated exclusively to calcarious mountainous regions (the southwestern Korean Peninsula) (Fujita, 1976), resulting in a relatively small effective population size. On the other hand, the remnant of H. minor has adapted to the warm coastal hillsides in the southern and southeastern Korean Peninsula. Gene flow via pollen between scattered or isolated populations of H. capitata seems improbable given the apparent lack of specialized pollinators (Chung, pers. obs.). In addition, as H. capitata usually grows in pine-oak understory, foraging behavior by flower visitors or pollinators would be limited (Chung, pers, obs.), and winged seeds would be dispersed in a relatively short distance. On the other hand, considering the distribution pattern and natural habitats of H. minor, it is highly probable that gene flow would be moderate among contiguously distributed local populations via winged seeds (Chung, 1994b). These differences may in part contribute to the observed spatial genetic structure among populations found in the two species.

Acknowledgments. I thank J. L. Hamrick, A. Schnabel, S. B. Jones, W. W. Anderson, R. Wyatt, M. J. W. Godt, S. S. Kang, and S. Shermam-Broyles for assistance. This research was supported in part by a National Science Foundation Dissertation Improvement Grant BSR-8914430 and a grant from a Korea Science and Engineering Foundation Grant (931-0500-030-2).

Literature Cited

Cheliak, W. M. and J. P. Pitel. 1984. Technique for starch gel electrophoresis of enzyme from forest tree species. Agric. Canada Forest Serv., Petawawa Nat. Forest Inst., Inform. Rep. PI-X_42.

Chung, M. G. 1990. A Biosystematic Study of the Genus Hosta Tratt. (Liliaceae) in Korea. Ph. D. Dissertation, University of Georgia, Athens.


Chung — Chung-Spatial genetic structure of Hosta

Chung, M. G. 1994a. Genetic structure in Korean populations of Hosta capitata (Liliaceae). J. Plant Biol. 37: 277_284.

Chung, M. G. 1994b. Genetic variation and population structure in Korean endemic species: III. Hosta minor (Liliaceae). J. Plant Res. 107: 377_383.

Chung. M. G. and H. G. Chung. 1994. Allozyme diversity and population genetic structure in Korean endemic plant species: II. Hosta yingeri (Liliaceae). J. Plant Biol. 37: 141_149.

Chung, M. G., J. L. Hamrick, S. B. Jones, and G. S. Derda. 1991. Isozyme variation within and among populations of Hosta (Liliaceae) in Korea. Syst. Bot. 16: 667_684.

Chung, M. G. and S. S. Kang. 1994. Genetic variation and population structure in Korean populations of Eurya japonica (Theaceae). Am. J. Bot. 81: 1077_1082.

Chung, M. G. and J. W. Kim. 1991. The genus Hosta Tratt. (Liliaceae) in Korea. Sida 14: 411_420.

Cliff, A. D. and J. K. Ord. 1981. Spatial Processes-Methods and Applications. Pion Limited, London.

Dewey, S. E. and J. S. Heywood. 1988. Spatial autocorrelation in a population of Psychotria nervosa. I. Distribution of genotypes. Evolution 47: 834_838.

Epperson, B. K. 1989. Spatial patterns of genetic variation within plant populations. In A. H. D. Brown, M. T. Clegg, A. L. Kahler, and B. S. Weir (eds.), Plant Population Genetics, Breeding and Genetic Resources. Sinauer Associates, Sunderland, Massachusetts, pp. 229_253.

Epperson, B. K. and M. T. Clegg. 1986. Spatial autocorrelation of flower color polymorphisms within substructured populations of morning glory (Ipomoea purpurea). Am. Nat. 128: 840_858.

Fujita, N. 1976. The genus Hosta (Liliaceae) in Japan. Acta Phytotax. Geobot. 27: 66_96. (in Japanese)

Gibson, J. P. and J. L. Hamrick. 1991. Genetic diversity and structure in Pinus pungens (table mountain pine) populations. Can. J. For. Res. 21: 635_642.

Heywood, J. S. 1991. Spatial analysis of genetic variation in plant populations. Ann. Rev. Ecol. Syst. 22: 335_355.

Hamrick, J. L. and M. J. W. Godt. 1989. Allozyme diversity in plant species. In A. H. D. Brown, M. T. Clegg, A. L. Kahler, and B. S. Weir (eds.), Plant Population Genetics, Breeding and Genetic Resources. Sinauer Associates, Sunderland, Massachusetts, pp. 43_63.

Hamrick, J. L., M. J. W. Godt, D. A. Murawski, and M. D. Loveless. 1991. Correlations between species traits and allozyme diversity: Implications for conservation biology. In D. A. Falk and K. E. Holsinger (eds.), Genetics and Conservation of Rare Plants. Oxford Univ. Press, New York, pp. 75_86.

Hamrick, J. L., M. J. W. Godt, and S. L. Sherman-Broyles. 1992. Factors influencing levels of genetic diversity in woody plant species. New Forests 6: 95_124.

Haufler, C. H. 1985. Enzyme variability and modes of evolution in Bommeria (Pteridaceae). Syst. Bot. 10: 92_104.

Jensen, R. T. 1986. Geographic spatial autocorrelation in Quercus ellipsoidalis. Bull. Torrey Bot. Club 113: 431_439.

Knowles, P., D. J. Perry, and H. A. Foster. 1992. Spatial genetic structure in two tamarack [Larix laricina (Du Roi) K.Koch] populations with differing establishment histories. Evolution 46: 572_576.

Nei, M. 1973. Analysis of gene diversity in subdivided populations. Proc. Natl. Acad. Sci. USA 70: 3321_3323.

Nei, M. 1977. F-statistics and analysis of gene diversity in subdivided populations. Ann. Human Genet. 41: 225_233.

Sakai, A. K. and N. L. Oden. 1983. Spatial pattern of sex expression in silver maple (Acer saccharum Marsh.) stands. Am. Nat. 122: 489_508.

Sokal, R. R. 1988. Genetic, geographic, and linguistic distances in Europe. Proc. Natl. Acad. Sci. USA 85: 1722_1726.

Sokal, R. R., T. J. Crovello, and R. Unnasch. 1986. Geographic variation of vegetative characters of Populus deltoides. Syst. Bot. 11: 419_432.

Sokal, R. R. and N. L. Oden. 1978a. Spatial autocorrelation in biology. 1. Methodology. Biol. J. Linn. Soc. 10: 199_249.

Sokal, R. R. and N. L. Oden. 1978b. Spatial autocorrelation in biology. 2. Some biological implications and four applications of evolutionary and ecological interest. Biol. J. Linn. Soc. 10: 229_249.

Soltis, P. S. and D. E. Soltis. 1991. Genetic variation in endemic and widespread plant species: Examples from Saxifragaceae and Polystichum (Dryopteridaceae). Aliso 13: 215_223.

Xie, C. Y. and P. Knowles. 1991. Spatial genetic structure within natural populations of jack pine (Pinus banksiana). Can. J. Bot. 69: 547_551.


Botanical Bulletin of Academia Sinica, Vol. 37, 1996