Bot. Bull. Acad. Sin. (1997) 38: 145-152

Lai and Hsiao — Genetic variation of Phyllostachys pubescens

Genetic variation of Phyllostachys pubescens (Bambusoideae, Poaceae) in Taiwan based on DNA polymorphisms

C.C. Lai and J.Y. Hsiao1

Department of Botany, National Chung Hsing University, Taichung, Taiwan, Republic of China

(Received August 26, 1996; Accepted March 27, 1997)

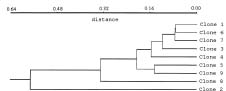
Abstract. Phyllostachys pubescens is an economically important bamboo species in Taiwan. It was introduced from mainland China probably around the middle of the eighteenth century by immigrants. The purpose of the present study is to identify clones and to study clonal distribution in Taiwan based on DNA polymorphisms. One hundred and seventy-six samples were collected around the island. Genomic DNA fragments were amplified using 13 RAPD primers, 3 microsatellite primers, and 1 minisatellite primer. The resulting amplification patterns were used for clone identification. Nine clones were identified from these samples. The relationship between these clones was studied using cluster analysis and principle co-ordinate analysis. The species is reproduced mainly by the rapid spreading of its rhizomes. The results of the present study revealed that its genetic variation is very limited. The center of variation is in Nantou County. The region around Nantou County consisted of all of the nine identified clones while the remaining regions generally consisted of only one common clone. This evidence indicated that the Nantou region might be the first area of successful introduction and that the cultivation later spread to other regions.

Keywords: Genetic variation; Microsatellite; Minisatellite; Phyllostachys pubescens; Poaceae; RAPD.

Introduction

Phyllostachys pubescens Mazel ex H. de Lahaie (Bambusoideae, Poaceae) is an introduced and economically important bamboo species with leptomorph rhizome in Taiwan. It is native in mainland China south of the Yangzie River and distributed mainly in the provinces of Zehchian, Fukien, Chianshi, and Hunan. The time of introduction to Taiwan, though uncertain, is thought to be around the middle of the eighteenth century as people from mainland China started to immigrate to Taiwan. In Taiwan, the species is cultivated mainly in central Taiwan west of the central mountain ranges at the elevation of 150_ 1,600 meters. Almost every part of the plant is usable. The rhizomes are employed in making handcrafts. The culms are used for building materials, tools, and handcrafts. The branches are used for making brooms. The young bamboo shoots are edible, and it is a delicacy in Chinese cuisine.

Previous studies of the species concentrated mainly on the growth characteristics of single bamboo shoot and bamboo stands (Liu et al., 1974; Lui et al., 1982) and the management of bamboo stands (Lin, 1958). Other studies include the structure of bamboo stem (Chiang, 1968), flower morphology (Lin, 1974), and pollen grain morphology (Wang, 1970). No studies have been reported concerning the genetic variation of the species. The species is

mainly reproduced asexually by the rapid spreading of its rhizomes. The purpose of the present study is to discover how many clones exist and how they are distributed in Taiwan at the present day.

Since the development of the Random Amplified Polymorphic DNA method (RAPD) by Williams et al. (1990), it has been widely employed in many fields of investigation, such as studies on taxonomic relationships, studies on gene flow, genetic map constructions, hybrid and parentage identifications, cultivar and clone identifications, and population genetic structure studies. As a tool for cultivar and clone identifications, RAPD has been demonstrated to be a method with high resolution (e.g., Hu and Quiros, 1991; Arnold et al., 1991; Klein-Lankhorst et al., 1991; Hsiao and Rieseberg, 1994). As an example of clone identification, in the study by Hsiao and Rieseberg (1994) 51 samples of Yushan cane collected 1 meter apart from a 50 meter transect at Mt. Hohuan in central Taiwan were shown to consist of 31 clones. Yushan cane is a bamboo species reproduced asexually by rhizome spreading. Due to its high resolution ability for clone identification, RAPD is the method of choice for the present study. Other methods that have the potential for cultivar and clone identification are microsatellite and minisatellite primed PCRs. These methods use single microsatellite or minisatellite sequence as primer to amplify DNA segments. These approaches have been employed for cultivar and clone identification with some success (e.g., Matsuyama et al., 1993; Hamann et al., 1995) and were also used in the present study.

1Corresponding author.


Botanical Bulletin of Academia Sinica, Vol. 38, 1997

Materials and Methods

Materials

A total of 176 leaf samples and voucher specimens were collected from 23 sampling sites throughout its distribution range in Taiwan (Table 1). Samples were collected at 25 meter intervals on a transect at each site. Leaf samples were kept in an ice chest before transport to the labora

tory and were then stored in a -70°C freezer before DNA extraction.

DNA Extraction and Quantification

DNA extraction followed the CTAB method of Doyle and Doyle (1987). For each sample, 30 mg of fresh leaves were ground with sea sand and liquid nitrogen and extracted with 0.8 ml CTAB extraction solution. DNA was

Table 1. Sources of the samples studied and the clones identified.

Sampling site (County) Date Sample # Clone #

18 km of Nantou County 1995/1/25 1 Clone 2

Road #151 (Nantou) 2 Clone 1

3 Clone 1

4 Clone 1

5 Clone 1

6 Clone 1

7 Clone 1

8 Clone 1

9 Clone 1

10 Clone 1

15 km of Nantou County 1995/1/25 11 Clone 1

Road #151 (Nantou) 12 Clone 1

13 Clone 1

14 Clone 1

15 Clone 1

16 Clone 1

17 Clone 1

18 Clone 3

19 Clone 1

20 Clone 1

14 km of Nantou County 1995/1/25 21 Clone 1

Road #151 (Nantou) 22 Clone 1

23 Clone 1

24 Clone 1

25 Clone 1

26 Clone 1

27 Clone 1

28 Clone 1

29 Clone 1

30 Clone 1

31 Clone 1

32 Clone 1

15.5 km of Nantou County 1995/4/29 33 Clone 1

Road #151 (Nantou) 34 Clone 1

35 Clone 6

36 Clone 1

37 Clone 1

38 Clone 1

39 Clone 1

40 Clone 1

41 Clone 1

42 Clone 1

43 Clone 1

44 Clone 7

45 Clone 1

46 Clone 3

47 Clone 1

48 Clone 1

49 Clone 4

50 Clone 1

Sampling site (County) Date Sample # Clone #

51 Clone 1

52 Clone 8

53 Clone 1

54 Clone 1

55 Clone 1

56 Clone 1

57 Clone 1

58 Clone 1

59 Clone 1

60 Clone 1

61 Clone 1

62 Clone 1

63 Clone 5

64 Clone 1

65 Clone 1

16.4 km of Nantou County 1995/5/3 66 Clone 1

Road #149 (Nantou) 67 Clone 1

68 Clone 1

69 Clone 1

70 Clone 1

71 Clone 1

72 Clone 1

73 Clone 1

74 Clone 9

75 Clone 1

76 Clone 1

77 Clone 1

78 Clone 9

79 Clone 1

80 Clone 1

81 Clone 1

82 Clone 1

83 Clone 1

84 Clone 1

85 Clone 1

86 Clone 1

87 Clone 1

88 Clone 1

89 Clone 1

90 Clone 1

91 Clone 1

92 Clone 1

Fonghuongshan (Nantou) 1995/2/15 93 Clone 1

94 Clone 1

95 Clone 1

96 Clone 1

97 Clone 1

98 Clone 1

99 Clone 1

100 Clone 1


Lai and Hsiao — Genetic variation of Phyllostachys pubescens

Sampling site (County) Date Sample # Clone #

101 Clone 1

102 Clone 1

103 Clone 1

104 Clone 1

19.5 km of Dasheishan 1995/5/30 105 Clone 1

Forest Road (Taichung) 106 Clone 1

107 Clone 1

108 Clone 1

109 Clone 1

17.5 km of Dasheishan 1995/5/30 110 Clone 1

Forest Road (Taichung) 111 Clone 1

112 Clone 1

15 km of Dasheishan 1995/5/30 113 Clone 1

Forest Road (Taichung) 114 Clone 1

115 Clone 1

116 Clone 1

20 km of Dasheishan 1995/9/28 117 Clone 1

Forest Road (Taichung) 118 Clone 1

119 Clone 1

120 Clone 1

121 Clone 1

122 Clone 1

123 Clone 1

124 Clone 1

Beside administration 1995/4/22 125 Clone 1

office of Huesun Forest 126 Clone 1

Park (Taichung)

Down slope beside 1995/4/22 127 Clone 1

administration office of 128 Clone 1

Huesun Forest Park

(Taichung)

Up slope beside parking 1995/4/22 129 Clone 1

lot of Huesun Forest 130 Clone 1

Park (Taichung)

30 km of Taiwan Provincial 1995/8/1 131 Clone 1

Road #18 (Chiayi) 132 Clone 1

133 Clone 1

36.4 km of Taiwan 1995/8/1 134 Clone 1

Provincial Road #18 135 Clone 1

(Chiayi) 136 Clone 1

Sampling site (County) Date Sample # Clone #

49.5 km of Taiwan 1995/8/1 137 Clone 1

Provincial Road #18 138 Clone 1

(Chiayi) 139 Clone 1

140 Clone 1

52 km of Taiwan Provincial 1995/8/1 141 Clone 1

Road #18 (Chiayi) 142 Clone 1

143 Clone 1

144 Clone 1

145 Clone 1

146 Clone 1

61 km of Taiwan Provincial 1995/8/1 147 Clone 1

Road #18 (Chiayi) 148 Clone 1

149 Clone 1

150 Clone 1

151 Clone 1

20 km of Chiayi County 1995/9/24 152 Clone 1

Road #169 (Chiayi) 153 Clone 1

154 Clone 1

155 Clone 1

156 Clone 1

157 Clone 1

158 Clone 1

12 km of Chiayi County 1995/9/24 159 Clone 1

Road #169 (Chiayi) 160 Clone 1

161 Clone 1

162 Clone 1

163 Clone 1

Ginjunshan, Taimali 1995/4/21 164 Clone 1

(Taitung) 165 Clone 1

166 Clone 1

167 Clone 1

168 Clone 1

169 Clone 1

Sanpin Seedling Garden, 1995/2/22 170 Clone 1

Liougue Forest Experimental 171 Clone 1

Station (Kaushiun) 172 Clone 8

Chinshan Center, 1996/4/1 173 Clone 1

Yangmingshan National 174 Clone 1

175 Clone 1

176 Clone 1

precipitated with isopropanol, and after washing with 76% ethanol washing solution, DNA was dissolved in TE buffer. The DNA concentration was measured using Hoefer TKO 100 fluorometer with Hoechst dye solution.

DNA Amplification

In a preliminary analysis, 140 random primers (Operon Tech. Inc., USA; kits A, B, C, D, E, Q, and V) were screened for the suitability of RAPD investigation using 5 samples randomly chosen from Nantou area. Among these primers, 13 primers with better amplification results were chosen for the present RAPD study. Besides RAPD primers, 3 microsatellite sequences and 1 minisatellite sequence were also used as primers in the single primer amplifications. The nucleotide sequences of these primers were listed in Table 2. The procedure of Williams et al. (1990) with minor modification on temperature profile was employed in the RAPD study. The temperature used in the present study was as follows:

94°C 2 mins;

94°C 20 secs, 36°C 45 secs, 72°C 2 mins, 44 cycles;

72°C 5 mins;

4°C end.

The PCR procedure using microsatellite and minisatellite sequences as primers followed basically those of Meyer et al. (1993) with slight modification on temperature profile. The temperature profile used was as follows:

94°C 3 mins;

94°C 1 mins, 50°C 45 secs, 72°C 2 mins, 44 cycles;

72°C 6 mins;

4°C end.

Amplification reactions were performed in volumes of 25 µl in 0.5-ml microfuge tubes using fifteen nanograms of DNA. The amount of DNA polymerase (HT Inc., USA) was 0.2 U in each reaction tube. And all these reactions


Botanical Bulletin of Academia Sinica, Vol. 38, 1997

nized. Clone numbers for each sample are listed in Table 1. Figure 1 shows the band patterns of these 9 clones using one of the RAPD primers (V7). The data of the 40 recorded bands for each clone are listed in Table 3. The similarity and distance for each clone-pair were calculated based on the data of 15 polymorphic bands, and the resulting distance matrix (Table 4) was used in a UPGMA cluster analysis and a principle co-ordinate analysis to estimate relationship among clones. The results of the cluster analysis and principle co-ordinate analysis are shown in Figure 2 and Figure 3, respectively. The cophenetic correlation coefficient of cluster analysis is 0.917. Figure 2 shows that 9 clones are divided into two major clusters. Clone 2 forms a cluster by itself while the remaining 8 clones group into another cluster. Within the latter cluster, clone 8 links with other clones at a high distance value of 0.572. Therefore clone 2 and clone 8 are

Table 2. Nucleotide sequences of primers used.

A9 5' GGG TAA CGC C 3'

B1 5' GTT TCG CTC C 3'

B17 5' AGG GAA CGA G 3'

C2 5' GTG AGG CGT C 3'

C5 5' GAT GAC CGC C 3'

C11 5' AAA GCT GCG G 3'

D3 5' GTC GCC GTC A 3'

E3 5' CCA GAT GCA C 3'

Q5 5' CCG CGT CTT G 3'

Q12 5' AGT AGG GCA C 3'

Q13 5' GGA GTG GAC A 3'

Q16 5' AGT GCA GCC A 3'

V7 5' GAA GCC AGC C 3'

(CAC)5 5' CAC CAC CAC CAC CAC 3'

(AGC)5 5' AGC AGC AGC AGC AGC 3'

(CAG)5 5' CAG CAG CAG CAG CAG 3'

M13 5' GAG GGT GGN GGN TCT 3'

were performed by PTC-100 thermal controller (PTC-100 60; MJ Research Inc., USA). Amplification products were analyzed by 1.5% agarose gel (15 × 21 cm) electrophoresis in TBE buffer. Gels were run at 200 V for 2 h and products were detected by staining with 0.5 µg/ml ethidium bromide. A molecular weight marker (1-kb ladder; Gibco BRL) was used on each run.

Statistical Analysis

The high intensity and highly reproducible bands resulting from the electrophoretic separation of amplification products for each sample were recorded. Clones were identified based on the presence or absence of polymorphic bands. The similarity between each pair of clones was calculated using the formula of Dice (1945) employing RAPDistance software version 1.03 (Armstrong et al., 1994) based on polymorphic bands only as follows:

SAB = 2N11 / [(2 × N11) + N01 + N10]

in which N11 is the number of bands present in both clone A and clone B, and N01 is the number of bands absent in clone A but present in clone B, and N10 is the number of bands present in clone A but absent in clone B. The similarities were then converted into distances (distance = 1 - SAB). The resulting distance matrix was used in a cluster analysis using UPGMA (unweighted pair-group method using arithmatic averages; Sneath and Sokal, 1973) and a principle co-ordinate analysis to estimate relationship among clones by employing NTSYS-pc (version 1.80) software (Rohlf, 1993).

Results

RAPD Study

The presence or absence of bands at 40 high intensity band sites was recorded for each sample. Among these sites, 25 were monomorphic while 15 were polymorphic. Samples with a completely identical band pattern were treated as a clone and a total of nine clones were recog

Figure 1. Amplification patterns using RAPD V7 primer. (left to right: clone 1 to clone 9; the left most lane: molecular size markers).

Figure 2. Phenogrom based on 15 polymorphic RAPD bands.

Figure 3. Result of principle co-ordinate analysis based on 15 polymorphic RAPD bands.


Lai and Hsiao — Genetic variation of Phyllostachys pubescens

Table 3. Data of RAPD bands for the clones identified.

Primer A9 B1 V7 C2 C11 Q5 B17 Q12 Q13 E3 Q16 D3 C5

Fragment (kb) 1.10 0.72 0.50 0.41 0.34 0.65 0.49 0.40 1.00 0.92 0.85 0.72 0.52 0.60 0.50 0.47 0.65 0.60 0.52 0.76 0.60 0.50 0.55 0.45 0.35 0.51 0.45 0.55 0.46 0.40 0.51 0.42 0.92 0.43 0.32 0.95 0.70 0.34 0.85 0.60

Clone 1 + + + + + + + + + + + + + + + + + + + + + + + + + + + + + + + + + + + + + + + +

Clone 2 _ _ + _ + + + _ + _ _ + + + + + + + + _ _ + + + + + + + + + _ + + + _ + + + + +

Clone 3 + + + + + + + + + _ + + + + + + + + + + + + + + + + + + + + + + + + + + _ _ + +

Clone 4 + _ + + + + + + + _ + + + + + + + + + + + + + + + + _ + + + + + + + + _ + + + +

Clone 5 _ + + + + + + + + _ + + + + + + + + + + _ _ + + + + + + + + + + + + + + + + + +

Clone 6 + _ + + + + + + + _ + + + + + + + + + + + + + + + + + + + + + + + + + + + + + +

Clone 7 + + + + + + + + + _ + + + + + + + + + + + _ + + + + + + + + + + + + + + + + + +

Clone 8 _ _ + + + + + + + _ _ + + + + + + + + + + _ + + + + _ + + + + + + + + _ _ + + +

Clone 9 + + + + + + + + + _ _ + + + + + + + + _ _ _ + + + + + + + + + + + + + + + + + +

+: presence; _: absence.

Table 4. Distance matrix of the clone-pairs.

Clone 1 Clone 2 Clone 3 Clone 4 Clone 5 Clone 6 Clone 7 Clone 8 Clone 9

0 0.500000 0

0.111111 0.647059 0

0.153846 0.625000 0.217391 0

0.153846 0.500000 0.217391 0.272727 0

0.071429 0.444444 0.120000 0.083333 0.166667 0

0.071429 0.555556 0.120000 0.166667 0.083333 0.076923 0

0.363636 0.833333 0.368421 0.222222 0.333333 0.300000 0.300000 0

0.200000 0.466667 0.272727 0.333333 0.142857 0.217391 0.130435 0.411765 0

more isolated genetically from other clones. Clone 2 differs from other clones mainly in bands A90.41, and Q160.32. These bands are absent in clone 2 but present in all but one of the other clones. The result of principle co-ordinate analysis (Figure 3) also shows that clone 2 and clone 8 are distinctly isolated while the other 7 clones do not show a tendency toward major groupings. This result is consistent with that of cluster analysis.

Among 9 clones identified, clone 1 has the widest distribution range. It is the dominant clone in every county area studied. In the Nantou County area, the other clones, apart from clone 1, are also present although their distribution is restricted. Kaushiun County has clone 1 and clone 8. Only clone 1 occurs in Taichung, Chiayi, Taitung, and Taipei counties (Table 1).

Microsatellite and Minisatellite PCR Studies

The data of 25 high intensity bands using microsatellite and minisatellite sequence primers in the single primer amplification reaction are listed in Table 5. Figure 4 is the band pattern using one of the microsatellite primers (CAC)5. Figure 5 also shows the band patterns using minisatellite M13 primer. Four band patterns are observed when (CAC)5 is used as primer. Clones 1, 4, 5, 6, 7, and 8 have the same band pattern while clones 2, 3, and 9 each has its own distinct pattern. Only 2 patterns are observed when (AGC)5 primer is used. Clone 2 has its own distinct pattern while the other 8 clones have the same pattern. Clone 2 differs from the other clones in the absence of a 0.7 kb band. There are 3 band patterns produced with

(CAG)5 primer. Clone 1, 2, 6, and 8 belong to one pattern. Clone 3 and 5 have the same pattern. Clone 4, 7, and 9 belong to the third pattern. Three band patterns are observed when minisatellite M13 is used as primer. Clone 1, 3, 5, 6, 7, 8, and 9 have identical patterns while clone 2 and clone 4 each has its own distinct pattern. These results indicate that, in comparison with RAPD, microsatellite and minisatellite PCR have poorer resolution for the purpose of clone identification in this species. No primers could be used to distinguish 9 clones identified from RAPD study. No new clones in addition to those identified from RAPD could be established by these approaches.

Discussion

Phyllostachys pubescens is a native species of mainland China. It is uncertain when it was introduced into Taiwan although it is generally believed to have been around the middle of the eighteenth century and brought to the island by immigrants. The result of RAPD study shows that most of the species currently distributed in Taiwan belong to a single clone, the clone 1 designated in the present study. This explains why the species appear so morphologically uniform in Taiwan. However, besides this dominant clone, we discovered 8 other clones to exist in the island although their distribution is very restricted. Nantou County in central Taiwan has all of the 9 clones identified. Kaushiun County has clone 1 and clone 8. The remaining counties studied are found to consist exclusively


Botanical Bulletin of Academia Sinica, Vol. 38, 1997

Table 5. Data of amplified bands using microsatellite and minisatellite sequences as primers.

Primer (CAC)5 (AGC)5 (CAG)5 M13

Fragment (kb) 1.40 1.30 1.20 0.85 0.63 0.50 0.47 1.40 1.05 0.80 0.70 0.60 0.51 1.02 0.82 0.80 0.76 0.65 0.50 0.55 0.51 0.46 0.40 0.34 0.30

Clone 1 + + + + + + + + + + + + + + + + + + + + + + _ + +

Clone 2 + + _ _ + + + + + + _ + + + + + + + + + + + + + +

Clone 3 _ + _ + + + + + + + + + + _ + _ + + + + + + _ + +

Clone 4 + + + + + + + + + + + + + + + _ + + + _ + + _ + +

Clone 5 + + + + + + + + + + + + + _ + _ + + + + + + _ + +

Clone 6 + + + + + + + + + + + + + + + + + + + + + + _ + +

Clone 7 + + + + + + + + + + + + + + + _ + + + + + + _ + +

Clone 8 + + + + + + + + + + + + + + + + + + + + + + _ + +

Clone 9 + _ + + + + + + + + + + + + + _ + + + + + + _ + +

+: presence; _: absence.

Figure 4. Amplification patterns using microsatellite (CAC)5 primer. (left to right: clone 1 to clone 9; the left most lane: molecular size markers).

Figure 5. Amplification patterns using minisatellite M13 primer. (left to right: clone 1 to clone 9; the left most lane: molecular size markers).

of clone 1 only. The center of variation is found to be in Nantou County. Outside Nantou County, the species appears to consist of pure stands of clone 1 except for one sample from Liougue Forest Experimental Station in Kaushiun County, which is believed to have been planted recently and to belong to clone 8. The distribution pattern of the species in Taiwan indicates that the Nantou County area, especially around Lugu and Chushan, might be the first place of introduction. Successful bamboo stands may have been established here first, and then cultivation spread to other counties using rhizomes from these established stands. Since clone 1 is the dominant clone in the Nantou area, as it spread to other areas, the chance of it being sampled would be much greater than for other clones. This might explain why the other areas generally consist of pure stands of clone 1.

Although only 9 clones were found in the present study, it is expected that the number of clones with restricted distributions could increase if sample size were increased. However, the fact that clone 1 is dominant in all of the areas probably will remain unchanged. There are two possibilities concerning the origin of the clones observed: One

possibility, the major one, is that these clones existed in the native populations in mainland China and that they were brought to Taiwan by immigrants. The other possibility is that some of these clones may have developed after introduction through somatic mutation from clones already established in the island. The results of cluster analysis (Figure 2) and principle co-ordinate analysis (Figure 3) show that clone 2 and clone 8 are genetically isolated, both from each other and from the remaining 7 clones. These two clones have greater possibility of being originated through introduction. The other clones are genetically more similar. Besides the possibility of being originated through introduction, it is also possible that some of them may have been originated through somatic mutation. Lui et al. (1982) studied the growth of young buds of the species and found that it is completely random whether a young bud will grow to become a new rhizome or become a new bamboo shoot. If a somatic mutation occurs in a young bud which eventually becomes a new bamboo shoot, then there is no chance of forming a new clone. Only when somatic mutations occur in a young bud which grows into a new rhizome is there a chance of establishing a new clone.


Lai and Hsiao — Genetic variation of Phyllostachys pubescens

It has been estimated that the total cultivation area of Phyllostachys pubescens in Taiwan increased from 1,942 hectares in 1942 to 3,296 hectares in 1973 (Lin and Li, 1973) due to its high economic value at that time. Recently, the economic value of the species has decreased steadily, and many bamboo stands have been cleared for the planting of tea plants and Areca catechu since these species have higher cash values. The total cultivation area of this bamboo species has decreased considerably although the actual figure has not been estimated. This factor has the tendency to reduce genetic variation. Therefore, the factors that influence the population genetic variation of this bamboo species in Taiwan can be summarized as follows: 1) the number of clones introduced from mainland China, 2) the possibility of forming new clones through somatic mutation, and 3) the management and the clearing of bamboo stands.

Acknowledgment. This study was supported by grant NSC 83-0211-B-005-007 from the National Science Council, Republic of China.

Literature Cited

Armstrong, J. S., A. J. Gibbs, R. Peakall, and G. Weiller. 1994. The RAPDistance Package. obtainable via Anonymous ftp or WWW ftp://life.anu.edu.au/pub/RAPDistance or http://life.anu.edu.au/molecular/software/rapd.html

Arnold, M. L., C. M. Buckner, and J. J. Robinson. 1991. Pollen-mediated introgression and hybrid speciation in Louisiana irises. Proc. Natl. Acad. Sci. USA 88: 1398_1402.

Chiang, F. C. 1968. A preliminary study on the wood structure of major bamboo species in Taiwan. Taiwan Forestry Experiment Institution Report No. 170, Taipei.

Dice, L. R. 1945. Measures of the amount of ecologic association between species. Ecology 26: 297_302.

Doyle, J. J. and J. J. Doyle. 1987. A rapid DNA isolation procedure for small quantities of fresh leaf tissue. Phytochem. Bull. 19: 11_15.

Hamann, A., D. Zink, and W. Nagl. 1995. Microsatellite fingerprinting in the genus Phaseolus. Genome 38: 507_515.

Hsiao, J. Y. and L. H. Rieseberg. 1994. Population genetic structure of Yushania niitakayamensis (Bambusoideae, Poaceae) in Taiwan. Mol. Ecol. 3: 201_208.

Hu, J. and C. F. Quiros. 1991. Identification of broccoli and cauliflower cultivars with RAPD markers. Plant Cell Rep. 10: 505_511.

Klein-Landhorst, R. M., A. Vermunt, R. Weide, T. Liharska, and P. Zabel. 1991. Isolation of molecular markers for tomato (L. esculentum) using random amplified polymorphic DNA (RAPD). Theor. Appl. Genet. 83: 108_114.

Lin, W. Z. and C. Y. Li. 1973. The cultivation of economic woody bamboo species. Agriculture Re-vitalization Committee, Taipei.

Lin, W. C. 1958. A study on the growth of bamboo species in Taiwan. Taiwan Forestry Experiment Institution Report No. 54, Taipei.

Lin, W. C. 1974. A study on the floral morphology of bamboo species. Taiwan Forestry Experiment Institution Report No. 248, Taipei.

Liu, S. C., Y. A. Zun, T. S. Yeh, and C. G. Kuo. 1974. Studies on the habitats and growth of major bamboo stands in Taiwan (II) Phyllostachys pubescens. Taiwan Forestry Experiment Institution Report No. 243, Taipei.

Lui, G. M., J. C. Liu, and W. C. Lin. 1982. The cultivation experiment on the re-generation and improvement of the bamboo stands of Phyllostachys pubescens (I) The growth characteristics of single bamboo shoot. Taiwan Forestry Experiment Institution Report No. 367, Taipei.

Matsuyama, T., M. Omura, and T. Akihama. 1993. DNA fingerprinting in Citrus cultivars. Techniques on Gene Diagnosis and Breeding in Fruit Trees. Fruit Tree Research Station, Ibaraki, pp. 26_30.

Meyer, W., E. Lieckfeldt, K. Kuhls, E. Z. Freedman, T. Borner, and T. G. Mitchell. 1993. DNA- and PCR-fingerprinting (RAPD) in fungi. In DNA Fingerprinting: State of the Science. Birkhauser Verlag ed., Boston, pp. 311_320.

Rohlf, F. J. 1993. NTSYS-pc Numerical Taxonomy and Multivariate Analysis System. Applied Biostatistics Inc., New York.

Sneath, P.H.A. and R.R. Sokal. 1973. Numerical Taxonomy. W.M. Freeman and Company, San Francisco.

Wang, Z. L. 1970. A study on the pollen grain morphology of the bamboo tribe in Taiwan. Taiwan Forestry Experiment Institution Report No. 192, Taipei.

Williams, J.G.K., A.R. Kubelik, K.J. Livak, J.A. Rafalski, and S.V. Tingey. 1990. DNA polymorphisms amplified by arbitrary primers are useful as genetic markers. Nucleic Acids Res. 18: 6531_6535.