Bot. Bull. Acad. Sin. (1997) 38: 267-272

Park and Chung — Gene flow in Hosta

Indirect measurement of gene flow in Hosta capitata (Liliaceae)

Ki Bae Park1 and Myong Gi Chung2,3

1Department of Horticulture, Ansung National University, Ansung 456-749, The Republic of Korea

2Department of Biology, Gyeongsang National University, Chinju 660-701, The Republic of Korea

(Received March 7, 1997; Accepted July 22, 1997)

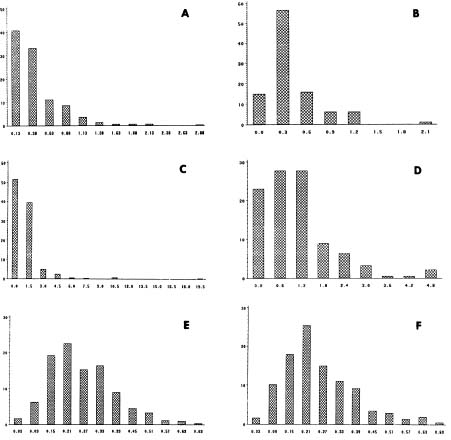
Abstract. We investigated the nearest neighbor distances between plants, pollinator flight distances, and seed dispersal distances in two natural populations of Hosta capitata to estimate indirectly the neighborhood area and size of this species. As with most insect-pollinated species, the frequencies and shapes of all three variables showed significant skewness and leptokurtosis. Means of pollinator (bumblebees and Apis) flight distances and seed dispersal distances of H. capitata were about 1 m and 25 cm, respectively. In addition, although neighborhood sizes differed (ca. 15 and 64 individuals), as did neighborhood areas (5.86 to 17.13 m2), between the two populations, these results indicated substantial spatial restriction of gene flow within them. The present results in conjunction with previous studies on fine and large scale genetic structure using allozymes as genetic markers within and among populations of H. capitata strongly indicate that gene flow is sufficiently restricted to allow stochastic effects to play an important role in determining the genetic structure of this species.

Keywords: Gene flow; Genetic drift; Hosta capitata; Pollinators; Seed dispersal.

Introduction

The effective population size (Ne) is related to the effective number of individuals in a plant population that interbreed randomly, taking into consideration population density and the variances in gene flow components. In other words, pollen travel and seed dispersal are two components of gene flow in plant populations. These patterns in conjunction with the varying density of individuals determine the Ne. Neighborhood is the area within a plant population in which panmixis, that is, random gene exchange via pollen and seed dispersal occurs (Wright, 1946). Levels of gene flow affect Ne and the magnitude of Ne determines the magnitude and direction of the evolutionary factors acting on the genetic variation within populations (Wright, 1938). For example, high rates of gene flow over large geographical areas increases Ne and can overshadow the influence of natural selection or genetic drift, reducing genetic differentiation. Thus, accurate measures of gene flow have been of continued interest to evolutionary biologists. However, relatively few studies of neighborhood sizes in plants have been reported in the plant population biology literature (Richards, 1986), partly due to two practical reasons or problems, as suggested by Richards (1986): 1) measurements of gene movement tend to vary considerably spatially and temporally and 2) estimations of Ne are largely dependent on plant density.

Hosta capitata (Koidz.) Nakai (Liliaceae), an herbaceous perennial, occurs in the southern Korean Peninsula and southwestern Japan (Fujita, 1976; Chung and Kim,

1991). In Korea, most populations of the species are relatively small and isolated compared with other Korean hostas (Chung et al., 1991) and are found in pine-oak forest understories and in grasslands in mountainous regions. As the specific epithet indicates, 3_12 flowers are clustered on the top of a scape. Flowers are visited by bees (Bombus diversus diversus and Apis mellifera; Chung, 1994a). Although studies on the breeding system are not available, H. capitata appears to be predominantly outcrossing because most of the flowers have pronounced spatial separation (herkogamy) of mature anthers and stigmas impeding self-pollination. The fruit of this species is a cylindrical capsule, with 10_30 small (3.0_5.5 mm) seeds in each capsule. The seeds are winged. Previous studies have reported that populations of H. capitata maintain low levels of allozyme diversity and there is high allozyme divergence among populations (Chung et al., 1991; Chung, 1994a). In an effort to understand factors affecting levels of genetic variation within populations and the population genetic structure of H. capitata, the senior author has investigated spatial genetic structure within and among its populations in Korea using spatial autocorrelation analysis (Chung, 1996, 1997). These studies indicate that gene flow within a circumscribed area and among populations is considerably low, suggesting that neighborhood size and area are small. As the physical distances of dispersal should be related to the density of individuals in order to relate to the physical scale of spatial structure (Epperson, 1995), information (e.g., Wright's neighborhood size and area) concerning the standardized dispersal in populations of H. capitata is necessary. In this study, nearest neighbor distances between plants of the insect-pollinated, H. capitata were measured. In addition, pollinator flight and seed dispersal distances were also measured in two natural popu

3Corresponding author. Fax: +82-591-54-0086.


Botanical Bulletin of Academia Sinica, Vol. 38, 1997

lations to estimate indirectly the neighborhood size and area of this species. It should be noted here, however, that indirect measures of gene flow through pollinator observation may not reflect realized gene flow and may only provide minimum estimates of actual gene flow because this method often ignores pollen carryover and flights out of the study site (Schaal, 1980).

Materials and Methods

On 22 and 23 July 1988, two populations of Hosta capitata were examined at Nogodan and Daejireung (elevation ca. 1510 and 1530 m, respectively) in the Chiri Mts., South Korea. Nearest neighbor distances were measured for 398 and 101 inflorescences, respectively. Pollinator flight distances were also measured on the basis of the distance flown within inflorescence and between consecutive inflorescences based on every new pollinator's visitations. Two different putative pollinators (Bombus diversus diversus and Apis mellifera) were observed for five hours for the Nogodan population. During the period of observation, a total of 561 visits by Bombus diversus diversus and 79 visits by Apis mellifera were recorded at the Nogodan population. Only Bombus sp. were observed at the Daejireung population. Population densities were estimated by direct counts using a 5 × 5-m square. Seven quadrat samples were recorded. On 16 to 18 September 1996, the two populations were visited again to measure distances of seed dispersal. At the Nogodan population, We selected 32 scapes bearing dehiscing capsules, each scape separated by at least 3 m. We removed underground grasses and other plants and then wrapped white paper sheets (3 m by 3 m) around each maternal plant. At the Daijireung population, 28 scapes were examined. Seed dispersal distances were determined by measuring the distance from the center of the scape to the spot where the seed landed. It should be noted that the estimates of primary seed movement are probably also rather serious underestimates. The secondary movement of seeds after they have reached the ground is likely and can be extensive.

Data analyses were performed using the Statistical Analysis System (SAS Institute, 1982). Descriptive statistics were produced by PROC UNIVARIATE and fre

quency histograms were produced by PROC CHART. Departures from normality, as measured by skewness (g1) and kurtosis (g2), were calculated for distributions of interplant distances, pollinator flight distances, and seed dispersal distances, as well as t - tests on these values as described by Sokal and Rohlf (1981). A negative g1 indicates skewness to the left; a positive g1, skewness to the right. A negative g2 indicates playkurtosis, and a positive g2, leptokurtosis.

The effective population size (Ne), was estimated using the equation, Ne = 12.6 D (varS + 1/2 varP) (Crawford, 1984), where varS = variance of the seed dispersal distribution, varP = variance of the pollen dispersal distribution, and D = plant density. Neighborhood area (Na) was calculated by dividing the effective neighborhood size by the population density.

Results

The means between nearest neighbor distances and pollinator flight distances at the two sites showed significant differences (t = -10.6 and -7.91, df = 735.5 and 264.9, P < 0.0001). In addition, variances for the two variables at each site are also statistically different (F = 20.59 and 7.63, df = [639, 397] and [190, 100], P < 0.0001). Variances of pollinator flight distances at the two sites are statistically different (F = 2.95, df = [639, 190], P < 0.0001) even though the means are not (t = 1.16, df = 546.4, P > 0.247). On the other hand, the variances and means of seed dispersal distances and nearest neighbor distances at the Nogodan population are not statistically different from each of those for the Daejireung population (F = 1.16 and 1.09, df = [582, 551] and [397, 100], P > 0.075 and P > 0.594; t = -0.991 and 0.137, df = 1133 and 497, P > 0.322 and P > 0.891). Univariate statistics for nearest neighbor plant distances, pollinator flight distances, and seed-dispersal distances of H. capitata are presented in Table 1. The frequency histogram for nearest neighbor distances (g1 = 2.41 and 2.23), pollinator flight distances (6.41 and 1.88), and seed dispersal distances (1.02 and 0.74) shows a distribution significantly skewed to the right (Figure 1). All values are also highly significant (one-tailed, t-test, P < 0.001). In addition, the shapes of nearest neighbor distribution (g2 = 8.90 and 7.06) pollinator flight distribution

Table 1. Pollen and seed dispersal statistics for Hosta capitata in Nogodan (A) and Daejireung (B) populations in Mts. Chiri: number of nearest interplants (N), mean (X), standard deviation (SD), variance (s2), skewness (g1), kurtosis (g2), and t - statistics for skewness (t1) and kurtosis (t2) of pollinator flight and seed dispersal distances.

Estimate N X SD s2 g1 g2 t1 t2

Interplant A 398 0.41 0.36 0.13 2.41 8.90 19.75*** 36.32***

B 101 0.41 0.34 0.12 2.23 7.06 9.29*** 14.83***

Pollinator A 640 1.12 1.64 2.68 6.41 60.57 66.77*** 312.21***

B 191 1.01 0.95 0.91 1.88 4.62 10.56*** 13.05***

Seeds A 583 0.25 0.13 0.02 1.02 0.93 10.09*** 4.58***

B 552 0.26 0.12 0.01 0.74 0.52 7.08*** 2.47**

** = P < 0.01; *** = P < 0.001 (one-tailed t-test).


Park and Chung — Gene flow in Hosta

Figure 1. Frequency histograms of interplant distances (A and B), pollinator flight distances (C and D), and seed dispersal distances (E and F). A, C, and E represent Nogodan population and B, D, and F for Daejireung population. X axis represents distance and Y axis for proportion or percent.

(60.57 and 4.62), and seed dispersal distribution (0.93 and 0.52) are leptokurtic at the two populations (Table 1). These values are all also highly significant (one-tailed, t-test, all P < 0.001 except for seed dispersal distribution at Daejireung, P < 0.01).

Neighborhood size, neighborhood area, and average density are presented in Table 2. In these natural populations of H. capitata, neighborhood size, based on gene flow estimated indirectly from pollinator movement, are 15.17 and 64.22 individuals and neighborhood area are 5.86 and 17.13 m2.

Discussion

There are significant differences between nearest neighbor and pollinator flight distances. Bumblebees and Apis

obviously do not always move between nearest neighbors. If bumblebees and Apis were foraging optimally, they would minimize flight costs by minimizing flight distances between successively visited inflorescences, though they don't a priori know which ones have been visited already. Thus, pollinator behavior is influenced by changes in nectar (or pollen) rewards available in the flowers. As pollinator flight distances were observed from noon to afternoon, we do not know the differences between flight distances in the morning and those in the afternoon. More studies are needed to confirm periods of time in which nectar is more available. In addition, patterns of nectar availability could also play a significant role in the pattern of pollinator movement.

Recently, Chung (1994a) investigated levels of genetic diversity and gene flow in 19 Korean populations of H.


Botanical Bulletin of Academia Sinica, Vol. 38, 1997

Table 2. Neighborhood and plant density statistics for Hosta capitata: population density (D), neighborhood size (Ne), and neighborhood area (Na). Estimates in parenthesis only for pollen dispersal.

Population D Ne Na (m2)

Nogodan 3.75 64.22 (63.28) 17.13 (16.87)

Daejireung 2.59 15.17 (14.85) 5.85 (5.73)

capitata based on 25 isozyme loci. Levels of allozyme diversity within populations of the species (mean expected heterozygosity, He = 0.153) were considerably lower than those for H. minor (He = 0.230, Chung, 1994b), a narrowly distributed, Korean endemic species. In addition, partitioning of genetic variation among populations, as measured by Nei's (1973, 1977) GST, of H. capitata (GST = 0.308) was two times higher than that for H. minor (0.158; Chung, 1994b), indicating that gene flow among populations is low. Indirect estimates of the number of migrants per generation (Nm) (0.506 and 0.852; recalculated from Chung [1994a] based on mean GST and private alleles) were lower than those obtained for other species with similar life history traits (Hamrick, 1987). For neutral genes, Nm values less than 1.0 are considered insufficient to prevent divergence due to genetic drift (Wright, 1931). More recently, we have investigated fine-scale population genetic structure in two populations of H. capitata using spatial autocorrelation analysis of enzyme polymorphism (Chung, 1997). Significant positive Moran's I (Sokal and Oden, 1978) values were detected at the shorter distances (0 < 4.5 m). According to Sokal (1979), the distance at which mean Moran's I values first intercepts the expected I value may represent the shortest size of an irregularly shaped patch size, the approximate minimum patch sizes were calculated ranging from 7 to 20 m2. As genetic differentiation among populations is principally a function of gene flow among populations via pollen and seed dispersal (Loveless and Hamrick, 1984), the results of the present study strongly support the previous results. The means of pollinator flight distances and seed dispersal distances of H. capitata are about 1 m and 25 cm , respectively (Table 1). The neighborhood sizes of H. capitata range from 15 to 64 individuals and neighborhood areas from 5.86 to 17.13 m2. As there were no statistical differences for means and variances of seed dispersal distances and mean pollinator flight distances between the Nogodan and Daijireung populations, the main reason of varying neighborhood areas between the two sites can be attributed to the differences of variances for pollinator flight distances between the two sites. Although genetic patch size is usually many times larger than Ne (Epperson and Li, 1997), it is of interest to note that the neighborhood sizes estimated in this study are very comparable with approximate patch sizes obtained using spatial autocorrelation analysis of enzyme polymorphisms. This is partly due to the fact that the distribution of pollinator flight distances provides only a minimal estimate of the pollen component of gene movement due to high pollen carryover (Levin and Kerster, 1968; Levin, 1983; Schaal, 1980) and patch sizes obtained from Moran's I

were also minimum estimates (Berg and Hamrick, 1995). Hamrick (1987) argued that patch sizes seen for genotypes within populations should be significantly influenced by seed dispersal. Since gene movement in plants is a sequential, two-step process via pollen then by seed, observed patch structure will be most influenced by limited seed movement regardless of the distances of pollen movement. Even with long distance pollen movement, limited seed movement will result in patches of halfsibs.

As estimations of neighborhood size are heavily dependent on the density of plants under consideration, Richards (1986) argued that estimates of neighborhood size may be meaningless. He also, however, suggested that neighborhood area may be meaningful because estimates of neighborhood area are density independent. If this statement is true, it might be of interest to compare the neighborhood area of H. capitata with other herbaceous perennial entomophilous outbreeders, as presented in Richards (1986, Table 5.10, p.179). The neighborhood area of H. capitata estimated from this study is smaller than that of most other herbaceous perennials. Species with smaller effective neighborhood sizes are more likely to be affected by genetic drift (Kimura and Weiss, 1964), which lowers genetic variation within populations and enhances it among populations through chance or stochastic fluctuations. The restriction on pollen and seed movement is particularly strong when pollinators fly between nearest-neighbor plants and seeds disperse within a short distance. Turner et al. (1982) argued that restricted gene flow caused inbreeding and an increase in homozygosity, leading to microgeographic differentiation of the populations. The present results also revealed that nearest-neighbor pollination is clearly an important characteristic of pollination biology.

In summary, gene flow may be sufficiently restricted in two populations of H. capitata to allow chance effects such as genetic drift to play an important role in determining the genetic structure of this species.

Acknowledgements. I thank S. S. Kang, J. S. Son, N. W. Lee, and Y. H. Lee for their assistance in the field and Y. S. Kim for valuable suggestions on the data analyses. Special thanks go to B. K. Epperson for comments on the manuscript. This study was supported by a grant from the Korea Science and Engineering Foundation (96-0500-006-2).

Literature Cited

Berg, E.E. and J.L. Hamrick. 1995. Fine-scale genetic structure of a turkey oak forest. Evolution 49: 110_120.


Park and Chung — Gene flow in Hosta

Chung, M.G. 1994a. Genetic structure in Korean populations of Hosta capitata (Liliaceae). J. Plant Biol. 37: 277_284.

Chung, M.G. 1994b. Genetic variation and population structure in Korean endemic species: III. Hosta minor (Liliaceae). J. Plant Res. 107: 377_383.

Chung, M.G. 1996. Spatial genetic structure among Korean populations of Hosta minor and H. capitata (Liliaceae). Bot. Bull. Acad. Sin. 37: 25_30.

Chung, M.G. and K.B. Park. 1997. Spatial genetic structure in populations of Hosta capitata and H. minor (Liliaceae). Isr. J. Plant Sci. (in press).

Chung, M.G., J.L. Hamrick, S.B. Jones, and G.S. Derda. 1991. Isozyme variation within and among populations of Hosta (Liliaceae) in Korea. Syst. Bot. 16: 667_684.

Chung, M.G. and J.W. Kim. 1991. The genus Hosta Tratt. (Liliaceae) in Korea. Sida 14: 411_420.

Crawford, D.J. 1984. The estimation of neighborhood parameters for plant populations. Heredity 52: 273_283.

Epperson, B. K. 1995. Fine-scale spatial structure: correlations for individual genotypes differ from those for local frequencies. Evolution 49: 1022_1026.

Epperson, B.K. and T. Li. 1997. Gene dispersal and genetic structure. Evolution 51: 672_681.

Fujita, N. 1976. The genus Hosta (Liliaceae) in Japan. Acta Phytotax. Geobot. 27: 66_96. (in Japanese)

Hamrick, J.L. 1987. Gene flow and distribution of genetic variation in plant populations. In K. M. Urbanska (ed.), Differentiation Patterns in Higher Plants. Academic Press, New York, pp. 63_67.

Kimura, M. and G. Weiss. 1964. The stepping stone model of population structure and the decrease of genetic correlation with distance. Genetics 49: 561_576.

Levin, D.A. 1983. Plant parentage: An alternative view of the breeding structure of populations. In C.E. King and P.S. Dawson (eds.), Population Biology: Retrospect and Pros

pect. Columbia Univ. Press, New York, pp. 171_188.

Levin, D.A. and H.W. Kerster. 1968. Local gene dispersal in Phlox. Evolution 22: 130_139.

Loveless, M.D. and J.L. Hamrick. 1984. Ecological determinants of genetic structure in plant population. Annu. Rev. Ecol. Syst. 15: 65_95.

Nei, M. 1973. Analysis of gene diversity in subdivided populations. Proc. Natl. Acad. Sci. USA 70: 3321_3323.

Nei, M. 1977. F - statistics and analysis of gene diversity in subdivided populations. Ann. Human Genet. 41: 225_233.

Richards, A. J. 1986. Plant Breeding Systems. Allen & Unwin Inc., Winchester, MA.

SAS Institute. 1982. SAS User's Guide Statistics. SAS Inst., Inc., Cary, NC.

Schaal, B. A. 1980. Measurement of gene flow in Lupinus texensis. Nature 284: 450_451.

Sokal, R.R. 1979. Ecological parameters inferred from spatial correlograms. In G. P. Patil and M. L. Rosenzwig (eds.), Contemporary Quantitative Ecology and Related Ecometics. International Cooperative Publishing House, Failand, pp. 167_196.

Sokal, R.R. and N.L. Oden. 1978. Spatial autocorrelation in biology. 1. Methodology. Biol. J. Linn. Soc. 10: 199_249.

Sokal, R.R. and F.J. Rohlf. 1981. Biometry. Second edition. Freeman, San Francisco, CA.

Turner, N.E., J.C. Stephens, and W.W. Anderson. 1982. Homozygosity and patch structure in plant populations as a result of nearest-neighbor pollination. Proc. Natl. Acad. Sci. USA 79: 203_207.

Wright, S. 1931. Evolution in Mendelian populations. Genetics 16: 97_156.

Wright, S. 1938. Size of population and breeding structure in relation to evolution. Science 87: 430_431.

Wright, S. 1946. Isolation by distance under diverse systems of mating. Genetics 31: 39_59.


Botanical Bulletin of Academia Sinica, Vol. 38, 1997

Hosta capitata (¦Ê¦X¬ì) °ò¦]¬y¶Çªº¶¡±µ´ú©w

Ki Bae Park1 and Myong Gi Chung2

1Department of Horticulture, Ansung National University,

Ansung 456-749, The Republic of Korea

2Department of Biology, Gyeongsang National University,

Chinju 660-701, The Republic of Korea

¥»¬ã¨s±´°QHosta capitata´Óª«¨â­Ó¤ÑµM±Ú¸s¤§³Ì¤p¾F°ì¶ZÂ÷¡A¶Ç¯»ªÌ­¸¦æ¶ZÂ÷¡A¤ÎºØ¤l´²¼½¶ZÂ÷¡A¾Ú ¥H¶¡±µ¦ôºâ¦¹ª«ºØ¤§¾F°ì­±¿n¤Î±Ú¸s¤j¤p¡C¥¿¦p¤j¦h¼Æªº©øÂζǯ»´Óª«¡A¤W­z¤T¶µÅܼƪºÀW«×¤Î¤À§GÅã¥Ü ¦³©úÅ㤧°¾±×¤Î¶°¤¤¤À§G±¡§Î¡C¶Ç¯»ªÌ¡]ºµ¸Á¤Î»e¸Á¡^¤§¥­§¡­¸¦æ¶ZÂ÷¤ÎH. capitataºØ¤l´²¼½¶ZÂ÷¤j¬ù¤À§O ¬°1 m¤Î25 cm¡C¦¹¥~¡AÁöµM¦¹¤G±Ú¸s¾F°ì¤j¤p¤£¦P¡]¤j¬ù¤À§O¬° 15¤Î64­ÓÅé¡^¡A¾F°ì­±¿n¥ç²§¡] 5.68¨ì17.13 m2¡^¡A³o¨Çµ²ªGÅã¥Ü¨ä°ò¦]¬y¶Ç©úÅã¦a¨ü¨ìªÅ¶¡ªº­­¨î¡C¥»¬ã¨s»P¹L¥h¬ã¨sÅã¥Ü¥H¦P¥\»Ã¯À¬°¿ò¶Ç¼Ð»x±q ¨ÆH. capitata±Ú¸s¤º¤Î±Ú¸s¶¡ºë±Kªº©Î¤j³W¼Òªº¿ò¶Çµ²ºc±´°Q¡A±j¯PÅã¥Ü°ò¦]¬y¶Ç¨ü¨ì¬Û·íµ{«×¤§­­¨î¡A¦Ó ¨ÏÀH¾÷ªº¼vÅT§êºt¤F¨M©w¦¹¤@ª«ºØ¿ò¶Çµ²ºcªº­«­n¨¤¦â¡C

ÃöÁäµü¡G °ò¦]¬y¶Ç¡F°ò¦]º}ÅÜ¡FHosta capitata¡F¶Ç¯»ªÌ¡FºØ¤l´²¼½¡C