Bot. Bull. Acad. Sin. (1998) 39: 17_21

Yang et al. — Genetic polymorphism in Capsella bursa-pastoris

Genetic polymorphism of seven populations of Capsella bursa-pastoris based on RAPD markers

Yau-Wen Yang1,3, Warren H.J. Kuo2, and Teck Hiang Wong1

1Institute of Botany, Academia Sinica, Taipei, Taiwan 115, Republic of China

2Department of Agronomy, National Taiwan University, Taiwan 106, Republic of China

(Received June 16, 1997; Accepted October 22, 1997)

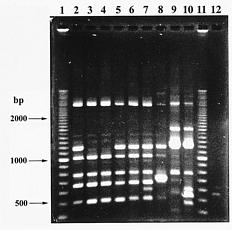
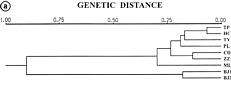
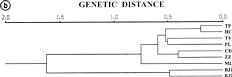
Abstract. Capsella bursa-pastoris is considered to be a potential vegetable crop. Together with two accessions of mustard (Brassica juncea) as outgroups, seven populations of C. bursa-postoris were used to study genetic polymorphism using random amplified polymorphic DNA (RAPD) markers. Using 12 primers, a total of 158 RAPD markers were selected among these populations. Among them, 91 are either specific for C. bursa-postris or present in both C. bursa-postoris and B. juncea. In Capsella populations, 40 RAPD markers are polymorphic, 5 markers are population specific, and 46 markers are monomorphic with variation of banding density. Each RAPD marker was treated as either having unweighted character or weighted character. Using UPGMA for cluster analysis, the polymorphic tree structures based on unweighted and weighted character have a similar phylogenetic relationship among these tested populations. With one exception, the phylogenetic relationship of Taiwan origin is correlated with the geographical distribution of these populations. These results may provide us information of genetic variation to be used in a varietal development program and to find specific markers linked to important traits.

Keywords: Capsella bursa-pastrois; Genetic polymorphism; RAPDs.

Introduction

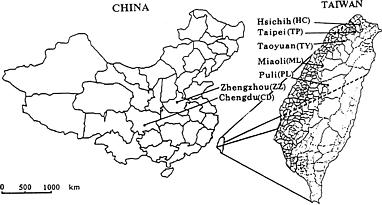
Capsella bursa-pastoris is a wild grass and the only species of the genus Capsella in Taiwan (Yang, 1996). With its pleasant, distinctive flavor, it has potential for cultivation as a vegetable crop (Kuo and Chen, 1995). Due to the small leaf size and early flowering of the existing Taiwan populations, high yields and economical production on a large scale are difficult. Two populations from the middle of China have been introduced into Taiwan. With their large leaves and late flowering habit these populations are good candidates for generating new varieties, or F1 hybrids, with Taiwan populations. Information on genetic variabilities and relationships among these different populations may aid in an ecotype identification and future varietal development program.

With the advent of molecular biology, random amplified polymorphic DNA (RAPD) markers generated by polymerase chain reaction (PCR) with single 10base oligonucleotide primers of arbitrary sequence have proved to be an easier, quicker way for detecting polymorphism at the DNA level compared with restriction fragment length polymorphism (RFLP) (Welsh and McClelland, 1990; Williams et al., 1990). However, the principal disadvantage of RAPDs is that they are usually dominant markers, and reproducibility of DNA banding patterns can be affected by different concentrations of reaction components and cycle conditions (dos Santos et al., 1994). In

Brassica and its related genera, RAPD markers have been used successfully for identification and phylogenetic relationship among and within species (Demeke et al., 1992; Kresovich et al., 1992; Hu and Quiros, 1991; Ren et al., 1995; Quiros et al., 1991; dos Santos et al., 1994; Thormann et al., 1994). F1 plants of B. juncea show a positive relationship between yield and genetic distance (Jain et al., 1994). Some RAPD markers can even be linked to special traits, like the fertility restorer gene for use against cytoplasmic male sterility in the F1 seed production of rapeseed (Delourme et al., 1994).

This study has two objectives. The first is to evaluate if there is genetic variation among collected populations using RAPD markers since no work has been done on these plants yet. The second is to see how different evaluation methods of RAPD banding patterns in genetic distance can affect the phylogenetic relationship among these populations. Usually, RAPD bands were treated as either "present" or "absent" without considering banding density. This study was done to see whether assigning scores to different band densities affects the analytical result. Here, we adopted two methods for estimating genetic distance among the tested populations. In the first, each DNA band was treated as a unit character, and each population was scored for the presence or absence of band, respectively. Genetic Similarity (GS) was analyzed using the equation (Jaccard, 1908): GS = (Nab)/(Na+Nb-Nab), where Nab is the number of shared fragments between populations a and b, Na is the number of scored fragments of population a, and Nb the number of scored fragments of population b.

3Corresponding author.


Botanical Bulletin of Academia Sinica, Vol. 39, 1998

Genetic distance (GD) was then calculated as GD = 1-GS. For the second method, a different scale was given to each unit character (or DNA marker) according to the banding density. Average taxonomic difference (Eij) was based on the equation: Eij = (Sk (1/n) ( Xki-Xkj)2)1/2 , where n is the number of characters used in comparisons, Xki or Xkj the score of population i or population j for character k. UPGMA was then used in the clustering analysis (Sneath and Sokal, 1973).

Materials and Methods

With two populations of cultivated mustard (Brassica juncea) as outgroups, seven populations of Capsella bursa-pastoris with five from different locations in Taiwan and two from middle parts of China were used in this study (see Figure 1): Hsichih (HC), Taipei (TP), Taoyuan (TY), Miaoli (ML), Puli (PL), Zhengzhou (ZZ), and Chengdu (CD). Leaves collected from a bulk of 4 plants of each population grown under controlled environment were used for DNA extraction according to Junghans and Metzlaff (1991) with the ratio of OD 260 to OD 280 between 1.7 to 2.0. Sixteen decamer oligonucleotides from Operon kits A, B and L (Operon Technologies Inc. Alameda, CA, USA) were used for amplification of extracted DNA. PCR reactions were performed in 25 µl vol. containing 10 mM Tris HCl, pH 8.3, 50 mM KCl, 0.1 mg/ml gelatin, 1.5 mM MgCl2, 0.1 mM dNTP, 0.2 µM primer, 25 ng DNA template, and 1 unit Taq polymerase using (Perkin-Elmer, Norwalk, CT, USA) DNA 480 Thermal Cycler. Each reaction was overlaid with one drop of mineral oil to prevent evaporation. DNAs were amplified for 40 cycles of 1 min at 94°C, 1 min at 37°C, 2 min at 72°C and one final

cycle of 5 min at 72°C (Williams et al., 1990). After reaction, 8 µl of sample was analyzed by electrophoresis in 1.8% agarose containing 0.5% TBE. One µl of 100 bp DNA ladder (Gen Sure Laboratories, Del Mar, CA, USA) containing 40 bands from 100 bp to 4,000 bp was also run in the gel electrophoresis. Based on the banding density calculated by `ImageQuant' software (Molecular Dynamics, Sunnyvale, CA, USA), the DNA quantity of markers, 500 bp, 900 bp, and 1 kb were estimated at 5 ng, 10 ng and 15 ng. A blank check without DNA template was also included. The gels were photographed under UV light using Polaroid 667 film. RAPD bands were then scored into three categories based on band density as compared with 100 bp DNA markers. A score of "3" was given to band densities higher than 15 ng, "2" was given to band densities between 15 and 10 ng, and "1" was given to band densities between 5 and 10 ng. Band quanties less than 5 ng were scored "0".

At least three repeats were conducted. In the unweighted method, a DNA band was considered present only if it appeared at least twice and had a total score of 3 and above in three repeats. Amplification products between 500 bp and 2,200 bp were scored on the basis of their presence or absence. Pair-wise comparisons of populations were employed to calculate similarity coefficient, GS (Jaccard, 1908). Genetic distance (GD) was calculated as GD = 1-GS. Average taxonomic distance (Sneath and Sokal, 1973) was also calculated based on the different scale in each RAPD marker in three repeats. The above data calculation and subsequent dendrogram construction using the unweighted pair-group method with arithmetical averages (UPGMA) was done using the NTSYS-pc program (Rohlf, 1989).

Figure 1. Geographical distribution of seven populations of Capsella bursa-pastoris.


Yang et al. — Genetic polymorphism in Capsella bursa-pastoris

Results and Discussion

In this study, each population was treated as an operation taxonomic unit (OTU). Sixty 10base random primers were used in the initial screening. Sixteen primers which showed polymorphic bands in all 7 populations were chosen. Two accessions of B. juncea used in this study as outgroups shared some RAPD markers with seven populations of C. bursa-pastoris. A DNA banding profile using primer OPB18 in 1.8% agarose gel was shown in Figure 2. In lanes 1 and 11 of Figure 2, the marker of 500 bp, 900 bp, and 1,000 bp were estimated at 5 ng, 10 ng and 15 ng in quantity as described in Materials and Methods. Out of a total of 158 RAPD markers, 91 were found either specific for C. bursa-postris or present in both C. bursa-postoris and B. juncea. In Capsella populations, 40 RAPD markers are polymorphic, 5 population specific, and 46 monomorphic with variations of banding density. The genetic similarity of the unweighted method based on Jaccard's coefficient (Jaccard, 1908) was calculated, and genetic distance was obtained (Table 1). In a weighted calculation, four different scales from 0 to 3 were given to DNA bands according to their densities. The average scale of three repeats was then taken for subsequent determination of average taxonomic difference (Table 2). The matrix correlation between Tables 1 and 2 was then measured based on normalized Mantel statistic Z (Mantel, 1967) using the NTSYS-pc program (Rohlf, 1989). A value of 0.996 indicated that no difference existed between

Figure 2. RAPD banding profiles of genomic DNA from different populations amplified using primer OPB18 in 1.8% agarose gel. 100 bp markers (lanes 1 and 11), TP (lane 2), CD (lane 3), ZZ (lane 4), TY (lane 5), PL (lane 6), HC (lane 7), ML (lane 8), BJ1 (lane 9), BJ2 (lane 10) and negative control (lane 12) amplified using primer OPB18 without adding DNA template. OPB18-1900 is shown in all five populations (TP, TY, PL, HC, ML) of Taiwan but not in two populations (CD, ZZ) of Mainland China.

Table 1. Genetic distance among different populations of Capsella bursa-pastoris and accessions of Brassica juncea based on unweighted method.

TP HC TY PL ML CD ZZ BJ1 BJ2

TP

HC 0.066

TY 0.173 0.165

PL 0.198 0.167 0.200

ML 0.259 0.231 0.305 0.288

CD 0.229 0.222 0.232 0.235 0.337

ZZ 0.232 0.225 0.277 0.215 0.361 0.132

BJ1 0.892 0.890 0.899 0.906 0.893 0.915 0.914

BJ2 0.897 0.895 0.896 0.902 0.898 0.911 0.910 0.177

Table 2. Genetic distance among different populations of Capsella bursa-pastoris and accesions of Brassica juncea based on weighted method.

TP HC TY PL ML CD ZZ BJ1 BJ2

TP

HC 0.583

TY 0.588 0.408

PL 0.490 0.539 0.577

ML 0.532 0.665 0.635 0.506

CD 0.201 0.607 0.582 0.532 0.553

ZZ 0.707 0.779 0.792 0.774 0.741 0.716

BJ1 1.596 1.629 1.602 1.589 1.630 1.607 1.629

BJ2 1.626 1.645 1.618 1.605 1.646 1.635 1.652 0.489


Botanical Bulletin of Academia Sinica, Vol. 39, 1998

these two sampling methods. Based on the unweighted method, two populations of B. juncea have a genetic distance of 0.177. Genetic distance among different populations of C. bursa-pastoris varies from 0.066 to 0.361 while seven populations of C. bursa-pastoris have an average genetic distance of 0.901 from two populations of B. juncea (Table 1).

The results of UPGMA clustering analysis based on data in Tables 1 and 2 are shown in Figure 3a and 3b. These two phylogenetic trees have similar topology. The tree of Figure 3a has a cophenetic correlation value of 0.998, and the tree of Figure 3b a cophenetic correlation value of 0.999. These results demonstrate that both these analyses fit well with the original distance matrix of Tables 1 and 2. In Figure 3a, TP and HC are clustered together first; then they are clustered with TY at another branch point before they are joined with PL. While in Figure 3b, TY and PL are clustered first before they are joined with composite OTU of TP and HC. Since the two populations TP and HC showed the lowest GD, they can be considered one group. TY appeared to be more closely related to this group than to PL (Tables 1 and 2). This mirrors the geographical distribution that TY is located more closely to TP than PL. So, it appears that the topology of Figure 3a is more closely related to the actual geographical distribution. A similar result was also observed in populations of rubber rabbitbrush (Gang and Weber, 1995).

Five populations from northern to middle parts of Taiwan produce 5_7 leaves prior to flowering whereas both CD and ZZ produce 48_80 leaves prior to flowering (Kuo and Chen, 1995). In addition, Taiwan populations have smaller leaf size. We have shown that population groupings are consistent with their geographical distribution, except with one ecotype, ML (Figure 3a and 3b). ML, which showed morphological similarity with 4 other populations from Taiwan, is the most distantly-related group in the seven populations (Tables 1 and 2). However, ML

did show its closer relation to the other 4 Taiwan populations with GD from 0.231 to 0.305 as compared with two populations from China with GD from 0.337 to 0.361 (Table 1). Based on the RAPD profiles, ML has obtained several unique RAPD markers while it also has lost some markers which are present in all other populations of C. bursa-pastoris. This indicates that strong differentiation of this ecotype might have occurred. If seven populations are divided into two groups according to their morphlogical characteristics, three RAPD markers can be found to distinguish these two groups. OPA3-1250 and OPL4-1900 were found to be present only in ZZ and CD of China, while marker OPB18-1180 was found in the five populations of Taiwan (Figure 2). Thus, these RAPD markers may be linked to important characters such as leaf size and date of flowering, which are important criteria used to distinguish these two groups of Capsella bursa-pastoris. Furthermore, the five populations (HC, TP, TY, ML, PL) of Taiwan showed greater genetic variation than the two populations (CD, ZZ) of China, although the geographical distance between ZZ and is CD at least several times greater than that of Taiwan (Figure 1).

In conclusion, RAPD markers show genetic variation among seven C. bursa-pastoris populations. And genetic distances among these OTUs based on weighted and unweighted methods show similar results. With one exception, the phylogenetic relationships among plants of Taiwan origin was clearly correlated with the geographical distribution. Furthermore, RAPD markers can be used in identification of important traits of this potential vegetable crop.

Acknowledgments. We thank Dr. H. H. Ho of State University of New York at New Paltz, and Dr. C. F. Shen of Institute of Botany, Academia Sinica, Taiwan for their valuable advice. This work was supported by a grant from Academia Sinica, Taiwan, R.O.C.

Literature Cited

Delourme, R., A. Bouchereau, N. Hubert, and M. Renard. 1994. Identification of RAPD markers linked to a fertility restorer gene for the Ogura radish cytoplasmic male sterility of rapeseed (Brassica napus L.). Theor. Appl. Gent. 88: 741_748.

Demeke, T., R.P. Adams, and R. Chibbar. 1992. Potential taxonomic use of random amplified polymorphic DNA (RAPD): A case study in Brassica. Theor. Appl. Genet. 84: 990_994.

Dos Santos, J.B., J. Nienhuis, P. Skroch, J. Tivang, and M.K. Slocum. 1994. Comparison of RAPD and RFLP genetic markers in determining genetic similarity among Brassica oleracea L. genotypes. Theor. Appl. Genet. 87: 909_915.

Gang, D.R. and D.J. Weber. 1995. Genetic variability and relationships among ten populations of rubber rabbitbrush (Chrysothamnus nauseosus spp. hololeucus) determined by RAPD analysis of bulked genomic DNA samples. Bot. Bull. Acad. Sin. 36: 1_8.

Hu, J. and C.F. Quiros. 1991. Identification of broccoli and cauliflower cultivars with RAPD markers. Plant Cell Rep. 10: 505_511.

Figure 3. a_b, Seven populations of Capsella bursa-pastoris and two populations of Brasssica juncea grouped by UPGMA cluster analysis based on unweighted character (a) and weighted character (b).


Yang et al. — Genetic polymorphism in Capsella bursa-pastoris

Jaccard, P. 1908. Novelles recgerches sur la distribution florale. Bull. Soc. Vaud. Sci. Nat. 44: 223_270.

Jain, A., S. Bhatia, S.S. Banga, S. Prakash, and M. Lakshmikumaran. 1994. Potential use of random amplified polymorphic DNA (RAPD) technique to study the genetic diversity in Indian mustard (Brassica juncea) and its relationship to heterosis. Theor. Appl. Genet. 88: 116_122.

Junghans, H. and M. Metzlaff. 1991. A simple and rapid method for the preparation of total plant DNA. Biotechniques 8: 176.

Kresovich, S., J.G.K. Williams, J.R. McFerson, E.J. Routman, and B.A. Schaal. 1992. Characterization of genetic identities and relationships of Brassica oleracea L. via a random amplified polymorphic DNA assay. Theor. Appl. Genet. 85: 190_196.

Kuo, W.H.J. and P.H. Chen. 1995. Temperature effects on the leaf appearance rates of three populations of Capsella bursa-pastoris. Mem. Coll. Agri. Natl. Taiwan Uni. 35: 339_347.

Mantel, N.A. 1967. The detection of disease clustering and a generalized regression approach. Cancer Res. 27: 209_220.

Quiros, C.F., J. Hu, P. This, A.M. Chevre, and M. Delseny. 1991. Development and chromosomal location of genome-specific markers by polymerase chain reaction in Brassica. Theor. Appl. Genet. 82: 627_632.

Ren, J., J.R. McFerson, R. Li, S. Kresovich, and W.F. Lamboy. 1995. Identities and relationships among Chinese vegetable Brassicas as determined by random amplified polymorphic DNA markers. J. Amer. Soc. Hort. Sci. 120: 548_555.

Rohlf, F.J. 1989. NTSYS-pc Numerical Taxonomy and Multivariate Analysis System, Version 1.50. Exeter Publ., New York, USA.

Sneath, P.H.A. and R.R. Sokal. 1973. Numerical Taxonomy. Freeman Publ., San Francisco, USA, 573 pp.

Thormann, C.E., M.E. Ferreira, L.E.A. Camargo, J.G. Tivang, and T.C. Osborn. 1994. Comparison of RFLP and RAPD markers to estimating genetic relationships within and among cruciferous species. Theor. Appl. Genet. 88: 973_980.

Welsh, J. and M. McClelland. 1990. Fingerprinting genomes using PCR with arbitrary primers. Nucleic Acids Res. 18: 7213_7218.

Williams, J.G.K., A.R. Kubelik, K.J. Livak, J.A. Rafalski, and S.V. Tingey. 1990. DNA polymorphisms amplified by arbitrary primers are useful as genetic markers. Nucleic Acids Res. 18: 6531_6535.

Yang, S.S. 1996. Cruciferae. In T.-C. Huang (ed.), Flora of Taiwan, 2nd edn. vol. 2. Edit. Comm. Flora of Taiwan. Taipei, Taiwan, pp. 745_769.