Bot. Bull. Acad. Sin. (1998) 39: 191_198

Lin and Shao — Temporal changes in intertidal seagrass beds

Temporal changes in the abundance and growth of intertidal Thalassia hemprichii seagrass beds in southern Taiwan

Hsing-Juh Lin1 and Kwang-Tsao Shao

Institute of Zoology, Academia Sinica, Taipei 115, Taiwan, Republic of China

(Received August 26, 1997; Accepted April 9, 1998)

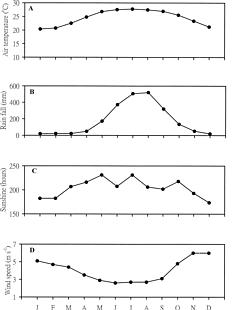
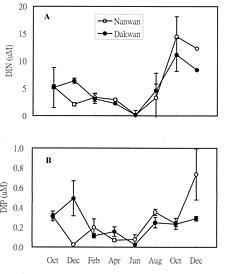
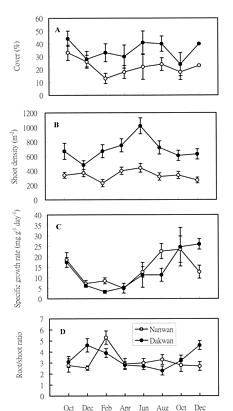
Abstract. A bimonthly study of temporal changes in abundance and growth of the tropical seagrass Thalassia hemprichii on intertidal reef flats was conducted in southern Taiwan from October 1995 to December 1996. Thalassia hemprichii showed a marked temporal pattern in percentage cover, shoot density, and specific growth rate. There were no significant differences in the variables of T. hemprichii between the study sites. The percentage cover showed a unimodal or bimodal pattern in which one peak occurred in June or August and the other occurred in October. The shoot density was highest in June and lowest between December and February. The specific growth rate peaked in October or December, but declined in February or April. However, the temporal patterns in root:shoot ratio of biomass were different. Higher root:shoot ratios were observed in December or February, and lower between April and August. The above-ground biomass was always smaller than the below-ground biomass. Canonical correlation analysis indicated that temperature, water-column nutrient concentration and rainfall were positively correlated, and daylight exposure time and wind speed negatively correlated, with the dynamics of T. hemprichii. Among these variables, wind speed and rainfall were most responsible for the observed temporal changes in southern Taiwan, which has a monsoonal climate and distinct wet and dry seasons.

Keywords: Canonical correlation analysis; Monsoon; Rainfall; Tropical seagrass.

Introduction

Seagrasses are one of the most conspicuous communities of the shallow waters of the world. They comprise only about 50 species worldwide (den Hartog, 1970), but this number is not indicative of their ecological and economic importance. Many investigations have demonstrated that seagrass beds are among the most productive areas of aquatic ecosystems (e.g. Zieman and Wetzel, 1980). They are widely acknowledged to be important in providing food resources (e.g. Klumpp et al., 1989), as well as nursery and feeding grounds, for invertebrates (e.g. Orth et al., 1996) and juvenile fishes (Bell and Pollard, 1989). Furthermore, they may help in stabilizing sediments and preventing coastal erosion and siltation of coral reefs (Fonseca and Fisher, 1986). Nevertheless, a worldwide decline in the abundance of seagrasses due to man-made perturbations has been increasingly reported (e.g. Cambridge and McComb, 1984; Orth and Moore, 1983).

Seagrass communities have long been recognized to be dynamic on a variety of temporal scales (den Hartog, 1970). Wherever man-made perturbations occur, it is necessary to know the extent of the changes that these perturbations may cause (e.g. Lin et al., 1996). For this reason, determining a baseline or control in order to track the ex

tent of man-made changes is essential, and temporal fluctuations in seagrass communities must be documented before any significant perturbation occurs. At present, the available seagrass dynamics data are almost exclusively from temperate regions or the tropical Caribbean (e.g. Zieman, 1975). Only recently have the dynamics of tropical seagrasses along the western Pacific begun to be studied (Brouns, 1985; Erftemeijer and Herman, 1994; Lanyon and Marsh, 1995). These studies, however, have been conducted exclusively in the tropical southern hemisphere between the latitudes of 5° and 15°S. In addition, most of them have been conducted in mixed seagrass beds. Since interspecific interactions are believed to mask seasonal dynamics of seagrasses to some degree (Brouns, 1985; Lanyon and Marsh, 1995), separating abiotic from biotic effects in tropical mixed seagrass beds is difficult (Poiner et al., 1989).

Taiwan lies near the northern latitudinal limit for the geographical distribution of Thalassia hemprichii (Ehrenb.) Aschers., which is one of the two most widely distributed tropical seagrasses in the western Pacific (Mukai, 1993). Prior seagrass studies in Taiwan have all been limited to structural aspects (Doebler, 1984; Huang, 1989; Huang, 1995; Mok et al., 1993) and provide little information on dynamics. The purposes of this study are first, to determine temporal changes in the abundance and growth of T. hemprichii in southern Taiwan, and secondly, to examine which environmental factors are most responsible for the observed temporal changes of T. hemprichii.

1Corresponding author. Tel: +886-2-27899545; Fax: +886-2-27883463; E-mail: hjlin@gate.sinica.edu.tw


Botanical Bulletin of Academia Sinica, Vol. 39, 1998

Materials and Methods

Study Sites

The study area was on the intertidal reef flats of the Hengchun Peninsula, located at the southern tip of Taiwan. Raised reefs are scattered all over the peninsula, forming several levels of fringing coastal terraces. The first study site was the seagrass bed along the coast of Nanwan (Figure 1) (21°57'30"N; 120°5'30"E), off the eastern coast of Nanwan Bay. This bed covered about 0.4 ha and is a Thalassia-Halodule community, with T. hemprichii as the dominant seagrass species. Halodule uninervis (Forssk.) Aschers. was observed in <10% of coverage and often colonized the spots deeper than 30 cm. The small patches of H. uninervis were unlikely to mask the temporal variations of T. hemprichii. Based on a comparison of observed water levels overlying the seagrass beds with predicted water levels, the mean substrate level was about 1.0 m above chart datum. The second site was the homogeneous bed of T. hemprichii along the coastline of Dakwan (Figure 1) (21°57'12"N; 120°44'30"E), off the western coast of Nanwan Bay. This seagrass bed covered about 0.3 ha and the estimated mean substrate level was about 1.1 m above chart datum. Both seagrass beds were partly protected from wave action by a 5_10 m wide zone of elevated fringing reef, and their substrata were covered by at least 10 cm of coral sand and debris. A few small coral colonies were scattered in the seagrass beds. The water in these beds underwent a complete exchange with the ocean water at high tide. At low tide, low water levels may expose some seagrasses to the air and/or direct sunlight.

Data Collection

We measured both temporal variations in the abundance and growth of T. hemprichii and relevant environmental variables bimonthly between October 1994 and Decem

ber 1995 at Nanwan and Dakwan. Sampling was conducted at low tide to avoid problems of water turbulence and turbidity. The variables for T. hemprichii which we monitored included percentage cover, shoot density, biomass, root:shoot ratio, leaf growth rate and leaf production. In order to collect data which were representative of each seagrass bed, four and three permanent and replicate transects were surveyed at Nanwan and Dakwan, respectively. These transects were parallel to each other, perpendicular to the shore and separated from each other by a reasonable distance (31_72 m) (English et al., 1997). The length of the transect depended upon the width of the seagrass bed and extended to the outer limits of the beds where T. hemprichii disappeared. The positions of these transects were referred to marker posts left in place.

Coverage of T. hemprichii at the study sites was estimated at 5 m intervals along the transect using the methods of English et al. (1997). A quadrat (50 × 50 cm2) divided into 25 squares (10 × 10 cm2) was placed on the substratum, and the coverage of T. hemprichii in each of the 25 squares was scored using the classes developed by Saito and Atobe (1970). The percentage cover of T. hemprichii in each quadrat was estimated according to the weighted average of the scores of 25 squares following the methods of Saito and Atobe (1970). The total number of quadrats was 18 and 12 at Nanwan and Dakwan, respectively. The coefficient of variation in percentage cover was about 0.50.

Shoot density of T. hemprichii was estimated simultaneously by 5 counts within 5 permanent squares (10 × 10 cm2) in each quadrat when scoring the percentage cover along each transect. As a result, the total number of shoot counts was 90 and 60 at Nanwan and Dakwan, respectively. The coefficient of variation in shoot density was about 0.60. Four and three samples of biomass were also collected for each sampling date at Nanwan and Dakwan, respectively. Each biomass sample consisting of 10 shoots of T. hemprichii, measuring 3.2_4.2 cm was collected randomly, except on the transect line, using a spade. The range of shoot height approximated the size of T. hemprichii at the study sites. In the laboratory, these biomass samples were rinsed with fresh water and divided into an above-ground part (leaf blades and sheaths) and a below-ground part (rhizomes and roots). Epiphytes were gently scraped off the leaf with the edge of a glass slide. The biomasses of 10 shoots from each sample were pooled to reduce sub-sampling variability. Seagrass samples were then dried at 60°C to constant weight. The root (below-ground part) to shoot (above-ground part) ratio was used to assess the relative abundance of the below-ground part over time (Fonseca et al., 1990).

Leaf growth rate was studied in four and three random plots (10 × 10 cm2 each) at Nanwan and Dakwan using the leaf marking method described by Kirkman and Reid (1979). This method is considered the most suitable for large-scale monitoring studies of seagrass primary production in tropical environments (Erftemeijer et al., 1993). About 10 plants were arbitrarily selected and marked in

Figure 1. Locations of the study sites in southern Taiwan.


Lin and Shao — Temporal changes in intertidal seagrass beds

each plot. A small hole was punched through all of the leaves at the base of a shoot to provide a reference level. Eight to thirteen days after initial marking, the shoot was cut at the base and the new growth increments of the leaves were cut off and dried at 60°C to constant weight. The leaf growth rate could then be expressed as a specific growth rate (g g-1 day-1) (Hillman et al., 1989). Using these increments, production could be expressed as leaf production per unit area of ground and unit time (g m-2 day-1).

Environmental variables including water temperature, salinity, turbidity, dissolved inorganic nitrogen (DIN) and phosphorus (DIP) in the water-column were measured at each sampling trip. Four and three measurements were made at Nanwan and Dakwan for each trip. The temperature and salinity of the water overlying the seagrass beds were measured at preceding high tide relative to field sampling using a Perstorp Water Analyzer 51600. Turbidity, expressed as the water-column extinction coefficient for photosynthetically active radiation (PAR), was determined by light measurements using a Li-Cor Li-189 quantum meter. Water samples, collected for nutrient analysis, were filtered in the field through 0.45 µm MFS cellulose nitrate membrane filters, and transported back to the laboratory on ice. At the laboratory, these samples were analyzed for phosphate (Murphy and Riley, 1962), ammonium (Fiore and O'Brien, 1962) and nitrate plus nitrite (based on Bendschneider and Robinson, 1952). Data on rainfall, sunshine, wind speed, and tidal height were derived from the local weather station (Climatological Data Annual Report, Central Weather Bureau) and the Tide Tables (Chinese Naval Hydrographic and Oceanographic Office).

Data Analysis

Since the data for seagrass cover and shoot density were collected by sequential monitoring in the same quadrat along the transect, repeated measures two-way ANOVA was employed to determine whether the effects of time and site were significant. A two-way ANOVA mixed model was employed for biomass, specific growth rate, and leaf production, in which site was the fixed factor and time the random factor. Before the analyses, the data for seagrass cover were arcsine transformed; the data for density, biomass, growth rate, and production were square root transformed, according to the rule recommended by Fry (1993), so that the two critical assumptions of the ANOVA would be valid.

The relationship between the dynamics of seagrass variables and fluctuations in environmental factors was examined using canonical correlation analysis. Canonical correlation analysis has greatly facilitated the study for correlations between environmental and biological variables (Jongman et al., 1995). By looking at the signs and relative magnitudes of the standardized canonical coefficients and canonical correlations, the relative importance of each environmental variable for predicting the development of T. hemprichii along the coast of southern Taiwan may be inferred. In order to avoid the multicollinearity

problem (Jongman et al., 1995), biomass, production and sunshine were not included in the analysis because of their strong correlations with shoot density, growth rate and water temperature, respectively.

Results

Climate

The Hengchun Peninsula is dominated by a tropical climate, with distinct dry and wet seasons. Maximum air temperature (about 28°C) often occurs in July, and the minimum (about 20°C) occurs in January (Figure 2A). During the dry season of November-April, when northeast winds prevail, mean monthly rainfall normally does not exceed 60 mm. From May to October, average monthly rainfall frequently exceeds 320 mm, when southwest winds bring considerable quantities of rain (Figure 2B). Sunshine decreased during November-February (170_190 h per month) compared with the rest of the year (200_230 h per month) (Figure 2C). The northeastern monsoonal winds, called downhill winds, are extremely forceful from October to April, so the wind speed is greater during this period (3.5_6.1 m s-1) than the rest of the year (2.6_3.1 m s-1). These winds may have a large effect on water movement and

Figure 2. Mean monthly climatic data for southern Taiwan for the period of 1900_1970. A: Mean air temperature (°C); B: Mean rainfall (mm); C: Mean sunshine (h); D: Mean non-directional wind speed (m s-1).


Botanical Bulletin of Academia Sinica, Vol. 39, 1998

sediment redistribution in the shallow seagrass beds. Occasionally, typhoons bring strong winds and heavy rainfall during the wet season.

Tides

The coast of the Hengchun Peninsula has a mixed and predominantly semi-diurnal tidal type (Figure 3) (Chinese Naval Hydrographic and Oceanographic Office). The water level at low tide varied in every tidal cycle and the exposure times of the seagrass beds changed accordingly. Total exposure time of the seagrass beds during the period of 20 days before the marked shoots were cut for the estimation of growth rate for each sampling date was temporally dynamic (Figure 4). During this period, total daylight exposure time was lower in April 1996 (4.5 days at Nanwan; 5.5 days at Dakwan) and higher in June 1996 (7.0 days at Nanwan; 7.8 days at Dakwan). Total daylight exposure time at Dakwan was always higher than at Nanwan, due to the higher substrate level at Dakwan.

Other Environmental Variables

Water temperature is highly correlated with air temperature and the amount of sunshine. Water temperature overlying the seagrass beds at Nanwan and Dakwan ranged from 20.5°C in April to 33.9°C in August. Salinity at the two study sites was comparable and varied within a small range of 32.6_34.7 (p.s.u.). The average light extinction coefficient (k) remained low (0.59_1.26 m-1) from August to December. Light extinction coefficients increased (1.63_2.44 m-1) at both sites during winter when the strong "downhill wind" prevailed.

Considerable variations in water-column nutrient concentrations were observed at the study sites. The patterns of temporal changes in DIN (NO2+NO3+NH4) and DIP (PO4) were similar. Generally, lower values occurred in summer, and higher values occurred in fall (Figure 5). The monthly mean DIN and DIP concentrations ranged from 0.14 and 0.03 µM in summer to 19 and 1.4 µM in fall.

Figure 4. Predicted frequency (days) of tidal exposure at low tide during daylight (white bars) and at night (black bars) during the period of 20 days before the marked shoots were cut for analysis for each sampling date at Nanwan and Dakwan.

Figure 5. Temporal variations (mean ± SE) in the concentrations of dissolved inorganic nutrients in the water overlying the seagrass beds at Nanwan (white circles, n=4) and Dakwan (black circles, n=3). A: dissolved inorganic nitrogen (DIN); B: dissolved inorganic phosphorus (DIP).

Figure 3. Predicted tidal oscillation curve in Nanwan Bay during December 1995.


Lin and Shao — Temporal changes in intertidal seagrass beds

Dynamics of Seagrass Beds

In southern Taiwan, variations in percentage cover of T. hemprichii over time were highly significant (repeated measures two-way ANOVA: F=6.3; d.f.=7, 35; P=0.005), with a unimodal or bimodal pattern in which one peak occurred in June or August and the other occurred in October (Figure 6A). The percentage cover at Dakwan was often greater than at Nanwan, but this spatial difference was not significant (F=5.0; d.f.=1, 5; P=0.07). The interaction in percentage cover between time and site was not significant (F=2.9; d.f.=7, 35; P=0.06). Mean percentage cover ranged from about 10% to 30% at Nanwan and from 25% to 40% at Dakwan.

Changes in shoot density of T. hemprichii over time were significant (repeated measures two-way ANOVA:

F=3.1; d.f.=7, 35; P=0.05). Mean shoot densities were greatest in June and lowest between December and February (Figure 6B). Overall, the shoot density at Dakwan was greater than at Nanwan, but this difference was not statistically significant due to the highly temporal variations at Dakwan (F=3.9; d.f.=1, 5; P=0.10). The interaction between time and site was insignificant (F=1.4; d.f.=7, 35; P=0.25). The values of mean shoot density at Dakwan ranged from a minimum of about 500 shoots m-2 in December to a maximum of 1020 shoots m-2 in June. At Nanwan, the temporal variation in shoot density was small, ranging from about 200 shoots m-2 to 400 shoots m-2.

Variations in the specific growth rate over time were highly significant (Two-way ANOVA: F=10.3; d.f.=7, 38; P=0.0001). Greater values of growth rate were observed in October or December and lower values in February or April (Figure 6C). The growth rates were not significantly different between the two sites (F=0.04; d.f.=1, 38; P=0.84). Mean growth rates ranged from 3.3 mg g-1 day-1 in February to about 25 mg g-1 day-1 in October or December. The temporal patterns of leaf production were similar to those of the growth rate at both sites.

The temporal patterns of biomass per unit area also followed those of shoot density at both sites (Figure 6B), since there was no large difference in leaf size between the two sites. However, the temporal patterns in root:shoot ratio of biomass were different from those of shoot density and biomass. At both sites, higher root:shoot ratios were observed in December or February, with mean values of 3.9_5.3, which subsequently dropped to 2.3_3.3 between April and August (Figure 6D).

Canonical Correlation Analysis

The bimonthly data from Nanwan and Dakwan were combined for canonical correlation analysis. The canonical correlation analysis revealed a significant correlation between the dynamics of T. hemprichii and environmental variables. Only the first ordination axis was significant (adjusted canonical correlation: 0.93; P = 0.04), but it can explain about 68% of the total correlations, indicating that the observed dynamics of T. hemprichii could be largely explained by the first ordination axis alone. The canonical correlations (Table 1) indicated that temperature, DIN and rainfall correlated positively, and daylight exposure time and wind speed negatively, with the leaf growth of T. hemprichii. Salinity showed little correlation with the dynamics of T. hemprichii. Among these environmental factors, the higher canonical coefficients of wind speed and rainfall indicated that they contributed most to the temporal variations in seagrass dynamics.

Discussion

The percentage cover of T. hemprichii in this study was within the range observed for tropical seagrass beds in northeastern Australia (Lanyon and Marsh, 1995). The shoot density and biomass levels in southern Taiwan were only about a third of those reported by Erftemeijer and

Figure 6. Temporal changes (mean ± SE) in the variables of Thalassia hemprichii at Nanwan and Dakwan. A: percentage cover (%) (n=18 at Nanwan, n=12 at Dakwan); B: shoot density (m-2) (n=90 at Nanwan, n=60 at Dakwan); C: specific growth rate (mg g-1 day-1) (n=4 at Nanwan, n=3 at Dakwan); D: root/shoot ratio of biomass (n=4 at Nanwan, n=3 at Dakwan).


Botanical Bulletin of Academia Sinica, Vol. 39, 1998

Table 1. Canonical coefficients and canonical correlations for the first ordination axis derived from a canonical correlation analysis of monthly means of biological and environmental variables monitored at Nanwan and Dakwan.

1st ordination axis Canonical coefficients Canonical correlations

Biological variables

Plant cover -0.434 -0.262

Shoot density -0.095 -0.350

Root/shoot ratio -0.523 -0.271

Specific growth rate 0.923 0.721

Environmental variables

Temperature 1.235 0.521

Salinity 0.675 -0.075

Water-column DIN -0.729 0.566

Water-column N:P ratio -0.018 0.265

Daylight exposure time -0.739 -0.221

Rainfall 1.937 0.580

Wind speed 2.244 -0.206

branching in June, with the following increase resulting from a concomitant increase in leaf length or leaf number per shoot in October.

Environmental variables may vary in relative importance depending upon where the seagrass beds being studied are located. In temperate regions, seagrass abundance and production have been primarily correlated with temperature and light (Hillman et al., 1989). In tropical regions, the fluctuations of these two factors are usually small. In Indonesia, Erftemeijer and Herman (1994) have suggested that the seasonal cycle of tropical seagrasses is largely determined by tidal exposure and water motion. On the other hand, Lanyon and Marsh (1995) indicated that the most correlative factors are rainfall, temperature and daylight hours in northern Australia.

The environmental variables that correlated most strongly with temporal variations in seagrass dynamics in this study were different from those in other tropical regions. The contribution of tidal exposure in southern Taiwan did not appear to be so important as in tropical Indonesia (Erftemeijer and Herman, 1994). The most likely explanation is the difference in frequency of exposure to sunshine and air. This is because the mean substrate levels of the seagrass beds in southern Taiwan were about 1.0_1.1 m above chart datum, compared to the 0.19_0.37 m in tropical Indonesia. As a result, the seagrass beds in southern Taiwan were regularly exposed due to the two low tides per day. However, the seagrass beds in tropical Indonesia were successively exposed to sunshine for half year when low waters of spring tides occurred during the daylight period from July to next February. From February to July the seagrass beds were exposed during the night when low waters of spring tides occurred during the hours of darkness. The resultant monthly variation in daylight exposure time was relatively great (15 days), compared to the 2.5 days in southern Taiwan.

The importance of wind speed and rainfall in determining the temporal dynamics of intertidal seagrass beds in southern Taiwan explains the major difference between their dynamics in southern Taiwan and other tropical regions. For seagrasses growing in a shallow and regularly exposed intertidal habitat, strong wind speed may result in rapid water loss from leaves at low tide, and turbid water and strong water motion at high tide. On the other hand, rainfall may minimize the desiccation and help to prevent "burning" of seagrass leaves at low tide. In this study, the above-ground biomass of T. hemprichii was always smaller than the below-ground biomass (Figure 5D). This smaller above-ground biomass may be a response evolved to minimize exposure and desiccation at low tide and to increase stability when exposed to waves at high tide. The extremely high root:shoot ratios in December or February may have resulted from a synergistic effect created by low rainfall and strong waves driven by the northeastern monsoonal winds. The more pronounced temporal variations in cover and shoot density at Dakwan may also thus be attributed to the susceptibility of its higher substrate level to wind and rainfall, despite the statistical insignificance of the spatial difference.

Herman (1994) in Indonesia. However, the biomass levels agreed with those reported for T. hemprichii in Australia (McComb et al., 1981; Moriarty et al., 1990) and Papua New Guinea (Brouns, 1987). Our measurements of specific growth rate and leaf production were also comparable with those reported for other tropical regions (Brouns, 1987; Erftemeijer and Herman, 1994; Moriarty et al., 1990).

In contrast to the earlier results that have not observed obvious seasonality in subtropical regions (Walker and McComb, 1988) and Papua New Guinea (Brouns, 1987), our results have demonstrated that T. hemprichii, growing near subtropical regions, shows a marked temporal change in abundance and growth. These findings are consistent with the seasonality of seagrasses from the tropical southern hemisphere (Erftemeijer and Herman, 1994; Lanyon and Marsh, 1995) and the Caribbean (Zieman, 1975). As Lanyon and Marsh (1995) point out, in some studies of tropical seagrasses, seasonality may have been masked by spatial variation due to utilization of random sampling rather than permanent transect or quadrat method.

The temporal variations in T. hemprichii observed in southern Taiwan were not so marked as those in seagrasses in most temperate regions. For example, Harlin et al. (1988) reported a seasonal fluctuation in the biomass of Zostera marina in a temperate coastal lagoon at Rhode Island of as much as tenfold, compared to the roughly twofold fluctuation in this study. Iizumi (1996) found that the leaf production rate of Zostera marina in an inlet in northern Japan increased up to tenfold in summer, which is also greater than our sixfold increase.

The percentage cover of T. hemprichii showed two peaks of which one occurred in June or August and the other in October. In this study, shoot density peaked in June and declined later, while the maximum growth rate followed in October. Qualitative observations did not suggest any large differences in grazer density between the months. It may be postulated that the initial increase in percentage cover was largely realized by new shoot


Lin and Shao — Temporal changes in intertidal seagrass beds

Rainfall may also bring considerable river and groundwater inputs of dissolved and particulate nutrients to the seagrass beds in the wet season. However, the canonical correlation analysis did not reveal any major role played by water-column nutrients in determining the dynamics of T. hemprichii in southern Taiwan. This suggests that the major nutrient sources of T. hemprichii were not from water column. We have found that the sediment nutrient concentrations in the seagrass beds were about tenfold those of the water-column nutrient concentrations (Lin, unpublished data). Although the seasonal patterns of sediment nutrient concentrations were difficult to determine due to limited data, they increased by up to fourfold in the wet season. The reason for the lower water-column nutrient concentrations observed in the wet season may be due to their use by macroalgae and phytoplankton in the water column. This explanation is supported by the frequent occurrence of macroalgal blooms during the wet season at each of the study sites (personal observation).

Acknowledgments. This research was supported financially by a grant from the National Museum of Marine Biology/Aquarium (NMMBA-85-1-3). We would like to thank Y.-H. Wu and C.-H. Tong who assisted in the field, and Y.-M. Lin for technical assistance in analyzing the nutrient samples. Two anonymous referees are acknowledged for their help in improving the manuscript.

Literature Cited

Bell, J.D. and D.A. Pollard. 1989. Ecology of fish assemblages and fisheries associated with seagrasses. In A.W.D. Larkum, A.J. McComb and S.A. Shepherd (eds.), Biology of Seagrasses. A Treatise on the Biology of Seagrasses with Special Reference to the Australian Region. Aquatic Plant Studies 2, Elsevier, Amsterdam, pp. 565_609.

Bendschneider, K. and R.J. Robinson. 1952. A new spectrophotometric determination of nitrate in seawater. J. Mar. Res. 11: 87_96.

Brouns, J.J.W.M. 1985. A comparison of the annual production and biomass in three monospecific stands of the seagrass Thalassia hemprichii (Ehrenb.) Aschers. Aquat. Bot. 23: 149_175.

Brouns, J.J.W.M. 1987. Quantitative and dynamic aspects of a mixed seagrass meadow in Papua New Guinea. Aquat. Bot. 29: 33_47.

Cambridge, M.L. and A.J. McComb. 1984. The loss of seagrass from Cockburn Sound, Western Australia. I. The time course and magnitude of seagrass decline in relation to industrial development. Aquat. Bot. 20: 229_243.

Den Hartog, C. 1970. The Seagrasses of the World. North-Holland, Amsterdam.

Doebler, P.K. 1984. Seagrass of Taiwan as a Potential Protein Source. Masters Thesis, National Taiwan University.

English, S., C. Wilkinson, and V. Baker (eds.). 1997. Survey Manual For Tropical Marine Resources. Australian Institute of Marine Science, Townsville, 390 pp.

Erftemeijer, P.L.A. and P.M.J. Herman. 1994. Seasonal changes in environmental variables, biomass, production and nutrient contents in two contrasting tropical intertidal seagrass

beds in South Sulawesi, Indonesia. Oecologia 99: 45_59.

Erftemeijer, P.L.A., R. Osinga, and A.E. Mars. 1993. Primary production of seagrass beds in South Sulawesi (Indonesia): a comparison of habitats, methods and species. Aquat. Bot. 46: 67_90.

Fiore, J. and J.E. O'Brien. 1962. Ammonium determination by automatic analysis. Wastes Eng. 33: 352.

Fonseca, M.S. and J.S. Fisher. 1986. A comparison of canopy friction and sediment movement between four species of seagrass with reference to their ecology and restoration. Mar. Ecol. Prog. Ser. 29: 15_22.

Fonseca, M.S., G.W. Thayer, and W.J. Kenworthy. 1990. Root/shoot ratios. In R.C. Phillips and C.P. McRoy (eds.), Seagrass Research Methods. UNESCO, pp. 65_67.

Fry, J.C. 1993. One-way analysis of variance. In J.C. Fry (ed.), Biological Data Analysis: a Practical Approach. Oxford University Press, New York, pp. 1_40.

Harlin, M.M., G.B. Thursby, and B. Thorne-Miller. 1988. Submerged macrophytes in coastal lagoons. In R.G. Sheath and M.M. Harlin (eds.), Freshwater and Marine Plants of Rhode Island. Kendall/Hunt Publishing Company, Dubuque, pp. 119_126.

Hillman, K., D.I. Walker, A.W.D. Larkum, and A.J. McComb. 1989. Productivity and nutrient limitation. In A.W.D. Larkum, A.J. McComb, and S.A. Shepherd (eds.), Biology of Seagrasses. A Treatise on the Biology of Seagrasses with Special Reference to the Australian Region. Aquatic Plant Studies 2, Elsevier, Amsterdam, pp. 635_685.

Huang, T.M. 1995. Genetic variation within and between populations of Thalassia hemprichii (Ehrenb.) Aschers. in Taiwan. Masters thesis, National Sun Yat-Sen University, Taiwan.

Huang, Y.C. 1989. The study of the growth and adaptation of Thalassia hemprichii (Ehrenb.) Aschers. of Nanwan, Southern Taiwan. Masters Thesis, National Sun Yat-Sen University, Taiwan.

Iizumi, H. 1996. Temporal and spatial variability of leaf production of Zostera marina L. at Otsuchi, northern Japan. In J. Kuo, R.C. Phillips, D.I. Walker, and H. Kirkman (eds.), Seagrass Biology. Proceedings of an International Workshop. Rottnest Island, Western Australia, pp. 143_148.

Jongman, R.H.G., C.J.F. ter Braak, and O.F.R. van Tongeren. 1995. Data Analysis in Community and Landscape Ecology. Cambridge University Press, Cambridge.

Kirkman, H. and D.D. Reid. 1979. A study of the role of the seagrass Posidonia australis in the carbon budget of an estuary. Aquat. Bot. 7: 173_183.

Klumpp, D.W., R.K. Howard, and D.A. Pollard. 1989. Trophodynamics and nutritional ecology of seagrass communities. In A.W.D. Larkum, A.J. McComb, and S.A. Shepherd (eds.), Biology of Seagrasses. A Treatise on the Biology of Seagrasses with Special Reference to the Australian Region. Aquatic Plant Studies 2, Elsevier, Amsterdam, pp. 394_457.

Lanyon, J.M. and H. Marsh. 1995. Temporal changes in the abundance of some tropical intertidal seagrasses in North Queensland. Aquat. Bot. 49: 217_237.

Larkum, A.W.D. and C. den Hartog. 1989. Evolution and biogeography of seagrasses. In A.W.D. Larkum, A.J. McComb, and S.A. Shepherd (eds.), Biology of Seagrasses. A Treatise on the Biology of Seagrasses with Special Reference


Botanical Bulletin of Academia Sinica, Vol. 39, 1998

to the Australian Region. Aquatic Plant Studies 2, Elsevier, Amsterdam, pp. 112_56.

Lin, H.J., S.W. Nixon, D.I. Taylor, S.L. Granger, and B.A. Buckley. 1996. Responses of epiphytes on eelgrass, Zostera marina L., to separate and combined nitrogen and phosphorus enrichment. Aquat. Bot. 52: 243_258.

McComb, A.J., M.L. Cambridge, H. Kirkman, and J. Kou. 1981. Biology of Australian seagrasses. In J.S. Pate and A.J. McComb (eds.), The Biology of Australian Plants. The University of Western Australia Press, Perth, pp. 258_293.

Mok, H.K., J.D. Lee, and C.P. Lee. 1993. A new record of seagrass, Halophila decipiens Ostenfeld (Hydrocharitaceae), in Taiwan. Bot. Bull. Acad. Sin. 34(4): 353_356.

Moriarty, D.J.W., D.G. Roberts, and P.C. Pollard. 1990. Primary and bacterial productivity of tropical seagrass communities in the Gulf of Carpentaria, Australia. Mar. Ecol. Prog. Ser. 61: 145_157.

Mukai, H. 1993. Biogeography of the tropical seagrasses in the western Pacific. Aust. J. Mar. Freshwater Res. 44: 1_17.

Murphy, J. and J. Riley. 1962. A modified single solution for the determination of phosphate in natural waters. Anal. Chem. Acta. 27: 31.

Orth, R.J. and K.A. Moore. 1983. Chesapeake Bay: An unprecedented decline in submerged aquatic vegetation. Science 222: 51_53.

Orth, R.J., J. van Montfrans, R.N. Lipcius, and K.S. Metcalf.

1996. Utilization of seagrass habitat by the blue crab, Callinectes sapidus Rathbun, in Chesapeake Bay: A review. In J. Kuo, R.C. Phillips, D.I. Walker, and H. Kirkman (eds.), Seagrass Biology. Proceedings of an International Workshop. Rottnest Island, Western Australia, pp. 213_224.

Poiner, I.R., D.I. Walker, and R.G. Coles. 1989. Regional studies - seagrasses of tropical Australia. In A.W.D. Larkum, A.J. McComb, and S.A. Shepherd (eds.), Biology of Seagrasses. A Treatise on the Biology of Seagrasses with Special Reference to the Australian Region. Aquatic Plant Studies 2, Elsevier, Amsterdam, pp. 279_303.

Saito, Y. and S. Atobe. 1970. Phytosociological study of intertidal marine algae. I. Usujiri Benten-Jima, Hokkaido. Bull. Fac. Fish. Hokkaido Univ. 21: 37_69.

Walker, D.I. and A.J. McComb. 1988. Seasonal variation in the production, biomass and nutrient status of Amphibolis antarctica (Labill.) Sonder ex Aschers. and Posidonia australis Hook.f. in Shark Bay, Western Australia. Aquat. Bot. 31: 259_275.

Zieman, J.C. 1975. Seasonal variation of turtle grass, Thalassia testudinum Konig, with reference to temperature and salinity effects. Aquat. Bot. 1: 107_123.

Zieman, J.C. and R.G. Wetzel. 1980. Productivity in seagrasses: methods and rates. In R.C. Phillips and C.P. McRoy (eds.), Handbook of Seagrass Biology. Garland STPM, New York, pp. 87_116.