Bot. Bull. Acad. Sin. (1999) 40: 65_71

Wen and Hsiao Genetic differentiation of Lilium longiflorum var. scabrum

Genetic differentiation of Lilium longiflorum Thunb.

var. scabrum Masam. (Liliaceae) in Taiwan using

Random Amplified Polymorphic DNA and

morphological characters

Chia-Szu Wen and Ju-Ying Hsiao1

Department of Botany, National Chung Hsing University, Taichung, Taiwan, Republic of China

(Received September 26, 1997; Accepted July 24, 1998)

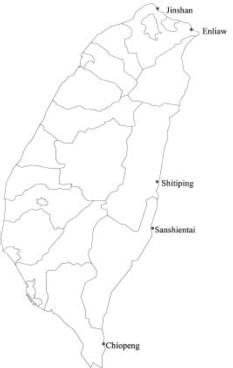
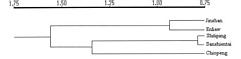
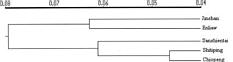
Abstract. Lilium longiflorum Thunb. var. scabrum Masam. is distributed along the northern, eastern, and southern coasts of Taiwan and in some of the outlying islets. It exhibits large amounts of morphological variation among populations in different habitats. Five populations were examined in the present study. In addition to a morphological study, RAPD were used to determine whether the observed morphological variation has a genetic basis and to investigate the variation pattern from different latitudes and different geographical locations. The results of the morphological analyses gave some indication of clinal trends; however, no conclusions can be made because of the limited number of populations studied. In the RAPD study, 140 primers were screened, 9 of which were selected to analyze in all of the samples. The results revealed that, with the exception of the islet Sansientai population, the closer the geographical locations of populations, the closer were their genetic relationships. The exception of islet Sansientai may result from the interruption of gene flow and the effect of genetic drift due to the small size of this islet's population. AMOVA analysis on RAPD data revealed that, of the total variation in the species, 14.08% was attributable to population differences and 85.92% to individual differences within populations when all populations were treated as belonging to a single region. The among population variance component was shown to be highly significant (P<0.001). When two northern populations were treated as a region and the other populations as another region, the result of AMOVA showed that the percentages of variation attributable to the differences between regions, among populations within regions, and among individuals within populations were 5.94% (p<0.001), 10.18% (p<0.001), and 83.88% (p<0.001), respectively.

Keywords: Genetic differentiation; Liliaceae; Lilium longiflorum Thunb. var. scabrum Masam.; RAPD.

Introduction

Lilium longiflorum Thunb. var. scabrum Masam. is a perennial herbaceous monocot of the family Liliaceae. It is distributed along the northern, eastern, and southern coast of Taiwan as well as in some of the outlying islets. Taiwan is on the southern-most boundary of L. longiflorum distribution (Shii, 1983). It possesses large flowers, ranging in color from pure white to white with purple nerves, and has potential commercial value. The species is adapted to diverse habitats and exhibits a high degree of morphological variation. In exposed seashore environments the species may form reef stands about 20 cm in height, while in shaded areas, such as under Pandanus odoratissimus L. f. forest habitat, it can reach a height of 150 cm. Shii (1983) suggested that the distribution of plant height is associated with genetic attributes, local conditions, and plant age. Lilium longiflorum var. scabrum also exhibits changes in leaf width, leaf length, flower shape, and flower color in

different habitats. Wilson (1925) stated that the Taiwanese L. longiflorum was a variety whose name should be L. longiflorum Thunb. var. insular Hort. Masamune (1954) considered it a new variety and named it L. longiflorum Thunb. var. scabrum Masam. Liu & Ying (1978) in the first edition of the Flora of Taiwan adapted the treatment of Masamune. Cheng (1990) studied the variation in twelve populations of the species in Taiwan, employing morphological characters and using Gower's similarity coefficient. The result of cluster analysis indicated that there were three phenomes. Phenomes B and C represented the Pa-Li and Lan-Yu populations, respectively. The other populations belonged to phenome A. He suggested that the observed variation was the result of genetic and environmental variations.

Plant populations may show morphological variations as adaptation to different selection pressure (Nevo et al., 1986; Morrison and Weston, 1985; Hageman and Fahselt, 1990). The adaptation may result from phenotypic plasticity and/or genetic differentiation due to natural selection and other evolutionary forces. Traditional morphological observation alone can not determine the roles of phenotypic plasticity and genetic differentiation on population

1Corresponding Author. Tel: 886-4-2840417~315; Fax: 886-4-2874740.


Botanical Bulletin of Academia Sinica, Vol. 40, 1999

variation and adaptation. The RAPD technique (Williams et al., 1990) has been successfully applied to studies of genetic differentiation in plant populations (Dawson et al., 1993; Hsiao and Rieseberg, 1994; Nesbitt et al., 1995; Wachira et al., 1995; Sale et al., 1996). RAPD has many other applications, including the identification of cultivars and varieties (Kresovich et al., 1992; Welsh and McClelland, 1990), introgression studies (McCoy and Echt, 1993), determination of parentage (Welsh et al., 1991), phylogenetic analysis (Halward et al., 1992), and construction of genetic maps (Williams et al., 1990). The RAPD technique provides a useful approach for evaluating genetic differentiation, particularly in those species that are poorly known genetically. The purpose of the present study is to describe the population variation of the present species by morphological and RAPD analyses using samples from populations of different latitudes and different geographical distances. The population diversity information obtained from the present study may serve as a reference for plant breeding, gene pool diversity, and germplasm conservation programs.

Materials and Methods

Morphological Study

The morphological study was conducted during the March-to-May flowering season. A total of five populations of L. longiflorum var. scabrum were collected on a transect along its natural distribution, which runs along the coast from south to north in Taiwan (Table 1 and Figure 1). Fifteen plants were sampled randomly from each population. Morphological characters including plant height, average length and width of five mature leaves, average length and width of corolla tubes, and the presence or absence of bulbils were recorded for each plant. Flower color was not included in the morphological study because it is highly variable within populations, ranging from pure white, to white with light purple nerves, to white with dark purple nerves.

Materials for RAPD Study

Leaf samples were collected from the 15 plants of each population used in the morphological study. Additional leaf samples were collected from another five plants selected randomly from each population. Twenty leaf samples from each population were kept in an ice chest before being brought back to the laboratory and then stored in a -70°C freezer before DNA extraction.

Figure 1. Geographic locations of the populations of Lilium longiflorum var. scabrum sampled.

DNA Extraction and Quantification

DNA extraction followed the CTAB method of Doyle and Doyle (1987). For each sample, 30 mg of fresh leaf tissue was ground with sea sand and liquid nitrogen prior to adding 0.8 ml of CTAB extraction buffer. DNA was precipited with isopropanol, and after being washed with 76% ethanol, it was dissolved in TE buffer. The DNA concentration was measured using an Hoefer TKO 100 fluorometer with Hoechst dye solution.

DNA Amplification

In a preliminary analysis, 140 RAPD primers (Operon Tech. Inc., USA; kits A, B, C, D, E, Q, and V) were screened

Table 1. Collection data.

Population Latitude Altitude Habitat

Jinshan 25°14' 10_100 m Mountain slope dominated by Alpinia speciosa (Wendl.) K. Schum.

Enliaw 25°02' 5_10 m Hibiscus rosa-sinensis L. shrub habitat

Shitiping 23°29' 2_10 m Pandanus odoratissimus L. f. forest habitat

Sanshientai 23°08' 2_50 m Rocky reef

Chiopeng 22°07' 40 m Grassland


Wen and Hsiao Genetic differentiation of Lilium longiflorum var. scabrum

Table 2. Nucleotide sequences of the 9 selected primers, GC%, number of recorded fragments, number and percentage of polymorphic fragments among population, and number and percentage of polymorphic fragments within population.

Primer Nucleotide sequence Number of Number of polymorphic fragments

recorded fragments Among population Within population

A8 5'GTGACGTAGG3' 5 5 3

A9 5'GGGTAACGCC3' 8 8 4

C5 5'GATGACCGCC3' 6 5 1

C11 5'AAAGCTGCGG3' 11 10 8

D3 5'GTCGCCGTCA3' 8 8 5

D5 5'TGAGCGGACA3' 5 4 3

Q5 5'CCGCGTCTTG3' 10 10 8

Q6 5'GAGCGCCTTG3' 7 6 4

V10 5'GGACCTGCTG3' 4 4 1

using five samples randomly chosen from the Chiopeng population. From these primers, the nine with the strongest and most reproducible amplification products were chosen for the RAPD study. The nucleotide sequences of these primers are listed in Table 2. The procedure of Williams et al. (1990) with minor modification to the temperature profile was employed in the RAPD study. The temperature used in the present study was as follows: 94°C for 2 mins; 94°C for 30 secs, 36°C for 30 secs, 72°C for 2 mins , 44 cycles; 72°C for 5 mins; 4°C end. Amplification reactions were performed in volumes of 25 µl in 0.5 ml microfuge tubes using a thermocycler (model PTC-100; MJ Research, Watertown, Mass.). Amplification products were analyzed by electrophoresis in 1.5% agarose gels using TBE buffer and then stained with ethidium bromide. A molecular size marker (1-kb ladder, Gibco BRL) was used on each run.

Statistical Analysis

Morphological data were analyzed with Duncan's new multiple range test to determine the difference between populations using an SAS software package. Data were first standardized, and then the average Euclidean distance was calculated for each population-pair. The resulting distance matrix was used in a UPGMA cluster analysis (Sneath and Sokal, 1973). The correlation between the average Euclidean distance matrix and the geographical distance matrix was tested by the Mantel test. The numerical taxonomic study was performed using NTSYS-pc (Version

1.8, Rohlf, 1993) software. For RAPD analysis, sharp and highly reproducible bands for each sample were recorded. The distances (Index of Genetic Distance) between each pair of populations was calculated using the formula by Yu and Pauls (1993):

where fi.1 and fi.2 represent the frequencies of the band i in Population 1 and Population 2, respectively, and where n is the number of bands present in each population. The resulting distance matrix was used in a UPGMA cluster analysis using NTSYS-pc software. In order to evaluate the correlation between genetic distance and geographical distance, the product-moment correlation coefficients were calculated between the IGD matrix and the geographical distance matrix, and between the IGD matrix and the average Euclidean distance matrix from morphological data. Significance levels of the correlation between matrices were estimated by the Mantel test using NTSYS-pc. The AMOVA method (Analysis of Molecular Variance; Excoffier et al., 1992) was used to estimate—among region, among population, and within population—variance components, and 1000 random permutations were used to test the significance of variance components. The algorithm of Excoffier et al. (1992) was used to calculate the distances between individuals.

Table 3. Data of morphological characters with the results of Duncan's new multiple range tests (Means with same letter attached are not significantly different at 5% level).

Mean plant Mean leaf Mean leaf Mean leaf Mean conrolla Mean corolla Mean coolla Buibil

Population height (SE) length (SE) width (SE) length/leaf length (SE) width (SE) length/corolla

(cm) (cm) (cm) width (SE) (cm) (cm) width (SE)

Jinshan 75.93a (7.41) 15.45bc(0.74) 1.40a (0.05) 11.08c(0.48) 13.00a(0.32) 10.70ab(0.70) 1.24bc(0.08) Presence

Enliaw 59.53ab(5.9) 13.10c (0.53) 1.20b (0.05) 11.08c(0.33) 13.58a(0.37) 12.20a (0.45) 1.12c (0.05) Presence

Shitiping 55.87b (6.25) 19.58a (1.37) 0.93dc(0.05) 20.90a(0.86) 14.69a(0.57) 11.34ab(0.40) 1.31b (0.02) Presence

Sanshientai 55.13b (6.25) 17.75ab (0.66) 0.85d (0.04) 20.65a(1.24) 14.43a(0.25) 10.00b (0.31) 1.46a (0.06) Presence

Chiopeng 17.47c (2.21) 15.14bc (0.99) 1.05c (0.05) 14.41b(0.66) 13.92a(0.62) 10.50b (0.59) 1.33ab(0.04) Absence


Botanical Bulletin of Academia Sinica, Vol. 40, 1999

Results

The average for each morphological character and the results of Duncan's new multiple range tests for the five populations studied are listed in Table 3. The morphological data indicated considerable morphological variation among populations. Figure 2 is the UPGMA dendrogram based on the average Euclidean distances (Table 4) calculated from the morphological data. The cophenetic correlation coefficient of this cluster analysis is 0.96. Two northern populations, Jinshan and Enliaw, linked together to form the most isolated cluster. The central eastern Shitipin and Sanshiantai populations linked at the lowest distance to form a cluster which was then joined by the southern Chiopeng population at a relatively high distance. Based on the morphological characters studied, the two central eastern populations are most related morphologically while the two northern populations are the most isolated. Mantel test revealed that the correlation coefficient between average Euclidean distance matrix and geographical distance matrix was found to be 0.300 (p=0.215), indicating the correlation was not significant.

A total of 64 strongly amplified and highly reproducible DNA fragments using 9 primers were recorded. The repeatability of these fragments was tested at least twice. Table 2 shows that among these 64 amplified fragments, 4 were monomorphic, and the rest were polymorphic among populations. Primer Q5 had the highest percentage of polymorphic fragments within populations (80%) while primer C5 had the lowest percentage (16.7%). Table 5 shows that the southern Chiopeng and the central eastern Shitiping populations had the lowest IGD value (0.0464) while Chiopeng and the northern Jinshan populations had the highest IGD value (0.0863). The geographical distances between populations are listed in Table 6. The level of congruence between the IGD matrix (Table 5) and the geographic distance matrix (Table 6) was estimated by calculating the product-moment correlation coefficient between these two matrices. A correlation coefficient of 0.695 was obtained. A Mantel test using 1000 random permutations indicated that the correlation between genetic and geographic distances was significant (p=0.043). The correlation coefficient between the IGD matrix and average Euclidean distance

Figure 3. Dendrogram generated by UPGMA clustering of RAPD IGD values (Yu and Pauls, 1993).

Figure 2. Dendrogram generated by UPGMA clusting of morphological distance values.

Table 4. Average Euclidean distances between populations calculated from the morphological data.

Population Chiopeng Sanshientai Shitiping Enliaw Jinshan

Chiopeng _

Sanshientai 1.306 _

Shitiping 1.403 0.772 _

Enliaw 1.479 1.787 1.512 _

Jinshan 1.495 1.588 1.558 0.939 _

Table 5. Index of genetic distance (IGD) between populations calculated from the RAPD data.

Population Jinshan Enliaw Shitiping Sanshientai Chiopeng

Jinshan -

Enliaw 0.0629 -

Shitiping 0.0725 0.0745 _

Sanshientai 0.0859 0.0801 0.0543 _

Chiopeng 0.0863 0.0774 0.0464 0.0685 _

Table 6. Geographic distance (km) between populations.

Population Jinshan Enliaw Shitiping Sanshientai Chiopeng

Jinshan _

Enliaw 36.00 _

Shitiping 193.50 177.50 _

Sanshientai 234.00 218.00 41.50 _

Chiopeng 354.50 342.50 167.50 128.50 _


Wen and Hsiao Genetic differentiation of Lilium longiflorum var. scabrum

matrix from morphological data was 0.035 (p=0.389), indicating the correlation was not significant. Figure 3 shows a UPGMA dendrogram based on the IGD matrix. The cophenetic correlation coefficient of this cluster analysis is 0.91. The population relationships in this dendrogram are comparable with those of the morphological dendrogram (Figure 2) if the Sanshientai population is not considered. The northern Jinshan and Enliaw populations linked together to form a distinct cluster. The Chiopeng population linked with the Shitiping population first and was then joined by the Sanshientai population. Table 7 summarizes the results of the AMOVA study. When all populations are treated as within a region, the among population variance component is 1.27 (14.08%) while the within population variance component is 7.73 (85.92%). Results of the random permutation test showed that the among population variance component is highly significant (P<0.001), indicating that the populations are significantly diversified. The within population variance component is also highly significant (P<0.001). When two northern populations were treated as one region while the rest of the populations were treated as another region, the AMOVA result showed that the percentages of variation attributable to the differences between regions, among populations within regions, and among individuals within populations were 5.94% (p<0.001), 10.18% (p<0.001), and 83.88% (p<0.001), respectively.

Discussion

Briggs and Walters (1984) stated that "samples taken from extreme habitats may exhibit a pattern of distinct `ecotype.' Samples taken from along smooth, regular gradients of soil or altitude, in contrast, may well give a pattern of clinal variation in the experimental garden". In the present study, samples were collected from populations of different latitudes and geographical distances. Although the results of morphological and RAPD analyses in the present study gave some indications of clinal trends, no conclusions can be made because of the limited number of populations studied. However, this study's results are generally in congruence with Wright's neighbourhood (or isolation by distance) model (Wright, 1946). In case where gene flow between neighboring

populations is not limited, populations of longer geographical distances will generally show greater diversification.

Plant populations under different environmental selection pressures generally show phenotypic differences. Such phenotypic differences may be the result of phenotypic plasticity and/or genetic diversification. The result of RAPD study indicated that genetic diversification existed among populations of L. longiflorum var. scabrum. With the primers used in the present study, 80_100% polymorphic bands for each primer were observed among populations. The percentages of polymorphic bands within populations for each primer were lower (16.7%_80%). It is noteworthy that the fifth band of primer A9 was present in 65% of the individuals of the Chiopeng population but completly absent in the Enliaw population. Other primers which showed frequency differences of more than 50% between populations included C5, C11, D3 and D5 (data not given). These observations also provided evidence of genetic diversification among populations.

Except for the Sanshientai population, the population relationships in the RAPD phenogram are generally comparable to those of the morphological phenogram. Sanshientai is a small reef islet isolated from Taiwan proper by a distance of 250 meters on the central eastern side of the island (Figure 1). Cheng (1990) studied the morphological variation of the present species and also found that the population on the southeastern islet Lan-yu was different from those of Taiwan proper. It is generally believed that mutation, genetic drift due to finite population size, and natural selection will lead to the genetic diversification of local populations and that the movement of gametes and individuals (i.e. gene flow) will oppose that diversification. The seeds of L. longiflorum var. scabrum are winged. The plant communities on the east coast are generally low in height. These conditions favour seed dispersals over long distances. However, Sanshientai is geographically isolated from Taiwan proper. The lack of gene flow and the effect of genetic drift due to small population size might have caused the population of Sanshientai to differentiate genetically from nearby mainland populations.

Table 7. Hierarchical analysis of molecular variance (AMOVA).

Observed partition

Variance component d.f. SSD MSD Variance % Total Pa

One region

Among population 4 132.24 33.06 1.27 14.08% <0.001 Within population 95 734.25 7.73 7.73 85.92% <0.001

Two region Region 1 52.75 52.75 0.55 5.94% <0.001

Among population 3 79.49 26.50 0.94 10.18% <0.001

Within population 95 734.25 7.73 7.73 83.88% <0.001

a Probability of having a more extreme variance component than the observed values by chance alone (Number of random permutations =1000).


Botanical Bulletin of Academia Sinica, Vol. 40, 1999

When populations were divided into two regions, with two northern populations in one region and the rest grouped in another, the result of the AMOVA indicated that the percentages of variation attributable to the differences between regions, among populations within regions, and among individuals within populations were 5.94%, 10.18%, and 83.88%, respectively. The result of the AMOVA study on RAPD data revealed that the variance component among populations was 14.08% and the variance component within populations was 85.92% of the total variation when all populations were treated as belonging to a single region. The partition of variation into variance components in Lilium longiflorum var. scabrum is comparable to those of Abies (Vicario et al., 1995) and Eucalyptus (Sale et al., 1996) species. The genetic variation between populations is lower than that of Buffalograss studied by Peakall et al. (1995). Buffalograss and lily are both widespread outcrossing herbaceous plants. However, the buffalograss populations studied belonged to two distinct ecotypes separated by a long geographical distance and located in two regions of Texas and Mexico. The percentage of variation attributable to the difference between regions in buffalograss was 58.04%. In the present study, the lily populations are separated by shorter distances on the island of Taiwan. We observed smaller genetic variation. The tests of correlations between morphological and geographical distance matrices, IGD and geographical distance matrices, and IGD and morphological distance matrices using a Mantel test revealed a significant positive correlation only between IGD and geographical distance with r=0.695 (p=0.043). A possible explanation is that the morphology of the present taxon is, to a large extent, influenced by environmental factors. Therefore, morphological distances are not significantly correlated with geographical distances. The genetic variation is related to the distances of pollen and seed dispersals. The present species is insect-pollinated with seeds unadapted for long distance dispersal. The pollen and seed dispersals are rather limited. Therefore, genetic distances are positively correlated to geographical distances while the other correlations are not significant. The islet Sanshientai population and its nearby Shitiping population show more genetic divergence than morphological differentiation. RAPDs amplify randomly across the genome. Since the majority of the genome is composed of non-coding regions, one would expect the majority of RAPD markers to be amplified from them. These regions have higher random mutation rates and may have only a few phenotypic consequences. The RAPD technique is therefore expected to be useful in detecting small genetic variations within and among populations. However, detailed morphological study is also desirable in order to understand all aspects of this variation.

Acknowledgements. This research was supported by a grant from the National Science Council of the Republic of China (NSC 86-2311-B-005-001). We thank Laurent Excoffier for providing AMOVA software, Version 1.55.

Literature Cited

Briggs, D. and S.M. Walters. 1984. Plant Variation and Evolution. 2rd edn. Cambridge University Press, pp. 148_171.

Cheng, W.T. 1990. Populational studies on formosan Lilium (Liliaceae) I. a cluster analysis of variants in L. longiflorum Thunb. Taiwania 35: 198_205.

Dawson, I.K., K.J. Chalmers, R. Waugh, and W. Powell. 1993. Detection and analysis of genetic variation in Hordeum spontaneum populations from Israel using RAPD markers. Mol. Ecol. 2: 151_159.

Doyle, J.J. and J.L. Doyle. 1987. A rapid DNA isolation procedure for small quantities of fresh leaf tissue. Phytochem. Bull. 19: 11_15.

Excoffier, L., P.E. Smouse, and J.M. Quattro. 1992. Analysis of molecular variance inferred from metric distances among DNA haplotypes: application to human mitochondrial DNA restriction data. Genetics 131: 479_491.

Hageman, C. and D. Fahselt. 1990. Enzyme electromorph variation in the lichen family Umbilicariaceae: within-stand polymorphism in umbilicate lichens of eastern Canada. Can. J. Bot. 68: 2636_2643.

Halward, T., T. Stalker, E. Larue, and G. Kochert. 1992. Use of single-primer DNA amplifications in genetic studies of peanut (Arachis hypogaea L.). Plant Mol. Biol. 18: 315_325.

Hsiao, J.Y. and L.H. Rieseberg. 1994. Population genetic structure of Yushania niitakayamensis (Bambusoideae, Poaceae) in Taiwan. Mol. Ecol. 3: 201_208.

Kresovich, S., J.G.K. Williams, J.R. Mcferson, E.J. Routman, and B.A. Schall. 1992. Characterization of genetic identities and relationships of Brassica oleracea L. via a random amplified polymorphic DNA assay. Theor. Appl. Genet. 85: 190_196.

Liu, T.S. and S.S. Ying. 1978. Liliaceae. In Li et al. (eds.), Flora of Taiwan. vol. 5. Epoch, Taipei, pp. 40_84.

Masamune, G. 1954. A List of Vascular Plants of Taiwan. Hokurikunoshokubu: Zunokai Press, Kanazawa Japan (in mineographical printing), pp. 108_111.

McCoy, T.J. and C.S. Echt. 1993. Potential of trispecies bridge crosses and random amplified polymorphic DNA markers for introgression of Medicago daghestanica and M. pironae germplasm into alfalfa (M. sativa). Genome 36: 594_601.

Morrison, D.A. and P.H. Weston. 1985. Analysis of morphological variation in a field sample of Caladenia catenata (Smith) Druce (Orchidaceae). Aust. J. Bot. 33: 185_195.

Nesbitt, K.A., B.M. Potts, R.E. Vaillancourt, A.K. West, and J.B. Reid. 1995. Partitioning and distribution of RAPD variation in a forest tree species, Eucalyptus globulus (Myrtaceae). Heredity 74: 628_637.

Nevo, E., A. Beiles, D. Kaplan, E.M. Golenberg, L. Olsvigl-Whittaker, and Z. Naveh. 1986. Natural selection of allozyme polymorphisms: a microsite test revealing ecological genetic differentiation in wild barley. Evolution 40: 13_20.

Peakall, R., P.E. Smouse, and D.R. Huff. 1995. Evolutionary implications of allozyme and RAPD variation in diploid populations of dioecious buffalograss Buchloë dactyloides. Mol. Ecol. 4: 135_147.

Rohlf, F.J. 1993. NTSYS-pc Numerical Taxonomy and Multivariate Analysis System. Applied Biostatistics Inc., New York.

Sale, M.M., B.M. Potts, and A.K. West. 1996. Molecular differentiation within and between Eucalyptus risdonii, E.


Wen and Hsiao Genetic differentiation of Lilium longiflorum var. scabrum

amygdalina and their hybrids using RAPD markers. Aust. J. Bot. 44: 559_569.

Shii, C.T. 1983. The distribution and variation of Lilium formosanum Wall. and L. longiflorum Thunb. in Taiwan. The North American Lily Society Yearbook 36: 48_51.

Sneath, P.H.A. and R.R. Sokal. 1973. Numerical Taxonomy. W. M. Freeman and Company, San Francisco.

Vicario, F., G.G. Vendramin, P. Rossi, P. Lio, and R. Giannini. 1995. Allozyme, chloroplast DNA and RAPD markers for determining genetic relationships between Abies alba and the relic population of Abies nebrodensis. Theor. Appl. Genet. 90: 1012_1018.

Wachira, F.N., R. Waugh, C.A. Hackett, and W. Powell. 1995. Detection of genetic diversity in tea (Camellia sinensis) using RAPD markers. Genome 38: 201_210.

Welsh, J. and M. McClelland. 1990. Fingerprinting genomes using PCR with arbitrary primers. Nucl. Acids Res. 18:

7213_7218.

Welsh, J., R.J. Honeycutt, M. McClelland, and B.W.S. Sobral. 1991. Parentage determination in maize hybrids using the arbitrarily primed polymerase chain reaction (AP-PCR). Theor. Appl. Genet. 82: 473_476.

Williams, J.G.K., A.R. Kubelik, K.J. Livak, J.A. Rafalski, and S.V. Tingey. 1990. DNA polymorphisms amplified by arbitrary primers are useful as genetic markers. Nucl. Acids Res. 18: 6531_6535.

Wilson, E.H. 1925. The Lilies of Eastern Asia. Dulau and Company, London, pp. 1_26.

Wright, S. 1946. Isolation by distance under diverse systems of mating. Genetics 31: 39_59.

Yu, K. and K.P. Pauls. 1993. Rapid estimation of genetic relatedness among heterogeneous population of alfalfa by random amplification of bulked genomic DNA samples. Theor. Appl. Genet. 86: 788_794.