Bot. Bull. Acad. Sin. (2000) 41: 35-39

Siddique et al. — Drought effects on water relations

Drought stress effects on water relations of wheat

M.R.B. Siddique1, A. Hamid, M.S. Islam2

Institute of Postgraduate Studies in Agriculture, Gazipur-1703, Bangladesh

(Received July 16, 1998; Accepted May 27, 1999)

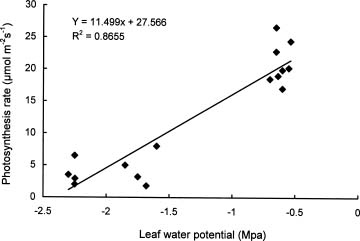
Abstract. Drought effects on the water relations of four wheat (Triticum aestivum L.) cultivars were evaluated. Four cultivars, Kanchan, Sonalika, Kalyansona, and C306, were grown in pots and subjected to four levels of water stress at vegetative or anthesis stages or both. Exposure of plants to drought led to noticeable decreases in leaf water potential and relative water content with a concurrent increase in leaf temperature. The higher leaf water potential and relative water content as well as lower leaf temperature were associated with a higher photosynthetic rate. Drought stressed plants displayed higher canopy temperature than well-watered plants at both vegetative growth and anthesis growth stages. Successive stresses at both developmental stages raised the canopy temperature much higher than in plants stressed only once.

Keywords: Drought; Triticum aestivum L.; Water relations.

Introduction

The best option for crop production, yield improvement, and yield stability under soil moisture deficient conditions is to develop drought tolerant crop varieties. A physiological approach would be the most attractive way to develop new varieties rapidly (Turner and Nicolas, 1987), but breeding for specific, suboptimal environments involves a deeper understanding of the yield-determining process (Blum, 1983). This is where knowledge of crop responses to water deficits may be best put to use.

Leaf water potential is considered to be a reliable parameter for quantifying plant water stress response. Singhet al. (1990) observed significant differences in water potential among wheat genotypes under drought stress. Sinclair and Ludlow (1985) proposed that leaf relative water content (RWC) was a better indicator of water status than was water potential. Canopy temperature is also related to water stress. Ehrler et al. (1978) reported that the canopy temperature provided a good indication of the plant water potential of wheat when comparing environments with varying degrees of water stress. This study investigated the water relations of wheat under different levels of drought stress.

Materials and Methods

An experiment was conducted at the Institute of Postgraduate Studies in Agriculture (IPSA), Bangladesh, from November 1994 through March 1995. Scanty rainfall, low

humidity, and clear sunny days were the characteristic feature of the growing season. Four cultivars, Kanchan, Sonalika, Kalyansona, and C306, were grown in Waggner pots (24 cm diameter) containing 12 kg sandy clay loam soil. A fertilizer mixture containing 600 mg N, 360 mg P, 240 mg K, and 120 mg S as urea, triple super phosphate, muriate of potash, and gypsum was applied per pot. Ten seeds were sowed in each pot. One week after emergence, the seedlings were thinned to three per pot.

There were 160 pots, 40 per cultivar. The plants were subjected to these four levels of water regimes: (1) Control: pots were never allowed to dry out; (2) Vegetative drought: stress was imposed at early vegetative stage by withholding irrigation; (3) Anthesis drought: irrigation was withheld at anthesis and (4) Both vegetative and anthesis drought: drought stress was imposed at early vegetative stage as well as anthesis.

The pots were arranged in a 4 × 4 factorial, randomized, complete block design. Ten pots were employed per treatment per variety. Intercultural operations were done as and when needed. Drought treatments were imposed by restricting irrigation, and plants were re-irrigated when they showed the signs of wilting or leaf rolling, particularly in the morning. Control pots were irrigated as frequently as needed.

Observations of leaf water potential and relative water content were taken at the anthesis stage of the crop. Soil water potential and leaf and canopy temperatures were measured at the vegetative and anthesis stages of the crop.

Leaf Water Potential (Y1) and Soil Water Potential (Ys)

Leaf water potential was measured once on flag leaves 7 days after imposing drought stress at anthesis. Yl was measured between 1,100 and 1,300 h because Fischer and

1Assistant Commissioner, Naogaon Collectorate, Naogaon, Bangladesh.

2Corresponding author. Senior Scientific Officer, Agronomy Division, Bangladesh Rice Research Institute, Gazipur-1701, Bangladesh.


Botanical Bulletin of Academia Sinica, Vol. 41, 2000

Sanchez (1979) showed that Yl was reasonably stable during this period. Measurements of Yl were made with a thermocouple psychrometer (Model SC-10A, Decagon Devices, Inc. Pullman. WA.) assembled with a nanovoltmeter (Model NT-3, Decagon Devices, Inc. Pullman. WA.). Before re-irrigating stressed plants, the soil water potential (Ys) was also measured with the thermocouple psychrometer.

Relative Water Content (RWC)

Relative water content (RWC) was measured using flag leaves after imposing drought conditions. Immediately after cutting at the base of lamina, leaves were sealed within plastic bags and quickly transferred to the laboratory. Fresh weights were determined within 2 h after excision. Turgid weights were obtained after soaking leaves in distilled water in test tubes for 16 to 18 h at room temperature (about 20°C) and under the low light conditions of the laboratory. After soaking, leaves were quickly and carefully blotted dry with tissue paper in preparation for determining turgid weight. Dry weights were obtained after oven drying the leaf samples for 72 h at 70°C. RWC was calculated from the equation of Schonfeld et al. (1988):

Measurement of Canopy Temperature

Canopy temperature was measured with an infra-red thermometer (Model THI-500, TASCO, Japan). The thermometer was held so that the sensor viewed only the canopy at an oblique angle above the horizontal; this position gave an elliptical canopy target (O’Toole and Real, 1984) and prevented the thermometer from sensing the soil surface when the leaves were rolled. All canopy temperature measurements were made within 2 h of solar noon, and in a south-facing direction, to minimize sun angle effects, as suggested by Turner et al. (1986).

Measurements of Photosynthetic Rate

Photosynthetic rates were measured on young fully-expanded leaves of seedlings and on flag leaves of full grown stressed and un-stressed plants using a portable photosynthesis system (Li-COR LI-6200), attached to an infra-red gas analyzer (Li-COR LI-6250) and a data logger, following the procedure of Al-Khatib and Paulsen (1990). Leaf temperature was recorded simultaneously, from the measurement.

Results and Discussion

Soil Water Potential

The soil water potential was more or less similar in all cultivars for all growth stages (Table 1). Drought stress reduced the soil water potential at both vegetative and anthesis stages. However, the magnitude of differences in soil water potential resulting from drought was much higher at anthesis than at vegetative stage. Differences in manifestation of drought stress effects between vegetative and anthesis stages were explainable, at least partly, by the wide differences in soil water potential.

Leaf Water Potential

Leaf water potentials measured at anthesis were higher in Kanchan and Kalyansona than in Sonalika and C306 (Table 2). Drought stress reduced the leaf water potential from -0.63 MPa in control plants to -2.00 MPa in stressed plants. Mpa (megapascal) is a unit of atmospheric pressure which is used in place of bars and 1 MPa = 10 bar (Kramer, 1983). Our results are in agreement with those of Rascio et al. (1988). Pennypacker et al. (1990) also found a similar decrease of leaf water potential in alfalfa as result of drought stress. The changes in plant water potential might be attributable to a change in osmotic pressure—the osmotic component of water potential. Although there were significant differences in leaf water potentials among the cultivars, the interactions between cultivar and drought treatment were not significant.

Table 2. Leaf water potential and relative water content of four wheat cultivars in response to drought stress at anthesis.

Treatment Leaf water potential Relative water content (MPa) (%)

Cultivars

Kanchan -1.16 A 65.35 AB

Sonalika -1.42 B 69.56 A

Kalyansona -1.19 A 68.02 A

C306 -1.47 B 62.22 B

Drought period

Control -0.63 A 88.03 A

Vegetative drought -0.64 A 86.36 A

Anthesis drought -1.98 B 44.60 B

Both -2.00 B 46.15 B

CV (%) 17.33 8.08

In a column, means followed by common letter(s) are not significantly different at the 5% level by DMRT.

Table 1. Soil water potential (MPa) of four wheat cultivars in response to drought stress at two growth stages.

Treatment Vegetative Anthesis

Cultivars

Kanchan -1.33 A -1.45 A

Sonalika -1.66 A -1.29 A

Kalyansona -1.82 A -1.43 A

C306 -1.33 A -1.57 A

Drought period

Control -0.27 A -0.07 A

Vegetative drought -2.80 B -0.06 A

Anthesis drought - -2.71 B

Both - -2.91 B

CV (%) 27.49 35.53

In a column, means followed by common letter(s) are not significantly different at the 5% level by Duncan’s multiple range test (DMRT).


Siddique et al. — Drought effects on water relations

Relative Water Content

Cultivars Kanchan, Sonalika and Kalyansona maintained higher RWCs at anthesis, whereas C306 had the lowest RWC values (Table 2). During plant development, drought stress significantly reduced RWC values from 88% to 45%. Plants subjected to water stress at the vegetative stage showed RWC values as high as control plants at anthesis, suggesting that rewatering after the release of stress at the vegetative stage enabled full recovery of plant vigor. By the time plants attained the reproductive stage, the effects of water stress imposed at the preceding growth stage had diminished. Techawongstin et al. (1993) reported a similar phenomenon in water-stressed hot pepper.

Values for photosynthetic rate, leaf water potential, and relative water content were not obtained at the same time. Cultivars differed in phenological development, and their anthesis occurred at different dates. Stress treatments were imposed immediately after anthesis and measurements were performed subsequently. However, trends among the characters of each cultivar were similar. It was generally observed that the higher the leaf water potential and RWC, the higher was the photosynthetic rate. The data in Figure 1 makes it apparent that a high positive correlation (R2=0.86) existed between leaf water potential and photosynthesis.

Leaf Temperature

Cultivar C306 showed higher leaf temperature when stressed at the vegetative stage (Table 3). Leaf temperatures of Sonalika and Kalyansona were significantly lower than that of C306. Stress treatments at anthesis showed C306 and Sonalika to have higher leaf temperature than Kanchan and Kalyansona.

Leaf temperatures in drought stressed plant were higher than in well-watered plants at both growth stages (Table 3). The plants that showed a lower leaf temperature also showed a higher photosynthetic rate. The lower photosynthetic rate in plants acclimated to a higher temperature

might have resulted from increased respiration (Jones, 1983). Winter et al. (1988) also found significant differences in leaf temperature between drought stressed and irrigated plants, but not among the wheat cultivars.

Canopy Temperature

Canopy temperatures measured during the vegetative stage did not vary significantly among the cultivars; but differences among cultivars at anthesis were statistically significant (Table 3). Drought stressed plants displayed higher canopy temperatures than well-watered plants. The magnitude of the rise in canopy temperature among water stressed plants was also influenced by successive stress imposition. Stress applied at vegetative and anthesis stages, for instance, raised the canopy temperatures much higher than in plants stressed only once.

Few laboratory studies have compared actual and predicted changes in leaf temperatures because of difficulty in characterizing the nature of heat exchange. Remote measurement of leaf temperature can be extremely fast and

Figure 1. Relationship between leaf water potential and photosynthetic rate of four wheat cultivars in response to drought stress at anthesis stage.

Table 3. Leaf temperature and canopy temperature of four wheat cultivars in response to drought stress at two growth stages.

Treatment Leaf temperature (°C) Canopy temperature (°C)

Vegetative Anthesis Vegetative Anthesis

Cultivars

Kanchan 32.10 AB 28.79 B 25.53 A 26.24 B

Sonalika 31.48 B 30.69 A 24.95 A 23.89 C

Kalyansona 31.40 B 28.75 B 26.15 A 25.48 B

C306 33.28 A 30.53 A 24.70 A 29.18 A

Drought period

Control 30.66 B 28.44 B 23.26 B 23.18 C

Vegetative drought 33.47 A 28.23 B 27.41 A 23.98 C

Anthesis drought - 30.82 A - 27.75 B

Both - 31.27 A - 29.90 A

CV (%) 3.33 3.22 4.78 5.93

In a column, means followed by common letter(s) are not significantly different at the 5% level by DMRT.


Botanical Bulletin of Academia Sinica, Vol. 41, 2000

proach to Environmental Plant Physiology. Camb. Univ. Press, Camb. London.

Kramer, P.J. 1983. Water Relations of Plants. Academic Press, Inc. California, 16 pp.

O’Toole, J.C. and J. Real. 1984. Canopy target dimensions for infrared thermometry. Agron. J. 76: 863-865.

Pennypacker, B.W., K.L. Leath, W.L. Stout, and R.R. Hill. 1990. Technique for simulating field drought stress in greenhouse. Agron. J. 82: 951-957.

Rascio, A., M.C. Cedola, G. Sorrentino, D. Pastore, and G. Wittmer. 1988. Pressure volume curves and drought resistance in two wheat genotypes. Physiol. Plant. 73: 122-127.

Schonfeld, M.A., R.C. Johnson, B.F. Carver, and D.W. Mornhinweg. 1988. Water relations in winter wheat as drought resistance indicator. Crop Sci. 28: 526-531.

Sinclair, T.R. and M.M. Ludlow. 1985. Who taught plants thermodynamics? The unfulfilled potential of plant water potential. Aust. J. Plant Physiol. 33: 213-217.

Singh, M., J.P. Srivastava, and A. Kumar. 1990. Effect of water on water potential components in wheat genotypes. Indian J. Plant Physiol. 33: 312-317.

Techawongstin, S., E. Nawata, and S. Shigenaga. 1993. Recovery in physiological characteristics from sudden and gradual water stress in hot-peppers. In C.G. Kuo (ed.), Adaptations of Food Crops to Temperature and Water Stress. Proc. of an International Symposium, Taiwan, 13-18 August 1992. AVRDC, Taiwan, pp. 140-147.

Turner, N.C. and M.E. Nicolas. 1987. Drought resistance of wheat for light-textured climate. In J.P. Srivastava, E. Proceddu, E. Acevedo, and S. Varma (eds.), Drought Tolerance in Winter Cereals. John Wiley and Sons, New York, pp. 203-216.

Turner, N.C., J.C. O’Toole, T.T. Cruz, O.S. Namuco, and S. Ahmad. 1986. Response of seven diverse rice cultivars to water deficits. I. Stress development, canopy temperature, leaf rolling and growth. Field Crops Res. 13: 257-271.

Winter, S.R., J.T. Musick, and K.B. Porter. 1988. Evaluations of screening techniques for breeding drought-resistant winter wheat. Crop Sci. 28: 512-516.

simple, but the technique has several limitations. Some degree of drought is required for expression of genotypic differences (Blum et al., 1982). A second major limitation is that remote leaf temperature measurement requires a dense canopy covering the soil surface (Blum et al., 1982). This is because a high soil temperature would introduce bias into the leaf temperature measurement. In the pot experiment, a closed canopy was never achieved, so advection of soil temperature might have added to the complexity of the measurements.

Results obtained in this experiment indicated that drought stress significantly decreased the leaf water potential and relative water content of wheat, which had pronounced effects on photosynthetic rate. Leaf and canopy temperature increased due to drought stress that might have occurred due to increased respiration and decreased transpiration resulting from stomatal closure.

Literature Cited

Al-Khatib, K. and G.M. Paulsen. 1990. Photosynthesis and productivity during high-temperature stress of wheat genotypes from major world regions. Crop Sci. 30: 1127-1132.

Blum, A. 1983. Breeding programs improving drought resistance to water stress. In C.D. Jr, Raper and P.J. Kramer (eds.), Crop reaction to Water and Temperature Stresses in Humid, Temperate Climates. Westview Press, Boulder, Colorado, USA, pp. 263-275.

Blum, A., J. Mayer, and G. Gozland. 1982. Infrared thermal sensing of plant canopies as a screening technique for dehydration avoidance in wheat. Field Crop Res. 5: 137-146.

Ehrler, W.L., S.B. Idso, R.D. Jackson, and R.J. Reginato. 1978. Wheat canopy temperature: Relation to plant water potential. Agron. J. 70: 251-256.

Fischer, R.A. and M. Sanchez. 1979. Drought resistance in spring wheat cultivars. II. Effects on plant water relations. Aust. J. Agric. Res. 30: 801-814.

Jones, H.G. 1983. Plants and Microclimate: A Quantitative Ap


Siddique et al. — Drought effects on water relations

°®§ò°f¹Ò¹ï¤p³Á¤ôÃö«Yªº¼vÅT

M.R.B. Siddique, A. Hamid, and M.S. Islam

Institute of Postgraduate Studies in Agriculture, Gazipur-1703, Bangladesh

°®§ò¹ï¥|ºØ¤p³Á®â°öºØ¡]Triticum aestivum L.¡^¤ôÃö«Yªº¼vÅT¦b¥»¬ã¨s¤¤¶i¦æµû¦ô¡CKanchan¡ASonalika ¡AKalyansona ¤Î C306 ¥|­Ó®â°öºØ¸m©ó¬Ö¤º¥Íªø¡A¤À§O¦bÀç¾i¦¨ªø´Á©Î²±ªá´Á¥H¤Î¨â­Ó®É´Á¦P®É ¥H¥|ºØ¤£¦Pµ{«×ªº¤ô°f¹Ò³B²z¡C´Ó®è¼ÉÅS©ó°®§ò¤U¡A¸­¤lªº¤ô¶Õ¤Î¬Û¹ï¤ô§t¶qÅãµÛ¤U­°¡A¦P®É¸­¤lªº·Å«× «h¼W¥[¡C¸û°ªªº¸­¤l¤ô¶Õ»P¬Û¹ï§t¤ô¶q¤Î¸û§Cªº¸­·Å±`©M¸û°ªªº¥ú¦X§@¥Î³t²v¦³ÃöÁp©Ê¡C¤£½×¦bÀç¾i¦¨ªø ´Á©Î²±ªá´Á¡A°®§ò°f¹Ò´Ó®è¤ñ¤ô¤À¨ÑÀ³¥R¨¬´Ó®è¦³¸û°ªªº¤Ñ½´·Å«×¡C¦b´Ó®èªº³o¨â­Óµo¨|¶¥¬q¤¤¡A³sÄòªº °f¹Ò³B²z¤ñ¥u¦³¤@¦¸ªº°f¹Ò³B²z¦³¸û°ªªº¤Ñ½´·Å«×¡C

ÃöÁäµü¡G°®§ò¡F¤p³Á¡F¤ôÃö«Y¡C