DNA in the moss family Hylocomiaceae

Bot. Bull. Acad. Sin. (2000) 41: 85-92

Chiang and Schaal — Evolution of a cpDNA noncoding spacer

Molecular evolution of the atpB-rbcL noncoding spacer of

chloroplast DNA in the moss family Hylocomiaceae

Tzen-Yuh Chiang1,3 and Barbara A. Schaal2

1Department of Biology, Cheng-Kung University, Tainan 700, Taiwan

2Department of Biology, Washington University, St. Louis, MO 63130, USA

(Received January 20, 1999; Accepted July 28, 1999)

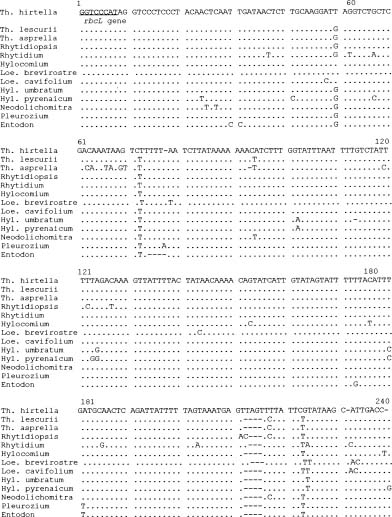
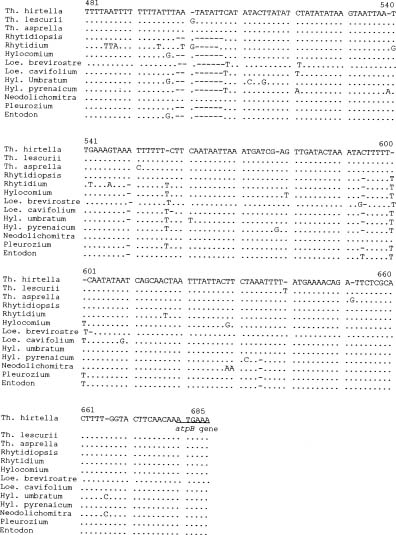
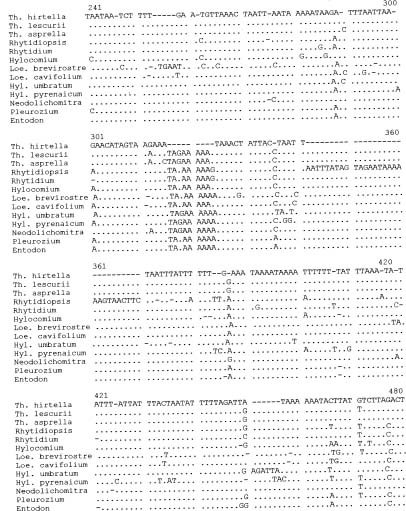
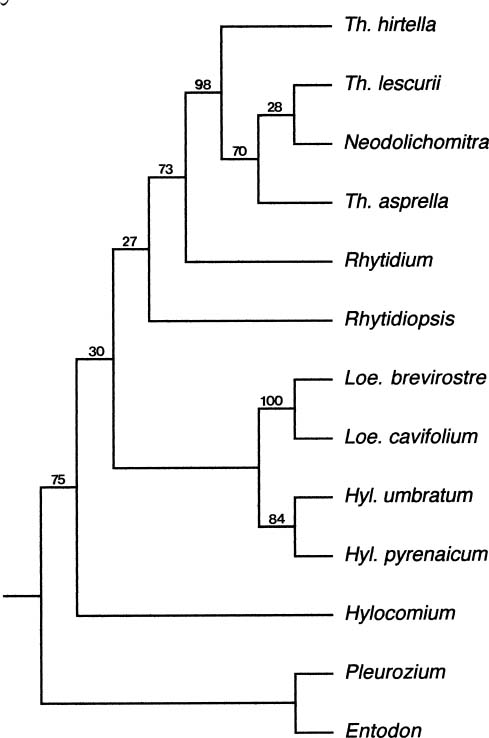
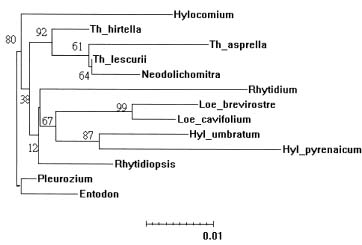
Abstract. Molecular evolution of the chloroplast noncoding region between the atpB and rbcL genes was investigated in the moss family Hylocomiaceae. Nucleotide substitution contributed to most of the variation among taxa, although an insertion of 29 base pairs was found in Rhytidiopsis robusta. The evolution of atpB-rbcL intergenic spacer was constrained in Hylocomiaceae compared to the evolutionary rates of this chloroplast spacer, and even of the rbcL gene, in angiosperms. Using a relative rate test procedure, substitution rates of the chloroplast spacer were found to be consistent with the hypothesis of a molecular clock, except for three taxa. Based on previous knowledge of the evolutionary rate of this spacer in true mosses, the divergence of the Hylocomiaceae from their common ancestor was estimated to be 29.0 million years ago, which is consistent with the fossil record. The chloroplast sequences supported the monophyly of the Hylocomiaceae with a bootstrap value of 82%. The effects of long branch attraction caused the erroneous placements of Rhytidiopsis and Rhytidium in the parsimony analysis. In contrast, neighbor-joining analysis provided a more congruent estimate of the phylogeny of the Hylocomiaceae based on the cpDNA variation observed.

Keywords: atpB-rbcL intergenic spacer; Chloroplast DNA; DNA sequence; Gene tree; Hylocomiaceae; Long branch attraction; Molecular clock; Mosses.

Introduction

The atpB-rbcL spacer, a noncoding region of the chloroplast genome, has been recently used in phylogenetic studies of angiosperms (Golenberg et al., 1993; Manen et al., 1994b), such as the Betulaceae (Bousquet et al., 1992a), Celastrales (Savolainen et al., 1994) and Rubiaceae (Manen et al., 1994a; Manen and Natali, 1995; Natali et al., 1995), as well as of mosses (Chiang, 1994). The length of the spacer region varies from 519 to 557 base pairs in true mosses, which is longer than in the liverwort Marchantia polymorpha. The evolution of the atpB-rbcL spacer sequence of the true mosses (Chiang, 1994) is constrained relative to the spacer in angiosperms as well as to the rbcL gene in angiosperms (Zurawski et al., 1984; Manen and Natali, 1995).

In a previous study, the evolution of the chloroplast atpB-rbcL spacer in 11 families of true mosses was analyzed (Chiang, 1994). At this broad level, the spacer evolved at a rate consistent with the hypothesis of a molecular clock. In this study, we investigated the tempo and mode in evolution of the atpB-rbcL chloroplast spacer within the family Hylocomiaceae, which are widespread in temperate regions and occur on high mountains in the tropics (Rohrer, 1985). The phylogenetic relationships among

genera in this family have been determined based on the sequences of both the internal transcribed spacers of nuclear ribosomal DNA and the atpB-rbcL chloroplast spacer (Chiang, 1994). In contrast to a cladistic analysis based on morphological traits of the Hylocomiaceae (Rohrer, 1985), which recognized 12 genera, our study excluded six genera [i.e. Pleurozium, Rhytidiadelphus, Macrothamnium, Orontobryum, Leptohymenium, and Leptocladiella (cf. Chiang, 1995)] from the family. In addition, Thelia, a genus endemic to North America, was included as a member of the Hylocomiaceae based on molecular evidence (Chiang, 1994), bringing the genus number of the family up to seven.

This study had four goals: 1) to reconstruct the gene tree of the atpB-rbcL spacer in the family Hylocomiaceae; 2) to investigate the evolutionary rates of this spacer; 3) to test the hypothesis of a molecular clock; and 4) to estimate the time of divergence from a common ancestor of the Hylocomiaceae.

Materials and Methods

Plant Materials

According to a previously inferred phylogeny, eleven species of seven genera have been included in the Hylocomiaceae (Chiang, 1994). For the current study, all species of the Hylocomiaceae as well as two outgroup taxa, Pleurozium schreberi (Brid.) Mitt. and Entodon seductrix (Hedw.) C. Muell., were included (Table 1)

3Corresponding author. Tel: +886-6-2757575 ext. 65525; Fax: +886-6-2742583; E-mail: tychiang@ccvax.sinica.edu.tw


Botanical Bulletin of Academia Sinica, Vol. 41, 2000

Table 1. List of taxa examined in this study and the voucher specimens (cf. Rohrer 1985; Chiang, 1994).

Taxa Localities Vouchers

Ingroups: Family Hylocomiaceae

Hylocomium splendens (Hedw.) B. S. G North Carolina, USA Chiang 31091 Hylocomiastrum umbratum (Hedw.) Fleisch. North Carolina, USA Chiang s.n.

H. pyrenaicum (Spruce) Lindb. British Columbia, Canada Vitt 34097 Loeskeobryum brevirostre (Brid.) Fleisch. North Carolina, USA Chiang s.n.

L. cavifolium (Lac.) Fleisch. Mt. Fuji, Japan Inoue 935 Neodolichomitra yunnanensis (Besch.) T. Kop. Yunnan, China He 30880 Rhytidiopsis robusta (Hook.) Broth. Washington, USA Chiang 198 Rhytidium ruginosa (Hedw.) Kindb. Sichuan, China Redfearn 35492 Thelia asprella Sull. Missouri, USA Allen 13398

T. hirtella (Hedw.) Sull. Florida, USA Allen 8566

T. lescurii Sull. Alabama, USA Willis 126

Outgroup:

Pleurozium schreberi (Brid.) Mitt. Sichuan, China Whittemore 3969 Entodon seductrix (Hedw.) C. Muell Missouri, USA Crosby s.n.

Two primers (Chiang et al., 1998), rbcL-1 and atpB-1, were developed for amplifying and sequencing the atpB-rbcL spacers from the sequences of Marchantia (Umesono et al., 1988), tobacco (Shinozaki et al., 1986) and rice (Nishizawa and Hirai, 1987).

PCR reactions were carried out using Taq polymerase (Promega) at an annealing temperature of 57°C. PCR products were polyacrylamide-gel-purified and sequenced by the dideoxy-mediated chain-termination method (Sanger et al., 1977). The fmolTM DNA Sequencing System (Promega), which uses Taq polymerase, was used for sequencing. The detergent NP-40 was added to assist sequencing through G-C rich regions and secondary structure (Wang et al., 1992). Both strands of DNA were sequenced with about a 50 base overlap.

Data Analysis

Sequence alignment. Sequences were aligned by multiple alignments without weighting transversions or transitions using the Clustal V Program (Higgins et al., 1992) and later adjusted visually. The fixed gap penalty was 35 and the floating penalty was 4.

Phylogenetic analyses. Cladistic analyses of the atpB-rbcL sequence data were performed using a maximum parsimony criterion (PAUP, Version 3.1.1., Swofford, 1993) and by Neighbor-Joining (NJ) (MEGA, Version 1.01, Kumar et al., 1993). Parsimony analyses were conducted using heuristic searches with TBR branch swapping, accelerated transformation (ACCTRAN), stepwise addition of 10 random replicates, an unconstrained number of maximum trees, and retention of multiple most parsimonious trees (MULPARS). Indels were recognized as additional characters, and all characters were unweighted. Both strict (Sokal and Rohlf, 1981) and 50% majority-rule (Margush and McMorris, 1981) consensus trees were rooted at Pleurozium andEntodon. Neighbor-joining analyses were conducted using Kimura’s (1980) 2-parameter distance.

(Chiang, 1994). Plants of four taxa—Hylocomium splendens (Hedw.) B. S. G., Hylocomiastrum umbratum (Hedw.) Fleisch., Rhytidiopsis robusta (Hook.) Broth., and Loeskeobryum brevirostre (Brid.) Fleisch.—were collected from field locations within the United States and air-dried without special field treatment. Herbarium specimens of other taxa were used for DNA isolation (Table 1). At least two samples from different populations were sequenced for ingroup species. Since no variation of this atpB-rbcL noncoding spacer in mosses has been found within species, only one sequence of each taxon was included in the analysis (Chiang, 1994). Voucher specimens are in the herbarium of the Missouri Botanical Garden (MO).

DNA Extraction and Sequencing

Leaf tissue from single individuals was frozen in liquid nitrogen and ground in Eppendorf tubes with a metal dounce. Genomic DNAs were extracted from the powdered tissue in 600 µl 2X CTAB buffer (Murray and Thompson, 1980) with 0.4% (v/v) b-mercaptoethanol and incubated for 1 h at 65°C. After adding equal volumes of 24:1 chloroform: isoamyl alcohol, the tissue mixture was centrifuged at 14,000 rpm for 15 min at room temperature. The supernatant was transferred to an Eppendorf tube followed by addition of 1.2 ml of absolute ethanol. After overnight incubation at 4°C, DNA was recovered by centrifuging the mixture at 14,000 rpm for 15 min at 4°C. The brown to black DNA pellet was rinsed in 70% ethanol and centrifuged for 5 min at 10,000 rpm. The DNA pellet was resuspended in 20 µl TE.

The extracted genomic DNA was purified on a low-melt agarose gel to remove secondary compounds and RNAs. The band containing the DNA of the correct size was cut out of the gel and transferred to an Eppendorf tube. Equal weights of distilled water were added to the gel block containing the purified DNAs. Prior to use of the DNAs for PCR, the gel was heated in a 65°C water bath for 3 min.


Chiang and Schaal — Evolution of a cpDNA noncoding spacer

as the reference species. The data on the number and ratio of transversions versus transitions between taxa was obtained from MEGA. The null hypothesis of a molecular clock predicts that the number of nucleotide substitutions between two lineages will be the same. Based on the assumption of a normal distribution of nucleotide substitutions (Wu and Li, 1985), the hypothesis of a molecular clock will be rejected with 95% significance when the difference of substitution rates between two lineages is greater than 1.96 times the standard error.

Results

Nucleotide Sequences and Variation

The length of the atpB-rbcL spacer varies from 553 (Hylocomium splendens) to 587 (Rhytidiopsis robusta) base pairs within the Hylocomiaceae. The spacer of Entodon is shorter (549 base pairs) than that of ingroup taxa and the other outgroup Pleurozium (555 base pairs). Sequence alignment is shown in Figure 1. This noncoding chloroplast spacer is highly A+T rich (37.7% A and 42.4% T, on average). This agrees with data from most noncoding spacers and pseudogenes (Li, 1997).

Of 671 positions of the aligned sequences of the noncoding spacer, 289 are variable (43.1%); 226 substitutions occur in only a single taxon (autapomorphies); and 67 bases (10.0% of total) are informative for phylogenetic reconstruction. Insertions/deletions (indels) are a common phenomenon in the chloroplast spacer of the Hylocomiaceae and the outgroup taxa. Of 330 indel events, based on pairwise comparisons, 249 (75.5%) are single base indels, 49 (14.8%) are 2- to 5-base indels; and 20 (6.0%) are 6- to 9-base indels. Several insertions were identified: a four base insertion (TTAG, 212-215) in Thelia hirtella; a 4-base insertion (GAAT, 255-258) in Loeskeobryum brevirostre; a 6-base insertion (AGATTA, 451-456) in Hylocomiastrum umbratum; a 9-base insertion (499-507) in the species of Thelia and Neodolichomitra; and a 29-base insertion (342-370) in Rhytidiopsis robusta.

A g1 test (Huelsenbeck, 1991) of skewed tree-length distribution was calculated from 10,000 random trees generated by PAUP in order to measure the information content of the data. Critical values of the g1 test were obtained from Hillis and Huelsenbeck (1992). The fit of character data on phylogenetic hypotheses (Swofford, 1991) was evaluated by the consistency index, CI (Kluge and Farris, 1969) and the retention index, RI (Archie, 1989; Farris, 1989). The statistical significance of the CI was determined according to the method of Klassen et al. (1991). Confidence in the clades was tested by bootstrapping (Efron, 1982; Felsenstein, 1985) with 400 replicates (Hedges, 1992) of heuristic searches on the 50% majority rule trees. The nodes with bootstrap values >0.70, as a rule of thumb, were considered significantly supported with ³95% probability (Hillis and Bull, 1993).

Tests of taxonomic congruence and alternative trees. The phylogeny inferred from the chloroplast spacer sequence represents a gene phylogeny and may conflict with the organismal tree. In this study, a reconstructed most parsimonious phylogeny of Hylocomiaceae inferred from the combined data of ITS rDNA and atpB-rbcL sequences (Chiang, 1994) was taken as the organismal tree. To test the taxonomic congruence between topologies as well as gene trees versus the organismal tree, a nonparametric Wilcoxon sign-ranked test was employed (Templeton, 1983). Two-tailed probabilities were used to examine significance levels (Felsenstein, 1985; statistical tables see Sokal and Rohlf, 1981). The information on characters favoring each tree, with the direction of different steps according to the assumption of parsimony, was obtained from the computer program MacClade (Maddison and Maddison, 1992).

Relative rate tests. The hypothesis of a molecular clock (Zuckerkandl and Pauling, 1965) was tested by a relative rate test (Sarich and Wilson, 1973; Wu and Li, 1985). The total number of nucleotide substitutions (K), which is the number of transitional and transversional substitutions per site, was calculated from each lineage using Pleurozium

Table 2. Numbers of transitions/transversions (above diagonal) and their ratios (below diagonal) between taxa. 1, Thelia hirtella; 2, T. lescurii; 3, T. asperella; 4, Rhytidiopsis; 5, Rhytidium; 6, Hylocomium; 7, Loeskeobryum brevirostre; 8, L. cavifolium; 9, Hylocomiastrum umbratum; 10, Hylocomiastrum pyrenaicum; 11, Neodolichomitra; 12, Pleurozium; 13, Entodon. Both Pleurozium and Entodon were chosen as outgroups.

1 2 3 4 5 6 7 8 9 10 11 12 13

1 6/2 9/7 11/5 9/14 10/9 9/7 10/6 10/8 12/12 5/4 6/6 6/7

2 3.00 3/7 9/3 11/12 11/9 14/7 13/8 14/8 16/10 1/2 7/5 7/8

3 1.29 0.43 12/10 14/19 14/16 17/14 16/13 17/13 19/17 4/9 10/12 10/13

4 2.20 3.00 1.20 12/12 11/8 13/8 10/9 12/9 15/9 11/5 6/6 5/9

5 0.64 0.92 0.74 1.00 13/18 14/17 11/18 14/17 15/18 12/15 8/14 7/17

6 1.11 1.22 0.88 1.38 0.72 15/10 14/11 14/13 16/15 13/9 6/10 7/10

7 1.71 2.00 1.21 1.63 0.82 1.50 4/5 14/11 13/13 14/9 8/10 7/13

8 1.68 1.63 1.23 1.11 0.61 1.27 0.80 13/10 11/14 12/10 7/12 6/12

9 1.25 1.75 1.31 1.33 0.82 1.08 1.27 1.30 7/14 15/10 7/11 6/10

10 1.00 1.60 1.12 1.67 0.83 1.07 1.56 0.79 0.50 16/12 10/13 9/16

11 1.25 0.50 0.44 2.20 0.80 1.44 0.80 1.20 1.50 1.33 8/7 8/10

12 1.00 1.40 0.83 1.00 0.57 0.60 1.00 0.64 0.64 0.77 0.14 1/4

13 0.86 0.88 0.77 0.56 0.41 0.70 0.54 0.50 0.60 0.56 0.80 0.25


Botanical Bulletin of Academia Sinica, Vol. 41, 2000

Figure 1. Alignment of nucleotide sequences of atpB-rbcL spacer of the chloroplast DNA of the Hylocomiaceae and outgroups.

Based on pairwise comparisons conducted by the MEGA program, a total of 1,627 nucleotide substitution events occurred between the taxa of Hylocomiaceae and the outgroups, of which 812 were transitions and 815 were transversions (Table 2). The ratio of transitions to transversions is 0.996 (»1.0), which is very close to the ratio (Ti/Tv = 0.97) in the tribe Rubieae (Manen and Natali, 1995). The transitions/transversions ratio for pairwise comparisons between taxa is highly variable (Table 2) ranging from 0.14 to 3.00. Nevertheless, most of the ratio of transitions to transversions is higher than the expected value of 0.5 and shows a bias favoring transitions.

Phylogenetic Reconstruction

Six equally parsimonious trees of 257 steps were identified by parsimony analysis, with a CI of 0.825 (P£0.05), and a RI of 0.657; a strict consensus tree is shown in Figure 2. A g1 statistic of -1.05 indicated significant structure within the data (P£0.05). Nevertheless, resolution was incomplete: a trichotomy of Loeskeobryum, Hylocomiastrum, and the Rhytidiopsis clade remained unresolved (Figure 2). Six nodes were strongly supported with significant bootstrap values: the Hylocomiaceae (75%); Loeskeobryum (100%); Hylocomiastrum (84%); the clade of Rhytidium, Neodolichomitra, and Thelia (73%); the clade of Neodolichomitra and Thelia (98%); and the clade


Chiang and Schaal — Evolution of a cpDNA noncoding spacer

of Thelia lescurii, T. asprella, and Neodolichomitra (70%).

Neighbor-joining analyses were conducted on the K2P distance matrix (Table 3). A tree was obtained (Figure 3), which mostly agreed with the organismal tree based on sequences of both nrITS and cpDNA atpB-rbcL spacer (Chiang, 1994), except for the position of Neodolichomitra. The organismal tree supported the monophyly of both Thelia [(T. hirtella, T. asperella), T. lescurii] and Neodolichomitra. In contrast, in the NJ tree, Neodolichomitra was nested in Thelia species as well as with parsimony analysis. Obviously, branches leading to Rhytidiopsis, T. hirtella, and T. lescurii were much shorter than the ones leading to their sister taxa. The topology of the NJ tree was not fully congruent with the parsimony trees. In the NJ tree, Rhytidium and Rhytidiopsis were more closely related to Hylocomiastrum instead of Thelia as indicated by the parsimony tree. As in the parsimony tree, the monophyly of the Hylocomiaceae and four other clades was significantly supported (Figure 3).

Discussion

Phylogeny Reconstruction

The monophyly of Hylocomiaceae was significantly supported. However, the cladistic analyses did not resolve the generic relationships completely or in a proper manner. Unexpectedly, the various analyses of the chloroplast spacer suggested a nested relationship between Neodolichomitra and Thelia, in contrast to the organismal tree (Chiang, 1994). The Wilcoxon signed-rank tests, with three characters favoring the NJ tree and two characters favoring the organismal tree (Ts = 6.00, P< 0.1, n. s.), indicated the difference to be non-significant. In contrast, 21 characters favored the parsimonious chloroplast tree, and none favored the organismal tree. A Ts statistic value of 0.00 (P£0.001) obtained from the sign-ranked tests indicated a significant difference between the two trees.

Based on the Wilcoxon sign-ranked tests, in this study, the NJ tree was found to be more congruent with the organismal tree than was the parsimony tree. Apparently,

Figure 2. Strict consensus tree obtained from PAUP on atpB-rbcL spacer sequence in the Hylocomiaceae, with bootstrap values at nodes.

Figure 3. NJ tree of the Hylocomiaceae based on atpB-rbcL spacer sequence, with bootstrap values at nodes.

Table 3. Kimura’s 2-parameter substitution rates between taxa of the Hylocomiaceae and outgroup taxa. Substitution rates (×10-4) in the upper-right matrix; standard errors (×10-4) in lower-left matrix.; taxa numbered as Table 2.

1 2 3 4 5 6 7 8 9 10 11 12 13

1 165 314 375 469 414 435 358 414 509 184 279 300

2 55 180 275 443 407 448 428 464 519 54 256 314

3 77 57 464 637 601 644 582 618 715 236 444 468

4 85 72 94 482 370 428 371 426 462 351 237 277

5 95 91 111 96 600 618 561 618 635 521 424 467

6 89 88 107 83 107 486 466 523 580 448 292 315

7 92 93 112 90 109 96 181 505 503 487 350 393

8 83 90 106 84 103 94 58 446 465 449 331 335

9 89 94 109 90 109 100 98 92 403 522 349 315

10 99 99 118 93 110 105 98 94 86 559 423 466

11 58 31 66 81 99 93 97 93 100 103 312 372

12 72 69 91 66 89 73 81 78 80 89 76 91

13 76 77 94 72 94 77 86 79 77 94 84 41


Botanical Bulletin of Academia Sinica, Vol. 41, 2000

the lack of congruence between the parsimony tree and the NJ tree (or the organismal tree) was caused by the taxa with shorter branches, including Rhytidiopsis and Thelia lescurii. Branch attraction (cf. Swofford et al., 1996) might have caused the erroneous placement of Rhytidiopsis and Rhytidium in the parsimony trees. That is, Rhytidiopsis and Rhytidium might have been artificially attracted to the Thelia clade.

Molecular Evolution

The numbers of nucleotide substitutions per site between the Hylocomiaceae and Pleurozium varied from 0.0237 to 0.0444 with an average of 0.0336. It is noteworthy that the rates of substitution of the noncoding atpB-rbcL spacer of mosses are much slower than in vascular plants. For example, the rate of nucleotide substitution is 0.0691 between maize and barley (Zurawski et al., 1984), and 0.027 among 15 Rubieae species (Manen and Natali, 1995).

One might expect that a noncoding region such as theatpB-rbcL spacer should evolve faster than a coding sequence, such as the rbcL gene, due to weaker functional constraints. For unknown reasons however, the evolution of the noncoding regions seems constrained in angiosperms (Zurawski et al., 1984) relative to the third codon position for rbcL. In Hylocomiaceae, the substitution rate for the chloroplast noncoding spacer (K = 0.012) appears to be much slower than that of the third (K = 0.135), as well as the first (K = 0.0360) and second (K = 0.0190) codon positions for rbcL between barley and maize (Bousquet et al., 1992b). Undoubtedly, the evolutionary history of the Hylocomiaceae is much longer than that between barley and maize, which results in much lower rates of substitution per year. Similar observations have been made in the Rubieae (Manen and Natali, 1995), for which the evolutionary rate of the atpB-rbcL spacer (K = 0.027) was close to that of rbcL gene (K = 0.021).

Among the taxa analyzed, the chloroplast spacers of Thelia hirtella, T. lescurii, and Rhytidiopsis robusta

evolved relatively slowly. When pairwise relative rate tests were conducted using Pleurozium as a reference species, most lineages fit the hypothesis of a molecular clock, except for the above three species (Table 4).

In a previous study (Chiang, 1994), the evolutionary rate of the chloroplast atpB-rbcL spacer in true mosses was estimated to be 2.24 ± 0.039 ×10⁻¹⁰ substitutions per site per year. Based on the molecular clock hypothesis and the average rate of nucleotide substitutions (K = 0.013), which was recalculated with exclusion of the above three slowly evolving taxa (cf. Savard et al., 1994), the divergence of Hylocomiaceae from their common ancestor could be estimated at 29 million years ago. Usually, molecular clock divergence dates are expected to precede, more or less slightly, dates derived from the fossil record because gene divergence precedes morphological divergence and because the diverging phylla have to become ecologically quite abundant before being detected in fossilized sediment strata (Savard et al., 1994). In this study, the divergence estimated from the molecular clock also preceded the earliest fossil records of this family (23 million years ago; Miller, 1984).

Despite its slow evolutionary rate, the atpB-rbcL spacer did provide information to resolve the phylogeny at generic and lower levels. Natali et al. (1995) used this noncoding spacer to reconstruct the phylogeny of the tribe Rubieae, in which the monophyly of both the Rubieae and the subfamily Rubioideae was significantly supported. This noncoding spacer of chloroplast DNA has also been found informative in inferring the phylogeny of Betulaceae, which agreed with phylogenies derived from rbcL and morphological characters (Bousquet et al., 1992a). In our study, the monophyly of Hylocomiaceae was supported significantly based on bootstrap estimates, and variation was even detected between species. Although the generic relationships estimated from parsimony contradicted part of the organismal tree, the neighbor-joining analysis provided a more congruent estimate of the phylogeny.

Table 4. Relative rate differences between species pair (K13-K23; above diagonal) and the ratios of the relative rate differences to standard errors (below diagonal); taxa numbered as in Table 2. Pleurozium was used as outgroup taxon in all pairwise relative rate tests.

1 2 3 4 5 6 7 8 9 10 11

1 -0.0044 0.0089 0.0089 0.0129 0.0106 0.0089 0.0089 0.0010 0.0134 0.0050 2 0.00 0.0056 0.0067 0.0129 0.0112 0.0120 0.0117 0.0123 0.0146 0.0017 3 2.55* 3.11** -0.0123 0.0185 -0.0168 -0.0174 -0.0163 -0.0168 0.0200 -0.0012

4 0.00 0.00 2.16* 0.0134 0.0110 0.0123 0.0110 0.0120 0.0134 0.0089 5 2.07* 2.07* 0.00 2.07* -0.0174 -0.0140 0.0110 -0.0174 0.0185 -0.0150

6 0.92 1.80 1.09 0.92 1.09 0.0140 0.0140 0.0150 0.0174 -0.0123

7 1.55 1.31 0.73 1.31 0.80 0.39 -0.0050 -0.0150 0.0145 -0.0129

8 1.77 1.50 0.56 1.63 0.70 0.61 0.35 0.0129 0.0140 -0.0123

9 1.42 1.31 0.73 1.31 0.73 0.38 0.00 0.21 0.0120 -0.0140

10 2.30* 2.13* 0.18 2.30* 0.19 1.26 0.97 0.82 1.08 -0.0160

11 2.00* 1.70 1.51 0.77 1.36 0.22 0.62 0.86 0.60 0.94

*£0.05; **£0.01.


Chiang and Schaal — Evolution of a cpDNA noncoding spacer

Acknowledgments. We thank the curator of the Herbarium of the Missouri Botanical Garden, P. Redfearn, Z. Iwatsuki, and P. C. Wu for agreeing to provide valuable materials for DNA isolation. We are grateful to S. B. Hoot of the Field Museum of Natural History, Chicago, for suggesting the use of the atpB-rbcL spacer. We thank S. O’Kane for help with the computer search; A. Colwell and D. L. Nickrent for help with the relative rate test; and B. D. Mishler for advice and help on DNA extraction from mosses. We are grateful to R. Wyatt for his critical comments on our work. We are indebted to Profs. J. Bousquet and E. M. Golenberg and another anonymous reviewer for their valuable comments on our manuscript.

Literature Cited

Archie, J.W. 1989. Homoplasy excess ratios: new indices for measuring levels of homoplasy in phylogenetic systematics and a critique of the consistency index. Syst. Zool. 38: 253-269.

Bousquet, J., S.H. Strauss, and P. Li. 1992a. Complete congruence between morphological and rbcL-based molecular phylogenies in birches and related species (family Betulaceae). Mol. Biol. Evol. 9: 1076-1088.

Bousquet, J., S.H. Strauss, A.H. Doerksen, and R.A. Price. 1992b. Extensive variation in evolutionary rate of rbcL gene sequences among seed plants. Proc. Natl. Acad. Sci. USA 89: 7844-7848.

Chiang, T.Y. 1994. Molecular systematics of the Hylocomiaceae (Order Hypnales) inferred from DNA sequences of the internal transcribed spacers of ribosomal DNA and the atpB-rbcL noncoding spacers of chloroplast DNA. Ph.D. Dissertation, Department of Biology, St. Louis, Missouri.

Chiang, T.Y. 1995. Phylogeny and morphological evolution of Macrothamnium M. Fleisch. and related taxa (Bryopsida: Hypnaceae). Bot. Bull. Acad. Sin. 36: 143-154.

Chiang, T.Y., B.A. Schaal, and C.I. Peng. 1998. Universal primers for amplification and sequencing a noncoding spacer between atpB and rbcL genes of chloroplast DNA. Bot. Bull. Acad. Sin. 39: 245-250.

Efron, B. 1982. The jackknife, the bootstrap, and other resampling plans. Conf. Board Math. Sci. Soc. Ind. Appl. Math. 38: 1-92.

Farris, J.S. 1989. The retention index and homoplasy excess. Syst. Zool. 38: 406-407.

Felsenstein, J. 1985. Confidence limits on phylogenies: an approach using the bootstrap. Evolution 39: 783-791.

Golenberg, E.M., M. Clegg, M.L. Durbin, J. Doebley, and D.P. Ma. 1993. Evolution of a noncoding region of the chloroplast genome. Mol. Phylogenet. Evol. 2: 52-64.

Hedges, S.B. 1992. The number of replications needed for accurate estimation of the bootstrap P value in phylogenetic studies. Mol. Biol. Evol. 9: 366-369.

Higgins, D.G., A.J. Bleasby, and R. Fuchs. 1992. CLUSTAL V: improved software for multiple sequence alignment. Comput. Appl. Biosci. 8: 189-191.

Hillis, D.M. and J.J. Bull. 1993. An empirical test of bootstrapping as a method assessing confidence in phylogenetic analysis. Syst. Biol. 42: 182-192.

Hillis, D.M. and J.P. Huelsenbeck. 1992. Signal, noise, and reliability in molecular phylogenetic analyses. J. Hered. 83: 189-195.

Huelsenbeck, J.P. 1991. Tree-length distribution skewness: an indicator of phylogenetic information. Syst. Zool. 40: 257-270.

Klassen, G.J., R.D. Mooi, and A. Locke. 1991. Consistency indices and random data. Syst. Zool. 40: 446-457.

Kluge, A.G. and J.S. Farris. 1969. Quantitative phyletics and the evolution of anurans. Syst. Zool. 18: 1-32.

Kumar, S., K. Tamura, and M. Nei. 1993. MEGA: Molecular Evolutionary Genetics Analysis, version 1.01. The Pennsylvania State University, University Rark, PA 16802.

Li, W.H. 1997. Molecular Evolution. Sinauer, Sunderland, MA, USA.

Maddison, W.P. and D.R. Maddison. 1992. MacClade: analysis of phylogeny and character evolution, Version 3. Sinauer Associates, Massachusetts.

Manen, J. and A. Natali. 1995. Comparison of the evolution of ribulose-1, 5-biphosphate carboxylase (rbcL) and atpB-rbcL spacer sequences in a recent plant group, the tribe Rubieae (Rubiaceae). J. Mol. Biol. 41: 920-927.

Manen, J., A. Natali, and F. Ehrendorfer. 1994a. Phylogeny of Rubiaceae-Rubieae inferred from the sequence of a cpDNA intergene region. Pl. Syst. Evol. 190: 195-211.

Manen, J., V. Savolainen, and P. Simon. 1994b. The atpB and rbcL promoters in plastid DNAs of a wide dicot range. J. Mol. Evol. 38: 577-582.

Margush, T. and F.R. McMorris. 1981. Consensus n-trees. Bull. Math. Biol. 43: 239-244.

Miller, N.G. 1984. Tertiary and Quaternary fossils. In R.M. Schuster (ed.), New Manual of Bryology. The Hattori Botanical Laboratory, Nichinan, Japan, pp. 1194-1232.

Murray, M.G. and W.F. Thompson. 1980. Rapid isolation of high molecular weight DNA. Nucl. Acids Res. 8: 4321-4325.

Natali, A., J. Manen, and F. Ehrendorfer. 1995. Phylogeny of the Rubiaceae-Rubioideae, in particular the tribe Rubieae: evidence from a non-coding chloroplast DNA sequence. Ann. Missouri Bot. Gard. 82: 428-439.

Nishizawa, Y. and A. Hirai. 1987. Nucleotide sequence and expression of the gene for the large subunit of rice ribulose 1,5-bisphosphate carboxylase. Jap. J. Genet. 62: 223-229.

Rohrer, J.R. 1985. A generic revision of the Hylocomiaceae. J. Hattori Bot. Lab. 59: 241-278.

Sanger, F., S. Nicklen, and A.R. Coulson. 1977. DNA sequencing with chain-terminating inhibitors. Proc. Natl. Acad. Sci. USA 74: 5463-5467.

Sarich, V.M. and A.C. Wilson. 1973. Generation time and genomic evolution in primates. Science 179: 1144-1147.

Savard, L., P. Li. S.H. Strauss, M.W. Chase, M. Michaud, and J. Bousquet. 1994. Chloroplast and nuclear gene sequences indicate Late Pennsylvanian time for the last common ancestor of extant seed plants. Proc. Natl. Acad. Sci. USA 91: 5163-5167.

Savolainen, V., J.F. Manen, E. Douzery, and R. Spichiger. 1994. Molecular phylogeny of families related to Celastrales based on rbcL 5' flanking sequences. Mol. Phylogenet. Evol. 3: 27-37.

Shinozaki, K., M. Tanaka, T. Wakasugi, N. Hayashida, T. Matsubayashi, N. Zaita, J. Chunwongse, J. Obokata, K. Yamaguchi-Shinozaki, C. Ohto, K. Torazawa, B.Y. Meng, M. Sugita, H. Deno, T. Kamogashira, K. Yamada, J. Kusuda,


Botanical Bulletin of Academia Sinica, Vol. 41, 2000

F. Takaiwa, A. Kato, N. Tohdoh, H. Shimada, and M. Sugiura. 1986. The complete nucleotide sequence of tobacco chloroplast genome: its gene organization and expression. EMBO J. 5: 2043-2049.

Sokal, R.R. and F.J. Rohlf. 1981. Biometrics. W.-H. Freeman, San Francisco.

Swofford, D.L. 1991. When are phylogeny estimates from molecular and morphological data incongruent? In M.M. Miyamoto and J. Cracraft (eds.), Phylogenetic analysis of DNA sequences. Oxford University Press. New York, Oxford, pp. 295-333.

Swofford, D.L. 1993. PAUP: Phylogenetic Analysis Using Parsimony, Version 3.1.1. Computer program distributed by the Illinois Natural History Survey, Champaign, Illinois.

Templeton, A. 1983. Phylogenetic inference from restriction endonuclease cleavage site maps with particular reference to the evolution of humans and the apes. Evolution 37: 221-244.

Umesono, K., H. Inokuchi, Y. Shiki, M. Takeuchi, Z. Chang, H. Fujuzawa, T. Kochi, H. Shirai, K. Ohayama, and H. Ozeki. 1988. Structure and organization of Marchantia polymorpha chloroplast genome. II. Gene organization of the large copy region from rps’12 to atpB. J. Mol. Biol. 203: 299-331.

Wang, B., Q. Fang, W.V. Williams, and D.B. Weuber. 1992. Double-stranded DNA sequencing by linear amplification with Taq DNA polymerase. BioTech. 13: 527-529.

Wu, C.I. and W.H. Li. 1985. Evidence for higher rates of nucleotide substitution in rodents than in man. Proc. Natl. Acad. Sci. USA 82: 1741-1745.

Zuckerkandl, E. and L. Pauling. 1965. Evolutionary divergence and convergence in proteins. In V. Bryson and H.J. Vogel (eds.), Evolving genes and proteins. Academic Press, New York, pp. 97-166.

Zurawski, G., M.T. Clegg, and A.D.H. Brown. 1984. The nature of nucleotide sequence divergence between barley and maize chloroplast DNA. Genetics 106: 735-749.

¸­ºñÅé DNA ¤¶©ó atpB ¤Î rbcL °ò¦]¶¡ªº«DÂàĶ°Ï¶¡

¦b¶ðÄö¬ìªº¤À¤lºt¤Æ

½±Âí¦t1 Barbara A. Schaal2

1 °ê¥ß¦¨¥\¤j¾Ç¥Íª«¾Ç¨t
2 ¬ü°êµØ²±¹y¤j¾Ç¥Íª«¾Ç¨t

¥»¬ã¨s±´°Q¸­ºñÅé DNA ¤¤¤@­Ó¤¶©ó atpB ¤Î rbcL °ò¦]¶¡ªº«DÂàĶ°Ï¶¡¦b¶ðÄö¬ì´Óª«ªº¤À¤lºt¤Æ¡AºØ¶¡ªº¿ò¶ÇÅܲ§¤j¦h¨Ó¦Û®Ö ±Ò»Äªº¸m´«¡AÁöµM¤@­Ó 29 bp ªº´¡¤Jµo¥Í¦b Rhytidiopsis robusta, atpB-rbcL °ò¦]°Ï¶¡ªººt¤Æ³t²v¦b¶ðÄö¬ì¤¤¬Û¸û©ó³Q¤l´Óª«¤¤¡A©Î³Q¤l´Óª«ªº rbcL °ò¦]ÁÙ­n½wºC¡A®Ú¾Ú¬Û¹ï³t²v´úÅç¡A¦¹ DNA ¤ù¬qªººt¤Æ²Å¦X¤À¤l®ÉÄÁªº°²»¡¡C¨Ì¾Ú¦b¯uÄö´Óª«¤¤¤wª¾ªº¤À¤lºt¤Æ³t«×¡A¶ðÄö´Óª« ªº°_·½¥i¥H±À·¹¦Ü¤G¤d¤E¦Ê¸U¦~«e¡A¨Ã»P¤Æ¥ÛÃÒ¾Ú§k¦X¡C¦¹°ò¦]¤ù¬q¤ä«ù¶ðÄö¬ì´Óª«¬°¤@³æ¤@°_·½ªº¤ÀÃþ ¸s¡AµM¦Ó¡A¦b³Ì¤j²¬ù¤ÀªR¤¤¦]ªø¤ä§l¤Þ®ÄÀ³¡A¨Ï±o Rhytidiopsis ¤Î Rhytidium µo¥Í¿ù»~ªº¤ÀÃþ¡A¬Û¹ï¦a¡A¬Û¾F³s±µ¤ÀªRªk¦b­««Ø¿Ë½t¾ú¥v¤W¦³¸û¥i¾aªº¦ôºâ¡C

ÃöÁäµü¡GatpB-rbcL °ò¦]¶¡ªº°Ï¶¡¤ù¬q¡F¸­ºñÅé DNA¡F¤À¤l§Ç¦C¡F°ò¦]¾ð¡F¶ðÄö¬ì¡FªøªK§l¤Þ¡FÄöÃþ¡F¤À¤l®ÉÄÁ¡C