Bot. Bull. Acad. Sin. (2000) 41: 213-218

Kao et al. — C-13 of a subalpine forest

Vertical profiles of CO2 concentration and d13C values in a subalpine forest of Taiwan

Wen-Yuan Kao1, Yu-Shiun Chiu, and Wan-Hwa Chen

Institute of Botany, Academia Sinica, Taipei, Taiwan, Republic of China

(Received September 20, 1999; Accepted January 28, 2000)

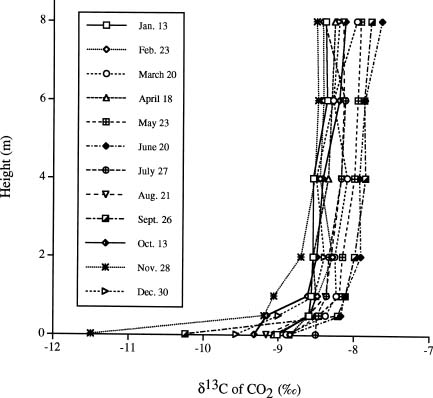
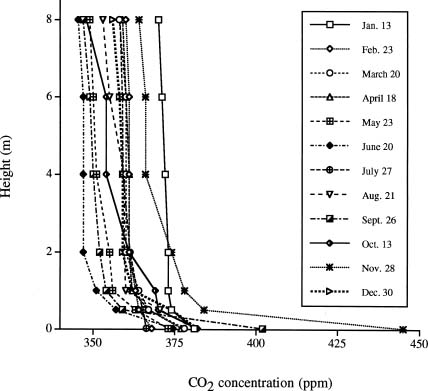
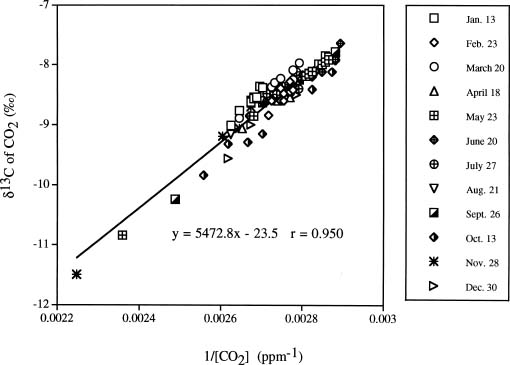
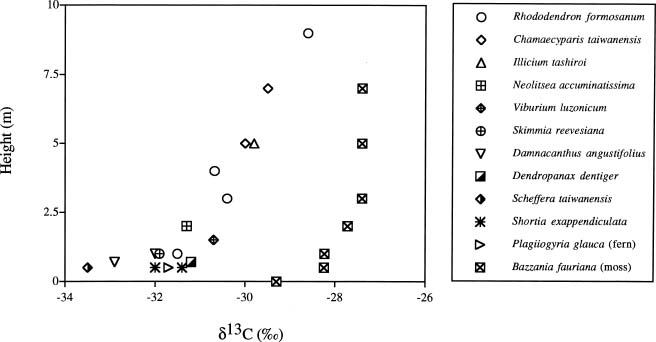
Abstract. We investigated the vertical gradients in CO2 concentration and stable carbon isotope ratio (d13Cco2) of the canopy air within a coniferous-hardwood, Chamaecyparis and Rhododendron dominated, subalpine forest in Taiwan. The stable carbon isotope ratio of vascular plants and a epiphytic bryophyte species (Bazzania fauriana) (d13Cleaf) from different heights within the forest were also analyzed. Results revealed that CO2 and d13Cco2 gradients did exist within the forest, with higher CO2 concentrations and more negative d13Cco2 values in air sampled from the lower canopy. The average vertical gradients in CO2 and d13Cco2 value of the CO2 of the 12 sampling dates were 28.5 ± 6.1 ppm and 1.3 ± 0.3‰, respectively. Seasonal patterns of the relationship between 1/[CO2] and the corresponding d13C were pronounced, with steady decreases in the slopes and increases in the intercepts found from January to August. A decreasing d13Cleaf with decreasing height was also measured in a bryophyte (ranging from -27.4 to -29.2‰), canopy and understory leaves (ranging from -28.6 to -33.5‰). It was estimated that photosynthetic physiology affected by microclimates within the forest contributed approximately 2.8‰ of variation of the vertical gradient of vascular plant d13C values.

Keywords: Bryophyte; CO2 ; Subalpine forest; Stable carbon isotope ratio.

Introduction

Forest ecosystems are an important carbon pool and have profound impacts on atmospheric CO2 concentrations. In particular, soil-respired CO2 in forests has been reported as a significant component in global carbon cycling (Woodwell et al., 1983). The CO2 released during respiration and decomposition may diffuse through the forest canopy into the atmosphere or a fraction of this CO2 may be reassimilated through photosynthesis by the forest ecosystem (Lloyd et al., 1996; Sternberg et al., 1989). Thus, there are two major sources of CO2 for photosynthesis within forests: one is from bulk air and the other from soil respiration.

Internal carbon fluxes within forest canopies and their interactions with soil and atmospheric exchange processes can be addressed using carbon isotopes. The mean value of atmospheric CO2 is currently -8‰ but varies seasonally in response to the patterns of photosynthesis and respiration (Conway et al., 1994; Mook et al., 1983). Photosynthesis discriminates against 13CO2, thus plants have a lighter carbon isotopic composition in their tissue in comparison to the atmospheric CO2. The respired CO2 derived from root respiration and decomposition of soil organic matter has a d13C value close to that of the organic matter of the dominant species in the forest community

(Flanagan et al., 1996). Accordingly, the two sources of CO2 within the forest canopy have different isotopic signals.

Vertical gradients in CO2 and d13C values have been studied in different forest ecosystems in different areas of the world. Turbulent mixing between the two sources of CO2 within the canopy and discrimination against 13CO2 during photosynthesis results in d13C of ratios of canopy air that are more depleted near the soil surface than at top of the canopy (Broadmeadow et al., 1992; Buchmann et al., 1997a,b; Flanagan et al., 1996; Francey et al., 1985; Quay et al., 1989; Sternberg, 1989; Van der Merwe and Medina, 1989). The range of the gradients depends on forest development, forest structure, and forest types (Buchmann et al., 1997b). To our knowledge, no similar study has been done in any forests of Taiwan. Since 1992, a long-term ecological study (LTER) has been set-up at a subalpine ecosystem within a natural preserve. The LTER study emphasizes the structure and function of the forest ecosystem as well as its carbon and nutrient flux. Understanding variations in the concentration and isotopic composition of CO2 within and above vegetation could provide insights into ecosystem functioning (Lloyd et al., 1996). In the present study, we investigated the profiles of CO2 concentration and d13C values of the canopy air and vegetation at different heights of the forest stand to understand processes related to carbon flux within the ecosystem. Stable carbon isotope ratios of vascular plants and a moss species (d13Cleaf) from different heights within the forest were also analyzed. The objectives of the present study were to understand: (1) whether a vertical profile in CO2

1Corresponding author. Phone: 886-2-27899590; Fax: 886-2-27827954; E-mail: bowykao@ccvax.sinica.edu.tw


Botanical Bulletin of Academia Sinica, Vol. 41, 2000

concentration and d13C of the subalpine forest ecosystem exists, what the relationship is between these two parameters, and how this compares with other ecosystems; (2) whether a vertical profile in leaf d13C of plants of different heights exists and what the causes of the variation are; and (3) whether there is a difference in leaf d13C between bryophyte and vascular plants within the forest ecosystem.

Materials and Methods

Study Site

The Yuanyang Lake Natural Preserve (N 24°35' and E 121°24') located in the northeastern part of Hsinchu County is one of five Long-term Ecological Research sites in Taiwan. It consists of coniferous forest, hardwood forest, pteridophytes, epiphytes (such as mosses and liverworts), grassland species and several aquatic plants (Chou et al., 2000). The vegetation of the study area, located in the preserve at an altitude of 1,670 m, is dominated by a mixture of Chamaecyparis formonensis, Chamaecyparis taiwanensis, and Rhododendron formosanum stands. The weather has been classified as temperate heavy moist (Liu and Hsu, 1973). The monthly mean air temperature ranged from 5 to 17.5°C from 1992 to 1995 (Hwang et al., 1996).

Air Sampling

A portable tower 8 m high was set up within a mixed forest of Chamaecyparis and Rhododendron stands. The leaf area index (LAI) of the forest stand was measured in July with a leaf area index meter (Li-2000, Li-Cor, Lincoln, Nebraska). Forest air samples were collected between 2 and 4 pm at 8, 5, 3, 1, 0.5 and 0.02 m above ground once a month throughout 1995. Air was pumped through a pre-evacuated 2L glass flask (with two high-vacuum stopcocks) at a flow rate of 20 ml s-1 for 20 min. CO2 coming out of the flask was measured with an IRGA (LI-6252, Licor, Lincoln, Nebraska), and then both stopcocks of the flask were closed. CO2 was extracted by cryogenic distillation at liquid nitrogen temperature. The purified CO2 samples were sealed with copper pellet in a 6 mm O.D. pyrex tube, then combusted at 500°C for an hour to avoid the interference of N2O (which has a molecular weight the same as CO2 and can't be separated from CO2 by the cryogenic distillation method). After combustion, samples were purified again through an ethanol-dry ice trap and a liquid nitrogen trap.

Organic Materials

Leaf samples of dominant (Chamaecyparis and Rhododendron) and understory species from different heights of the canopy were collected in July. A dominant moss species (Bazzania fauriana) growing epiphytically on the tree trunk at different heights of the canopy was also sampled. Litter and the top 10 cm of the soil were also collected. The samples were dried at 70°C in a oven for at least 48 h, then ground to a fine powder with a mor

tar and pestle. Two to three mg of grounded leaf material was sealed under vacuum with a 1 g copper oxide pellet and silver foil (2 × 10 mm) in a 6 mm O.D. quartz tubing, then combusted at 850°C for four hours. The resulting CO2 was purified through an ethanol-dry ice trap and a liquid nitrogen trap (Ehleringer and Osmond, 1989).

The isotopic composition of the carbon was measured with a Finnigan delta S mass spectrometer, and the result was expressed as a per mil (‰) deviation from the PDB standard d13C = {[(13C/12C)sample/(13C/12C) PDB]-1} × 1000.

Calculation of Carbon Isotope Discrimination and Ci/Ca for the Leaves

Carbon isotope discrimination (‰) of leaves of trees and understory species (Dp) was calculated using foliar d13C (dleaf in ‰) and dco2 (‰) by the following equation:

Dp = (dco2 - dleaf) / [1+ (dleaf/1000) ]

The ratio of long-term intercellular CO2 partial pressure (Ci) and ambient CO2 partial pressure (Ca) of leaves can be estimated from Dp by the following equation (Farquhar et al., 1989):

Dp = a + (b - a) × Ci/Ca,

where a is the discrimination during CO2 diffusion through the stomata and has been estimated to be 4.4‰ (O'Leary, 1988), and b is the isotope fractionation during carboxylation (approximately 27‰ by Farquhar and Richards, 1984).

Results

CO2 and d13C of Forest Air

The LAI of the forest stand measured in July was 3.7 m2 m-2. Carbon dioxide and d13Cco2 gradients existed within the forest stand, with higher CO2 concentrations and more negative d13Cco2 values in air sampled from the lower canopy (Figures 1 and 2). The average [CO2] at 8 and 0.02 m of the 12 sampling dates were 355.6 ± 2.1 and 384.2 ± 6.1 ppm (mean ± s.e.), respectively. And the average d13Cco2 value at 8 and 0.02 m of the 12 sampling dates were -8.1 ± 0.1 and -9.3‰, respectively. The largest vertical gradient in the concentration of CO2 was measured in November, the [CO2] ranged from 364 to 445 ppm, at 8 m and 0.02 m, respectively, and the corresponding d13Cco2 from -8.5 to -11.5‰. In contrast, the smallest vertical gradient was measured in February and July (Figure 1), the gradient in [CO2] was only 8 ppm. The average vertical gradient in CO2 and d13Cco2 value of the [CO2] of the 12 sampling dates were 28.5 ± 6.1 ppm and 1.3 ± 0.3‰ (mean ± s.e.), respectively.

There was also temporal variation in [CO2] and d13Cco2 of the forest air. The lowest and the highest CO2 concentrations of air sampled at 8 m were measured on June and January, 345 and 370 ppm, respectively (Figure 1). The most positive and negative values of d13Cco2 of air sampled at 8 m were analyzed in June (-7.6‰) and November (-8.5‰) (Figure 2). In comparison, the lowest and the highest CO2 concentrations of air sampled at 0.02 m were mea


Kao et al. — C-13 of a subalpine forest

Figure 1. Height profiles of CO2 concentrations within a mixed forest of Chamaecyparis and Rhododendron stands.

Figure 2. Height profiles of d13Cco2 within a mixed forest of Chamaecyparis and Rhododendron stands.

sponding d13C values was: d13Cco2 (‰) = 5472.8 × (1/[CO2]) - 23.5, r = 0.95 (Figure 3).

d13C of Vegetation, Litter and Soil

A vertical gradient in d13C values was measured in the moss species B. fauriana (Figure 4). The d13C of the moss became progressively more negative with decreasing height, ranging from -27.4‰ at 8 m to -29.2‰ at ground.

As with the moss species, a general trend appeared in the leaf d13C values of vascular plants: they tended to be more positive in upper canopy leaves and more negative in understory plants, and ranged from -28.6 to -33.5‰ (Figure 4). In comparison between B. fauriana and the vascular plants at the same height, the bryophyte always had more positive d13C values than the vascular plants.

sured in February and November, 368 and 445 ppm, respectively. And the most positive and negative values of d13Cco2 sampled at 0.02 m were analyzed in July (-8.5‰) and November (-11.5‰).

Relationship Between d13Cco2 and [CO2]

A significantly positive linear relationship was measured between 1/[CO2] and the corresponding d13C values for measurement taken in each month (Table 1). Seasonal patterns of the relationship were pronounced, with steady decreases in the slopes and increases in the intercepts found from January to August. However, the slopes increased and the intercepts decreased again from September to December. Combining data from the 12 sampling dates, the relationship between 1/[CO2] and the corre

Table 1. Linear regressions and coefficient of regression (r) between d13Cco2 and 1/[CO2] for a mixed forest of Chamaecyparis and Rhododendron stands throughout the 1995.

Month Regression r

January y = 7830 × x - 29.5 0.98

Febuary y = 6316 × x - 25.9 0.81

March y = 5193 × x - 22.6 0.95

April y = 5550 × x - 23.8 0.95

May y = 5770 × x - 24.4 0.99

June y = 4762 × x - 21.6 0.97

July y = 4889 × x - 21.8 0.89

August y = 4889 × x - 21.9 0.97

September y = 6077 × x - 25.2 0.99

October y = 5453 × x - 23.7 0.96

November y = 6151 × x - 25.3 0.99

December y = 6570 × x - 26.7 0.99

Figure 3. Relationship of the inverse of canopy CO2 concentrations and their corresponding d13Cco2 within a mixed forest of Chamaecyparis and Rhododendron stands.


Botanical Bulletin of Academia Sinica, Vol. 41, 2000

Figure 4. Vertical profile of leaf carbon isotope ratios (d13C) of a moss species (B. fauriana), understory vegetation and the dominant tree species within a mixed forest of Chamaecyparis and Rhododendron stands.

The d13C values of litter and soil were -28.2 ± 0.2 and -27.2 ± 0.2‰ (mean ± s.e., n = 8), respectively.

Calculation of Carbon Isotope Discrimination (Dp) and Ci/Ca for the Leaves

For the vascular plant species, carbon isotope discrimination in leaf (Dp) decreased with height (Figure 5). The carbon isotope discrimination in leaf varied from 21.5 to 24.3‰. As a result, the estimated Ci/Ca of leaves from different canopy heights also decreased with height and the ratio varied from 0.76 to 0.88 for leaves from 8 to 0.02 m.

Discussion

Few studies have analyzed the profiles of CO2 concentration and d13C values in tropical rain forests (Medina and Minchin, 1980; Medina et al., 1991) or in temperate forests (Broadmeadow, 1992; Buchmann et al., 1997b; Hanba et al., 1997). To our knowledge, this is the first study investigating the vertical profiles of CO2 and d13C values within a subalpine forest in Taiwan. However, results from this study reveal the subalpine forest to have the same vertical profiles of canopy [CO2] and d13C (Figures 1 and 2) as forests in other climatic zones. Only small differences in CO2 concentration were detected between 1 m and 8 m within the forest, indicating a high degree of mixing of the forest air above 1 m. However, the gradient between 1 m and ground level was mainly due to the mixing of atmospheric CO2 and soil respired CO2. Significant variations in the profile of CO2 and d13C values observed at different sampling dates implies temporal variation in the vertical profile.

The intercept of the linear relationship between 1/[CO2] and the corresponding d13Cco2 values represents the d13C of respired CO2 (Keeling, 1958) and can be used to estimate ecosystem discrimination against the heavier 13C during photosynthesis of the entire stand if the d13C value of tropospheric CO2 is also measured (Buchmann et al., 1997b). The slopes and the d13C values of the intercept (Table 1) of this study are similar to those measured in temperate deciduous and evergreen forests (Francy et al., 1985; Buchmann et al., 1997b). Without information in the d13C value of tropospheric CO2, we are unable to calculate the ecosystem discrimination. However, the steady increase in intercepts of the relationship represented increasing d13C values of respired CO2 of the forest ecosystem

Figure 5. Vertical profile of calculated carbon isotope discrimination in leaf (Dleaf) of understory vegetation and the dominant tree species within a mixed forest of Chamaecyparis and Rhododendron stands.


Kao et al. — C-13 of a subalpine forest

from January to August. Hardly any data sets exist that show seasonality in the isotopic signature of ecosystem respiration. Buchmann et al. (1997a) reported the intercept of the relationship measured in an Amazonian rainforest was close to the d13C of soil respired CO2 and to the d13C of litter and soil organic matter. Though we did not measure the d13C values of soil efflux CO2, the intercepts of the relationship of this study (except the measurement taken in January) are more positive than the d13C values of soil organic matter and litter. This could be due to discrimination against 13C during soil respiration, resulting in a d13C value of the soil respired CO2 that is more positive than that of the soil organic matter. A further study analyzing soil respired CO2 is necessary to understand if this is the reason for the discrepancy.

As in other studies (Medina and Minchin, 1980; Vogel, 1978), the present study also showed that leaves collected from lower canopy or understory plants within a subalpine forest ecosystem usually had a d13C value more negative than that of upper canopy leaves. Two factors might be responsible for these lower values. First, they might be due to the recycling of soil respired CO2, which is more negative than bulk atmospheric CO2 (Sternberg, 1989; Vogel, 1978). However, due to the effect of microclimates on photosynthetic gas exchange, the ratio of the intercellular CO2 to the ambient CO2 (Ci/Ca), and hence the leaf d13C values, would also be affected by changes in microclimates within the forest canopy. For example, Ehleringer et al. (1986) reported that low light intensity resulted in plants with a more negative d13C value. The contribution of physiological effect and the d13C of source air to the variation in vertical profile of leaf d13C can be separated by calculation of leaf carbon isotope discrimination (Dleaf) (Hanba et al., 1997). In this study, the variation in this discrimination was estimated at approximately 2.8‰ from 0.02 to 8 m within the forest canopy. This implies that approximately 2.8‰ of variation in the vertical profile of leaf d13C was due to the effect of the changing microclimate on the photosynthetic physiology. This result is in agreement with the study in a temperate Japanese forest by Hanba et al. (1997).

This is the first time that a bryophyte species was shown to have a gradient in d13C values similar to coexisting vascular plants. However, the bryophyte's d13C value was richer in 13C than those other plants. In addition, the analysis also indicates that the gradient in d13C of the bryophyte reflects the d13C of the canopy CO2 better than vascular plants. Due to the absence of stomata in the bryophyte, its photosynthesis might be less affected by the changing microclimates than that of the coexisting vascular plants within the forest. Hence it is possible that the gradient in d13C of bryophyte is mainly caused by the gradient of d13C of forest CO2.

Acknowledgement. We thank Kuo-Wei Chang for helping with field work. This study was supported by Academia Sinica, the Republic of China.

Literature Cited

Buchmann, N., J.-M. Guehl, T.S. Barigah, and J.R. Ehleringer. 1997a. Interseasonal comparison of CO2 concentrations, isotopic composition, and carbon dynamics in an Amazonian rainforest (French Guiana). Oecologia 110: 120-131.

Buchmann, N., W.-Y. Kao, and J.R. Ehleringer. 1997b. Influence of stand structure on carbon-13 of vegetation, soils, and canopy air within deciduous and evergreen forests in Utah, United States. Oecologia 110: 109-119.

Broadmeadow, M.S.J., H. Griffiths, C. Maxwell, and A.M. Borland. 1992. The carbon isotope ratio of plant organic material reflects temporal and spatial variation in CO2 within tropical forest formations in Trinidad. Oecologia 89: 435-441.

Chou, C.-H., T.-Y. Chen, C.-C. Liao, and C.-I. Peng. 2000. Long-term ecological research in the Yuanyang Lake forest ecosystem. I. Vegetation composition and analysis. Bot. Bull. Acad. Sin. 41: 61-72.

Conway, T.J., P.P. Tans, L.S. Waterman, K.W. Thoning, D.R. Kitzis, K.A. Masarie, and N. Zhang. 1994. Evidence for interannual variability of the carbon cycle from the National Oceanic and Atmospheric Administration/Climate Monitoring and Diagnosis Laboratory Global Air Sampling Network. J. Geophys. Res. 99: 22831-22855.

Ehleringer, J.R. and C.B. Osmond. 1989. Stable isotopes. In R.W. Pearcy, J. Ehleringer, H.A. Mooney, and P.W. Rundel (eds.), Plant Physiological Ecology. Field Methods and Instrumentation. Chapman and Hall, New York, pp. 281-290.

Ehleringer, J.R., C.B. Field, Z.F. Lin, and C.Y. Kuo. 1986. Leaf carbon isotope and mineral composition in subtropical plants along an irradiance cline. Oecologia 70: 520-526.

Farquhar, G.D. and R.A. Richards. 1984. Isotopic composition of plant carbon correlates with water-use efficiency of wheat genotypes. Aust. J. Plant Physiol. 11: 539-552.

Flanagan, L.B., J.R. Brooks, G.T. Varney, S.C. Berry, and J.R. Ehleringer. 1996. Carbon isotope discrimination during photosynthesis and the isotope ratio of respired CO2 in boreal forest ecosystems. Global Biogeochem. Cycles 10: 629-640.

Francey, R.J., R.M. Gifford, T.D. Sharkey, and B. Weir. 1985. Physiological influences on carbon isotope discrimination in huon pine (Lagarostrobus franklinii). Oecologia 66: 211-218.

Hanba, Y.T., S. Mori, T.T. Lei, T. Koike, and E. Wada. 1997. Variations in leaf d13C along a vertical profile of irradiance in a temperate Japanese forest. Oecologia 110: 253-261.

Hwang, Y.H., C.W. Fan, and M.H. Yin. 1996. Primary production and chemical composition of emergent aquatic macrophytes, Schoenoplectus mucronatus ssp. robustus and Sparganium fallax, in Lake Yuanyang, Taiwan. Bot. Bull. Acad. Sin. 37: 265-273.

Keeling, C.D. 1958. The concentration and isotopic abundances of atmospheric carbon dioxide in rural areas. Geochim. Cosmochim. Acta 13: 322-334.

Lloyd, J., B. Kruijt, D. Y. Hollinger, J. Grace, R. J. Francey, S.-C. Wong, F.M. Kelliher, A.C. Miranda, G.D. Farquhar, J.H.C. Gash, N.N. Vygodskaya, I.R. Wright, H.S. Miranda, and E.-D. Schulze. 1996. Vegetation effects on the isotopic composition of atmospheric CO2 at local and regional scales: theoretical aspects and a comparison between rain


Botanical Bulletin of Academia Sinica, Vol. 41, 2000

forest in Amazonia and a boreal forest in Siberia. Aust. J. Plant Physiol. 23: 371-399.

Liu, T. and K. S. Hsu. 1973. Ecological study of Yuan-yang Lake Natural Area Reserve. Bull. Taiwan Forest Res. Inst. No. 237.

Medina, E. and P. Minchin. 1980. Stratification of d13C values of leaves in Amazonian rainforests. Oecologia 45: 355-378.

Medina, E., L. Sternberg, and E. Cuevas. 1991. Vertical stratification of d13C values in closed and natural plantation forests in the Luquillo mountains, Puerto Rico. Oecologia 87: 369-372.

Mook, W.G., M. Koopmans, A.F. Carter, and C.D. Keeling. 1983. Seasonal, latitudinal, and secular variations in the abundance of isotopic ratios of atmospheric carbon dioxide. 1. Results from land stations. J. Geophys. Res. 88: 10915-10933.

O'Leary, M.H. 1988. Carbon isotopes in photosynthesis. Bioscience 38: 328-336.

Quay, P., S. King, D. Wilbur, and S. Wofsy. 1989. 13C/12C of atmospheric CO2 in the Amazon Basin: Forests and river sources. J. Geophys. Res. 94: 18327-18336.

Sternberg, L.S.L., S.S. Mulkey, and S.J. Wright. 1989. Ecological interpretation of leaf isotope ratios: influence of respired carbon dioxide. Ecology 70: 1317-1324.

Sternberg, L.S.L. 1989. A model to estimate carbon dioxide recycling in forests using 13C/12C ratios and concentrations of ambient carbon dioxide. Agr. For. Meteor. 48: 163-173.

Van der Merwe, N.J. and E. Medina. 1989. Photosynthesis and 13C/12C ratios in Amazonian rain forests. Geochim. Cosmochim. Acta 53: 1091-1094.

Vogel, J.C. 1978. Recycling of carbon in a forest environment. Oecol. Plant. 13: 89-94.

Woodwell, G.M., J.E. Hobbie, R. A. Houghton, J.M. Mellilo, B. Moore, B.J. Peterson, and G.R. Shaver. 1983. Global deforestation: contribution to atmospheric carbon dioxide. Science 222: 1081-1086.

¥xÆW¨È°ª¤s±a´ËªL¤º¤G®ñ¤ÆºÒ¿@«×©Mí©w©ÊºÒ¦P¦ì¯À
¤ñ­È¤§±´°Q

°ª¤å´D ªô·¶³Ô ³¯°ûµØ

¤¤¥¡¬ã¨s°|´Óª«¬ã¨s©Ò

¥»¤å±´°Q¥xÆW¤@¨È°ª¤s±a´ËªL¡]¦ì©óÀpÀm´ò¥ÍºA«O¯d°Ï¡^¤º¤G®ñ¤ÆºÒ¿@«×©M¨äí©w©ÊºÒ¦P¦ì¯À¤ñ ­È¡]d13Cco2¡^¤§««ª½ÅܤơF¨Ã¤ñ¸û´ËªL¤º¤£¦P°ª«×¤§ºûºÞ§ô´Óª«©M¤@ªþ¥Í­aÄö´ÓÅ餧ºÒ¦P¦ì¯À¤ñ­È (d13Cleaf)¡C¥Øªº¦b¤F¸Ñ¦¹´ËªL¥ÍºA¨t¤º¤§ºÒ³q¶q¡A¨Ã´£¨Ñ«Ø¥ß¥þ²yºÒ´`Àô¼Ò¦¡¤§°Ï°ì©Ê°ò¥»¸ê®Æ¡C¦b 1995 ¦~¶¡¡A¨C­Ó¤ë´ú¶q´ËªL¤º¤£¦P°ª«×¤§¤G®ñ¤ÆºÒ¿@«×¨Ã¤ÀªR¨äí©w©ÊºÒ¦P¦ì¯À¤ñ­È¡Cµ²ªGÅã¥Ü¡G ªL¤º·U±µªñ¦a­±¤§ªÅ®ð¡A CO2 ¿@«×·U°ª¡A¦P®É¨ä d13Cco2 ¤ñ­È¤]·U­t¡C¨C­Ó¤ë©Ò´ú±oªºªL¤º¤G®ñ¤ÆºÒ ¿@«×­Ë¼Æ©M¨ä¬Û¹ï¤§ d13Cco2 ¤ñ­È§e²{¤@ÅãµÛ½u©Ê¥¿¬ÛÃö¡F¦¹½u©Ê¥¿¬ÛÃöªººI¶Z¨ã©u¸`©ÊÅܤơAªí¥Ü ¨t²Î¤º©I§l§@¥Î¦³©u¸`©ÊÅܤơCºî¦X 1995 ¦~¾ã¦~¤§´ú¶q¡A±o¨ìªº½u©Ê¥¿¬ÛÃö¬°¡G d13Cco2 = 5472.8 × (1/[CO2]) - 23.5, r = 0.95¡C±Ä¦ÛªL¤º¤£¦P°ª«×¤§ºûºÞ§ô´Óª«©M­aÄö¤§ d13Cleaf ¤]§e²{©MªL¤º CO2 ¤§ d13Cco2 ¬Û¦PÁͶաC¦¹¥~¡A­aÄö´Óª«¤§ d13Cleaf ­È¡]-27.4 ¨ì -29.2‰¡^¸ûºûºÞ§ô´Óª«¤§ d13Cleaf ­È (-28.6 ¨ì -33.5‰) ¬°¥¿¡C¤å¤¤¨Ã°Q½×¼vÅT­aÄö©MºûºÞ§ô´Óª«ºÒ¦P¦ì¯À¤ñ­È®t²§¤§¥i¯à¾÷¨î¡C

ÃöÁäµü¡G ÀpÀm´ò¥ÍºA¨t¡F¨È°ª¤s±a´ËªL¡F¤G®ñ¤ÆºÒ¡Fí©w©ÊºÒ¦P¦ì¯À¤ñ­È¡F­aÄö¡C