Bot. Bull. Acad. Sin. (2001) 42: 45-52

Lin et al. — Host cell death induced by the c2 mutant of f1

Mechanism of host cell death induced by infection of Escherichia coli with the c2 clear-plaque mutant of phage f1

Shan-Hua Lin1, Wen-Ping Chen2, and Tsong-Teh Kuo1,2,*

1Institute of Molecular Biology, Academia Sinica, Nankang, Taipei 11529, Taiwan, Republic of China

2Department of Botany, National Taiwan University, Taipei, Taiwan, Republic of China

(Received September 17, 1999; Accepted August 7, 2000)

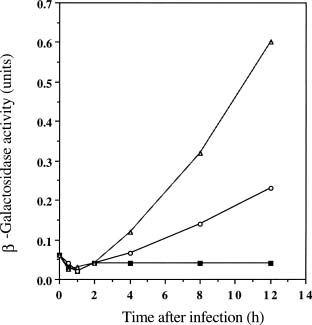
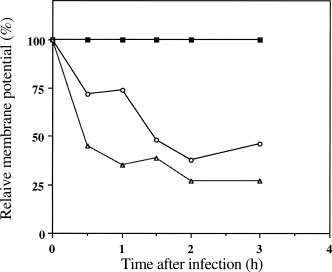
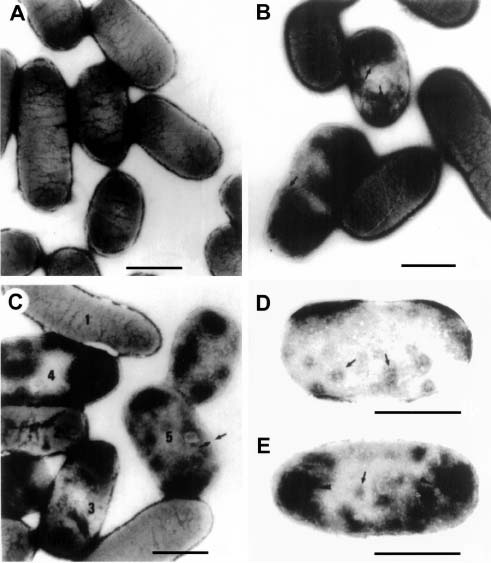
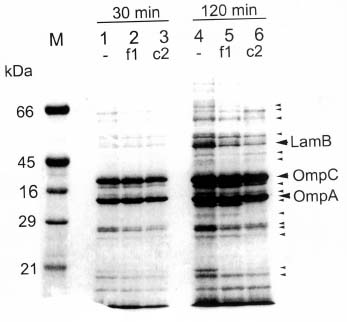
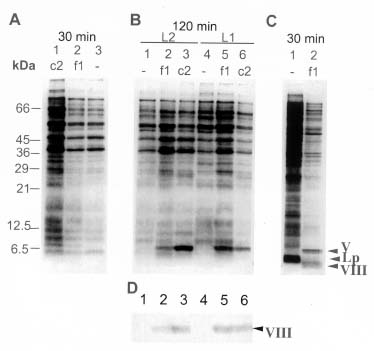
Abstract. The c2 clear-plaque mutant arose spontaneously from the turbid plaque-inducing wild-type strain of bacteriophage f1. The mechanism of host cell death induced by infection of Escherichia coli with c2 has now been investigated. A marked decrease in cell membrane potential was apparent as early as 30 min after infection with c2, and leakage of cell contents was apparent after 4 h. Transmission electron microscopy also revealed the accumulation of granular membrane-like structures within cells at early stages of c2 infection. Electrophoretic analysis showed that the abundance of several bacterial outer membrane proteins was markedly reduced 2 h after infection with c2. Furthermore, substantial amounts of the phage coat protein (gpVIII) and single-stranded DNA-binding protein (gpV) were apparent in the inner membrane of c2-infected cells 2 h after infection. These data support the hypothesis that the death of c2-infected cells results from phage-induced damage to the bacterial cell membrane.

Keywords: Cell death; Clear plaque; Escherichia coli; Filamentous phage f1.

Introduction

Escherichia coli infected with the bacteriophage f1 continues to grow and divide, although at a slower rate than that of uninfected bacteria (Marvin and Hohn, 1969). In contrast, infection of nonpermissive bacteria with f1 mutants containing amber mutations in certain of the eight phage genes results in a marked decrease in cellular DNA, RNA, and protein synthesis (Hohn et al., 1971a,b) and in the cessation of cell division (Pratt et al., 1966). Furthermore, such mutants increase cell membrane permeability as well as induce leakage of cell contents and cell death at early stages of infection (Hohn et al., 1971a,b). Electron microscopy has revealed that absorptive infection of E. coli with f1 mutants containing amber mutations in genes I, III, IV, V, or VI results in the accumulation of multiple folded membranous structures within the bacteria, especially at the two poles of the cell (Schwartz and Zinder, 1967; Ohnighi, 1971). These changes induced in bacteria by f1 mutants result from the accumulation of large amounts of the gene VIII-encoded protein. Thus, infection of host cells with gene VIII amber mutants does not induce such changes in the structure of cell membranes (Woolford et al., 1974).

We previously isolated a spontaneous mutant, c2, of wild-type f1 that exhibits a clear-plaque phenotype (Kuo et al., 2000). Infection with this mutant results in the synthesis of increased amounts of both phage DNA and gpII compared with those apparent in cells infected with wild-

type f1 (Chen, 1980). We have now investigated the time courses of the various changes in bacterial cell morphology and physiology induced by infection with c2 in order to shed light on the mechanism of host cell death.

Materials and Methods

Preparation of Phage-Infected Bacterial Cultures

Escherichia coli K38 and wild-type phage f1 were obtained from Dr. N. D. Zinder of Rockefeller University. The clear-plaque mutant c2 arose spontaneously from wild-type f1. The bacteria were grown to log phase at 37°C in LB medium with shaking. Phage were harvested from the supernatant of bacterial cultures that had been incubated for ~6 to 10 h after infection at a phage multiplicity of 10.

For the assay of b-galactosidase activity, the bacteria were grown in LB medium containing 1 mM isopropyl-b-D-thiogalactopyranoside. Bacterial cultures at a density of ~1 × 10⁸ to 5 × 10⁸ cells/ml were infected with phage at a multiplicity of 10. When indicated, chloramphenicol was added to the phage-infected cultures at a final concentration of 30 µg/ml at 0, 40, 90, or 360 min after infection.

Assay of b-Galactosidase Activity

The activity of b-galactosidase was assayed as described by Miller, 1971. The amounts of cellular and extracellular enzyme activity were determined by first separating bacterial cultures into a bacterial pellet and the culture supernatant by centrifugation at 10,000 g for 5 min. Portions (1 ml) of the supernatant and resuspended bacterial pellet were incubated at 20°C for 5 min prior to the addition of 50 µl of o-nitrophenyl-b-D-galactoside (4 mg/

*Corresponding author. Tel: +886-2-27899213; Fax: +886-2-27826085; E-mail: tehkuo@sinica.edu.tw


Botanical Bulletin of Academia Sinica, Vol. 42, 2001

ml). After further incubation for 1 min, the reaction was terminated by adding 0.5 ml of 1 M Na2CO3 and the absorbency at 420 nm (A420) was determined. A unit of enzyme activity was defined as A420 units per milliliter of sample per minute per unit of culture optical density at 600 nm (OD600).

Determination of Cell Membrane Potential by Proline Transport Assay

Cell membrane potential was measured as described (Goessens et al., 1988). Bacterial cells present in samples of phage-infected cultures were washed twice and suspended at an OD600 of 2 in 50 mM potassium phosphate buffer (pH 7.0). A portion (100 µl) of the suspension was then added to 200 µl of test solution [50 mM potassium phosphate, 10 mM MgSO4, and chloramphenicol (80 µg/ml)] and incubated at 37°C with shaking for 10 min. After addition of D-lactate to a final concentration of 10 mM and incubation at 28°C for an additional 10 min, 1 µCi of [3H]proline (20 to 40 Ci/mmol) was added to initiate the reaction. The reaction was stopped after incubation at 28oC for 1 min by filtration through a 0.45-µm Millipore HA filter. The filter was then washed with 100 mM LiCl, after which the amount of filter-associated radioactivity was determined by scintillation counting with Econofluor (DuPont).

Transmission Electron Microscopy

Bacterial cells were harvested from phage-infected cultures (~1.5 to 3.0 ml) by centrifugation and washed twice with ice-cold buffer A [60 mM K2HPO4, 33 mM KH2PO4, 7.5 mM (NH4) 2SO4, 2 mM sodium citrate]. The bacteria were resuspended at a density of ~1 × 10¹¹ cells/ml in ice-cold buffer A, stored on ice, stained with 2% (w/v) phosphotungstic acid, and examined with a 75-kV Hitachi H-600 electron microscope.

In vivo Labeling of Newly Synthesized Protein

Newly synthesized protein was labeled in vivo as described by Fulford and Model, 1988. A portion (0.2 ml) of bacterial culture in M9gB1 medium was incubated for 3 min at 37°C with 100 µCi of [35S]methionine (600 Ci/mmol). The reaction was stopped by addition of 1 ml of 10% (w/v) trichloroacetic acid, and the protein precipitate was then collected by centrifugation, washed, and analyzed by gel electrophoresis.

Isolation of Outer and Inner Bacterial Membranes

Bacterial cell membranes were isolated as described (Ito et al., 1977). Bacteria were harvested by centrifugation and then lysed by exposure to lysozyme and sonication. Undisrupted cells were removed by centrifugation at 2,000 g for 10 min. The membranes in the resulting supernatant were isolated by centrifugation through 15 and 70% (w/v) sucrose layers at 50,000 g for 1 h. The inner and outer cell membranes were then separated by centrifugation through layers of 53 and 70% (w/v) sucrose at 50,000 g

for 6 h. The outer membrane fraction was collected from the bottom of the sucrose gradient, and the inner membranes, separated into upper (L1) and lower (L2) fractions, were collected from the top of the gradient. Proteins in each of these membrane fractions were precipitated by 5% trichloroacetic acid, washed with acetone, and analyzed by gel electrophoresis.

Gel Electrophoresis and Immunoblot Analysis

Proteins were fractionated by polyacrylamide gel electrophoresis (PAGE) in gels containing 11% polyacrylamide/4 M urea or 19.25% polyacrylamide/7 M urea essentially as described (Ito et al., 1977). For detection of the phage coat protein (gpVIII), immunoblot analysis was performed as described by Yen and Webster, 1982. After electrophoresis, the separated proteins were blotted onto a nitrocellulose membrane by the semidry transfer method and incubated with antiserum to phage f1 (1:5000 dilution) (obtained from Dr. N. D. Zinder of Rockefeller University). Immune complexes were detected with alkaline phosphatase-conjugated antibodies to rabbit immunoglobulin G (Promega, Madison, WI) and stained with 5-bromo-4-chloro-3-indolyl phosphate and nitro blue tetrazolium. If necessary, bands on the gel or nitrocellulose membrane were counted by densitometer (Molecular Dynamics, ImageQuantTMv2.0).

Results

Leakage of b-galactosidase induced by c2 infection

To monitor the leakage of cell contents induced by c2 infection, we measured extracellular b-galactosidase activity (Figure 1). Leakage of b-galactosidase from cells infected with either c2 or wild-type f1 was first apparent 4 h after infection and subsequently increased in a time-dependent manner. The extracellular b-galactosidase activity in c2-infected was twice that of f1-infected and threefold that of uninfected. At 12 h postinfection, the extracellular b-galactosidase activity of c2-infected cells was threefold that of f1-infected cells and 15-fold that of uninfected cells. However, the leakage from c2-infected cells was markedly greater than that from bacteria infected with wild-type f1.

To determine the point after which leakage of b-galactosidase could not be prevented by exposure of c2-infected cells to chloramphenicol, we added the antibiotic to cultures at various times after infection to block phage growth and measured the cellular and extracellular activities of b-galactosidase 8 h after infection. Extracellular b-galactosidase activity was then expressed as a percentage of total (extracellular plus cellular) activity. The enzyme activity in the culture medium before infection was 1.47%, and that in medium of uninfected cells after incubation for 8 h in the absence or presence of chloramphenicol was 1.33 and 1.11%, respectively. Cultures of c2-infected cells in which chloramphenicol was


Lin et al. — Host cell death induced by the c2 mutant of f1

added 0, 40, 90, or 360 min after infection yielded extracellular b-galactosidase activities of 1.17, 1.50, 4.11, and 5.07%, respectively. Thus, chloramphenicol was able to prevent the leakage of b-galactosidase when added to cultures of c2-infected cells up to 40 min postinfection.

Loss of Cell Membrane Potential Induced at an Early Stage of c2 Infection

The transport of [3H]proline across the cell membrane is dependent on the membrane potential and requires an intact membrane structure (1). We therefore measured [3H]proline transport as a means of detecting cell membrane damage that is not associated with the leakage of cell contents. The membrane potential of cells infected with either c2 or wild-type f1 was markedly reduced by 55% and 28% at 30 min after infection. The loss of membrane potential reached a maximum of 73% and 62 % until 2 h after c2 or f1 infection (Figure 2). However, the rate and extent of the decrease in membrane potential in c2-infected cells were greater than those in cells infected with wild-type f1.

Morphological Changes in Phage-Infected Cells

Changes in morphology of bacterial cells induced by phage infection were examined by transmission electron microscopy. Comparison of uninfected cells (Figure 3A) with infected cells either 4 h (Figure 3, B and C) or 1 h (Figure 3, D and E) after infection revealed the presence of membrane-like structures within both f1- and c2-infected cells. However, whereas the structures in f1-infected cells consisted of multiple folded membranes located at the polar regions of the cell (Figure 3, B and E, indicated by arrows), those in c2-infected cells were granular or globular in nature and randomly distributed throughout the cell (Figure 3, C and D). The processes of cell damage caused by c2-infection are shown by numbers 1~5 (Figure 3C). The inner and outer membranes were separated in c2-infected cells showing pronounced accumulation of intracellular membranes (Figure 3C, 5, indicated by arrows), but cell lysis was not apparent 4 h after c2 infection.

Loss of Outer Membrane Proteins Induced by c2 Infection

Outer membrane proteins of phage-infected cells were analyzed 30 and 120 min postinfection by SDS-PAGE in gels containing urea (Figure 4). The major outer membrane proteins, LamB (48 kDa), OmpC (39 kDa), and OmpA (33 kDa) were indicated by large arrowheads. At 30 min after infection, no significant differences in the pattern of protein expression were apparent among uninfected cells and cells infected with c2 or with wild-type f1 (Figure 4, lanes 1~3). However, at 120 min after infection, the abundance of several outer membrane proteins was reduced in cells infected with either c2 or wild-type f1 (Figure 4, lanes 4~6, indicated by small arrowheads), and this effect was more pronounced in the c2-infected cells. LamB, the receptor of l phage, was also reduced by f1 or c2-infection (Figure 4, lanes 4~6).

Figure 1. Leakage of b-galactosidase from phage-infected cells. Host cell cultures (30 ml) were infected at a phage multiplicity of 10 with either wild-type f1 (open circles) or the clear-plaque mutant c2 (open triangles). Samples (1.5 ml) of the cultures were collected at the indicated times after infection, and the bacterial cells were removed by centrifugation. A portion (1 ml) of the resulting supernatant was then assayed for b-galactosidase activity. A culture of uninfected cells (closed squares) was analyzed in a similar manner. Data are expressed in units of enzyme activity and are means of triplicates from an experiment that was performed three times with similar results.

Figure 2. Loss of membrane potential in phage-infected cells. At the indicated times after infection with c2 (open triangles) or wild-type f1 (open circles), equal numbers of bacterial cells were assayed for [3H]proline transport as a marker of cell membrane potential. Uninfected cells (closed squares) were similarly analyzed. Data are expressed as a percentage of the membrane potential of uninfected cells at each time point, and are means of triplicates from an experiment that was performed three times with similar results.


Botanical Bulletin of Academia Sinica, Vol. 42, 2001

Figure 3. Transmission electron microscopy of intracellular membrane-like structures in phage-infected cells. Uninfected cells (A), cells infected with wild-type f1 (B) or c2 (C) 4 h postinfection, and cells infected with c2 (D) or wild-type f1 (E) 1 h postinfection were examined. Arrows in B, D, and E indicate membrane-like structures. Numbers labeled 1~5 in C indicate the process of cell damage caused by phage c2 infection. Bars represent 1 µ.


Lin et al. — Host cell death induced by the c2 mutant of f1

Accumulation of Phage Proteins gpV and gpVIII in the Inner Membrane

We also analyzed the inner membrane proteins of cells infected with c2 or wild-type f1 at 30 and 120 min postinfection (Figure 5, A and B). For comparison, newly synthesized proteins of uninfected cells and cells infected with wild-type f1 (30 min postinfection) were labeled with [35S]methionine and similarly analyzed by 19.25% SDS-PAGE in the presence of 7M urea (Figure 5C). At 30 min postinfection, small amounts of the phage single-stranded DNA-binding protein (gpV) were apparent in the inner membrane of cells infected with c2 or with wild-type f1 (Figure 5A, lanes 1 and 2). At 120 min after infection, the amount of gpV in the L2 inner membrane fraction of c2-infected cells was tenfold that in the corresponding fraction from cells infected with wild-type f1 (Figure 5B, lanes 2 and 3); or twofold that in the L1 fraction of cells infected with f1 or c2 (Figure 5B, lanes 5 and 6).

Because the phage protein gpVIII was difficult to detect by Coomassie blue staining, we examined the expression of this protein by immunoblot analysis with the

antiserum to f1 (Figure 5D). At 120 min postinfection, the amount of gpVIII in the L2 inner membrane fraction of c2-infected cells (Figure 5D, lane 2) was threefold that in the L2 fraction of cells infected with wild-type f1 (Figure 5D, lane 3), while the amount of gpV in the L1 inner membrane fraction was similar for cells infected with c2 or wild-type f1 (Figure 5D, lanes 5 and 6).

Discussion

In the present study, measurement of cell membrane potential revealed that damage to the membrane of phage-infected cells was apparent 30 min postinfection and that the extent of this damage was greater in c2-infected cells than in cells infected with wild-type f1. Leakage of b-galactosidase from infected cells was first detected 4 h after infection and, again, the leakage was more pronounced in c2-infected cells than in cells infected with wild-type f1. The leakage of b-galactosidase was prevented by addition of chloramphenicol to cultures of c2-infected cells at the early stage of infection (up to 40 min) and also in f1-infected couture (data not shown). Chloramphenicol has

Figure 4. Loss of outer membrane proteins in phage-infected cells. Outer membrane proteins of cells infected with wild-type f1 (lanes 2 and 5) or with c2 (lanes 3 and 6) were analyzed by SDS-PAGE on an 11% polyacrylamide gel containing 4 M urea at 30 min (lanes 2 and 3) and 120 min (lanes 5 and 6) after infection. Uninfected cells were similarly analyzed (lanes 1 and 4). Lane M contains molecular size standards (in kilodaltons). The gel was stained with Coomassie blue. The large arrowheads indicate the major outer membrane proteins OmpC (39 kDa) and OmpA (33 kDa) as well as the LamB receptor for phage l (48 kDa); small arrowheads indicate other outer membrane proteins, the abundance of which is reduced in phage-infected cells.


Botanical Bulletin of Academia Sinica, Vol. 42, 2001

Figure 5. Accumulation of phage proteins, gpV and gpVIII, in the inner membrane of infected cells. (A) The combined L1 and L2 inner membrane fractions of cells infected with c2 (lane 1) or with wild-type f1 (lane 2) were analyzed 30 min postinfection by 19.25% polyacrylamide gel in the presence of 7 M urea. The corresponding fractions from uninfected cells were similarly analyzed (lane 3). The gel was stained with Coomassie blue. (B) The L1 (lanes 4 to 6) and L2 (lanes 1 to 3) inner membrane fractions of cells infected with wild-type f1 (lanes 2 and 5) or with c2 (lanes 3 and 6) were analyzed separately 120 min postinfection as in (A). The corresponding fractions from uninfected cells were similarly analyzed (lanes 1 and 4). (C) Autoradiogram of newly synthesized proteins labeled with [35S]methionine in unfractionated lysates of uninfected cells (lane 1) or cells infected with wild-type f1 at 30 min postinfection (lane 2). The positions of lipoprotein (Lp), gpV (V) and gpVIII (VIII) are indicated. (D) The immunoblot analysis of gpVIII with antiserum to phage f1 was the same treatment as in (B).

greater in c2-infected cells than in cells infected with wild-type f1 in order to deal with the increased assembly and extrusion of phage particles.

Our analysis of inner membrane proteins indicated that the amount of gpVIII that accumulates in the inner membrane of c2 infected cells is greater than that for cells infected with wild-type f1. Infection of bacteria with lethal amber mutants of f1 has been shown to result in morphological changes caused by the accumulation of gpVIII (Woolford et al., 1974). The leader peptide of coat protein precursors has been shown to induce the formation of non-bilayer lipid membrane structures (Killian et al., 1990). Thus, the integration of large numbers of pre-coat protein molecules into the inner membrane of c2-infected cells is likely responsible for the observed formation of the intracellular membrane-like structures in these cells.

In 1981, Lubitz et al. showed that infection with fX174 induces changes in the expression of inner and outer membrane proteins. We have now shown that the abundance of several outer membrane proteins was markedly de

previously been shown to inhibit the growth of phage (Ray, 1970). It is possible that extrusion of a large number of phage particles from the cell membrane between 40 and 90 min after infection with c2 disrupts the cell membrane (Kuo et al., 2000) and therefore results in the leakage of cell contents.

The effects of c2 on the bacterial cell membrane at early stages of infection were also apparent by electron microscopy. Membrane-like structures have previously been observed by transmission electron microscopy in the cytoplasm of cells infected with amber mutants of f1, with most of these structures accumulating at the poles of the cells (Schwartz and Zinder, 1967; Ohnighi, 1971). We detected a similar accumulation of membrane-like structures in cells infected with either wild-type f1 or c2, although the effect was more pronounced in c2-infected cells. We have previously shown that c2-infected cells produce more phage particles than do f1-infected cells at early, but not later, stages of infection (Kuo et al., 2000). Thus, the number of adhesion zones at early stages of infection is likely


Lin et al. — Host cell death induced by the c2 mutant of f1

creased 120 min after infection of cells with c2. Changes in the abundance of membrane proteins can affect cell growth and the synthesis of macromolecules (Inouye and Pardee, 1970; Siccardi et al., 1972; Manning et al., 1977). Thus, the cell death induced by c2 infection may result from the membrane damage demonstrated in the present study.

Acknowledgments. This work was supported by Academia Sinica and the National Science Council, Republic of China (NSC89-2311-B-010-035).

literature Cited

Chen, W.P. 1980. Studies on a Clear-Plaque Mutant c2 of the Filamentous Bacteriophage. Masters thesis, National Taiwan University, Taipei, Taiwan, Republic of China.

Fulford, W. and P. Model. 1988. Regulation of bacteriophage f1 DNA. I. New functions of genes II and X. J. Mol. Biol. 203: 49-62.

Goessens, W.H.F., A.J.M. Driessen, J. Wilschut, and J. van Duin. 1988. A synthetic peptide corresponding to the C-terminal 25 residues of phage MS2 coded lysis protein dissipates the proton motive force in Escherichia coli membrane vesicles by generating hydrophilic pores. EMBO J. 7: 867-873.

Hohn, B., H. Lecher, and D.A. Marvin. 1971a. Filamentous bacterial viruses (I): DNA synthesis during the early stages of infection with fd. J. Mol. Biol. 56: 143-154.

Hohn, B., H. von Schutz, and D.A. Marvin. 1971b. Filamentous bacterial viruses (II): killing of bacteria by abortive infection with fd. J. Mol. Biol. 56: 155-165.

Inouye, M. and A.B. Pardee. 1970. Change of membrane proteins and their relation to deoxyribonucleic acid synthesis and cell protein synthesis and cell division of Escherichia coli. J. Biol. Chem. 245: 5813-5819.

Ito, K., T. Sato, and T. Yura. 1977. Synthesis and assembly of the membrane proteins in E. coli. Cell 11: 551-559.

Killian, J.A., A. M. de John, J. Bijvelt, A.J. Verkleij, and B. de Kruijff. 1990. Induction of non-bilayer lipid structures by functional signal peptides. EMBO J. 9: 815-819.

Kuo, M.Y., M.K. Yang, W.P. Chen, and T.T. Kuo. 2000. High-frequency interconversion of turbid and clear plaque strains of bacteriophage f1 and associated host cell death. Can. J. Microbiol. 46: 841-847.

Lubitz, W., R. Schmid, and R. Plapp. 1981. Alterations in the cytoplasmic and outer membranes of Escherichia coli infected with bacteriophage fX174. Curr. Microbiol. 5: 45-50.

Manning, P.A., A.P. Pugsley, and P. Reeves. 1977. Defective growth functions in mutants of Escherichia coli K12 lacking a major outer membrane protein. J. Mol. Biol. 116: 285-300.

Marvin, D.A. and B. Hohn. 1969. Filamentous bacterial viruses. Bacteriol. Rev. 33: 172-209.

Miller, J. 1971. Experiments in Molecular Genetics, Cold Spring Harbor Laboratory Press, Cold Spring Harbor, N.Y., pp. 352.

Ohnighi, Y. 1971. Phospholipids in virus-induced membranes in cytoplasm of Escherichia coli. J. Bacteriol. 107: 918-925.

Pratt, D., H. Tzagoloff, and W.S. Erdahl. 1966. Conditional lethal mutants of the small filamentous coliphage M13 (I): isolation, complementation, cell killing, time of cistron action. Virology 30: 397-410.

Ray, D.S. 1970. Replication of bacteriophage M13: synthesis of M13-specific DNA in the presence of chloramphenicol. J. Bacteriol. 114: 860-873.

Schwartz, F.M. and N.D. Zinder. 1967. Morphological changes in Escherichia coli infected with the DNA bacteriophage f1. Virology 34: 352-355.

Siccardi, A.G., A. Luzdunski, and B.M. Shapiro. 1972. Interrelationship between membrane protein composition and deoxyribonucleic acid synthesis in Escherichia coli. Biochemistry 11: 1573_1582.

Woolford, J.L., J.S. Cashman Jr., and R.E. Webster. 1974. f1 coat protein synthesis and altered phospholipid metabolism in f1 infected Escherichia coli. Virology 58: 544-560.

Yen, T.S.B. and R.E. Webster. 1982. Translational control of bacteriophage f1 gene II and gene X proteins by gene V protein. Cell 29: 337-345.


Botanical Bulletin of Academia Sinica, Vol. 42, 2001

¼á²Mª¬·»µß´³¬ðÅÜ®è c2 ±þ¦º±H¥D²Ó­M¾÷Âध¬ã¨s

ªL¬ÀµØ1 ³¯¤å±l2 ³¢©v¼w1,2

1 ¤¤¥¡¬ã¨s°|¤À¤l¥Íª«¬ã¨s©Ò

2 °ê¥ß»OÆW¤j¾Ç´Óª«¨t
±q³¥¥Í«¬½uª¬¾½µßÅé f1 ²V¿Bª¬·»µß´³ (turbid plaque) ¬D¨ì¤@­Ó¼á²Mª¬·»µß´³ (clear plaque) ¬ðÅÜ®è c2¡A¦¹¬ðÅÜ®è c2 ·P¬V±H¥D«á·|³y¦¨±H¥D¦º¤`¡A¥»¬ã¨sÆ[¹î c2 ³y¦¨±H¥D¦º¤`¤§¾÷Âà¡A¦b·P¬V 30 ¤ÀÄÁ«á¡A±H¥D²Ó­M½¤¹q¦ì¤j¶q³à¥¢¡A¦Ó 4 ¤p®É«á¡A±H¥D²Ó­M¤º§tª«¦³¤j¶q¥~º|±¡§Î¡A¥B¸g¥Ñ¬ï³z¦¡¹qÅã¥iÆ[ ¹î¨ì¦b c2 ·P¬V¦­´Á¡A±H¥D²Ó­M¤º¦³¤j¶q½¤ª¬Áû²É²Ö¿n¡A§ó¶i¤@¨B¤ÀªR c2 ·P¬V«á±H¥D²Ó­M½¤³J¥Õ²Õ¦¨¤§ §ïÅÜ¡Aµo²{¦b c2 ·P¬V 2 ¤p®É«á¡A³\¦h±H¥D²Ó­M½¤¥~½¤³J¥Õ§YÅãµÛ´î¤Ö¡A¥B¾½µßÅé¥~´ß°ò¦] VIII ³J¥Õ½è»P³æªÑ DNA µ²¦X°ò¦] V ³J¥Õ½è¡A¤j¶q²Ö¿n¦b²Ó­M½¤¤º½¤¡A¥Ñ¥H¤Wµ²ªGÅã¥Ü¡A¦¹¼á²Mª¬·»µß´³¬ðÅÜ®è c2 ·P¬V±H¥D«á¡A·|³y¦¨±H¥D²Ó­M½¤¤§¶Ë®`¦Ó¾É­P±H¥D¦º¤`¡C

ÃöÁäµü¡G ±H¥D²Ó­M¦º¤`¡F¼á²Mª¬·»µß´³¡F¤j¸z±ìµß¡F½uª¬¾½µßÅé f1¡C