Bot. Bull. Acad. Sin. (2001) 42: 93-100

Lai et al. — Genetic relationships in tea

An assessment of genetic relationships in cultivated tea clones and native wild tea in Taiwan using RAPD and ISSR markers

Jou-Ann Lai, Wei-Chen Yang, and Ju-Ying Hsiao*

Department of Botany, National Chung Hsing University, Taichung, Taiwan, Republic of China

(Received May 2, 2000; Accepted October 27, 2000)

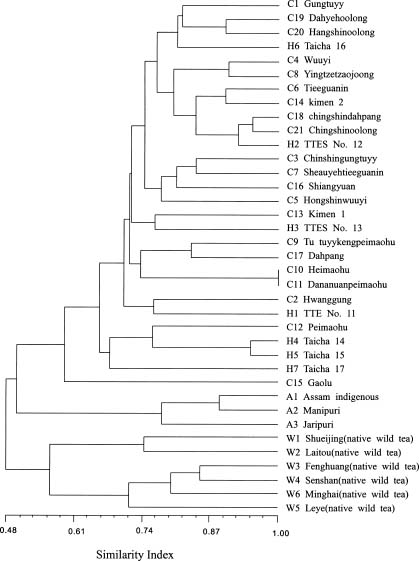
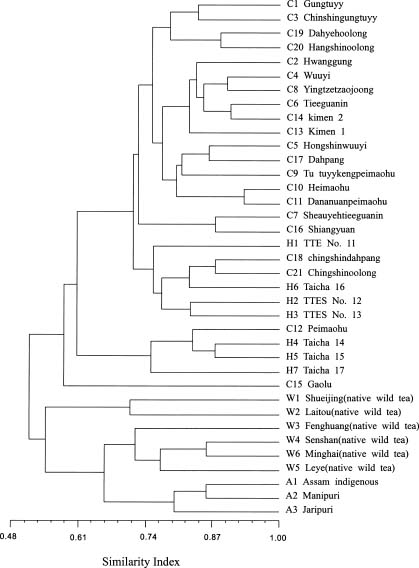
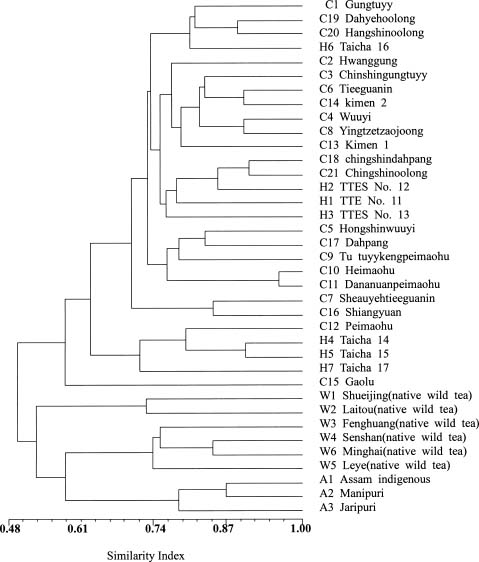
Abstract. Tea (Camellia sinensis [L.] O. Kuntze) is an important beverage crop in Taiwan. Most of the cultivated clones were introduced from China and India though some native wild teas are distributed in the mountains of central and southern Taiwan. In this study, 37 tea samples were evaluated using RAPD and ISSR markers. The samples comprised 21 clones of China, 3 clones of Assam, 7 hybrid clones between China and Assam tea, and 6 individual samples of native Taiwanese wild tea. A total of 53 and 56 polymorphic RAPD and ISSR markers respectively, were scored. The results of cluster analysis based on RAPDs revealed that three major groups could be recognized, i.e., cultivars of China tea and the cultivars developed in Taiwan from hybridization and selection; Assam tea; native Taiwanese wild tea. The native Taiwanese wild teas were, however, most distant in the clustering tree. In the ISSR dendrogram, Taiwanese native wild teas clustered closely with Assam tea then with China tea and the Taiwanese hybrid cultivars. The population gene diversity of the native wild tea was found to be the highest among the three populations studied. Analysis of molecular variance (AMOVA) revealed that the variance component within groups was larger than that among groups. The correlation coefficient between similarity matrices based on RAPD and ISSR was 0.811. A Mantel test revealed that the correlation was highly significant (p<0.001), indicating good congruence between the results of these two molecular markers.

Keywords: AMOVA; Camellia sinensis; Genetic variation; ISSR; RAPD; Tea.

Introduction

Tea (Camellia sinensis [L.] O. Kuntze) is an important beverage crop in Taiwan, having been cultivated on the island for more than two hundred years. The tea trade dates back to 1865. The export of tea from Taiwan has, however, been decreasing gradually since 1980 due to competition from other tea-exporting countries (Zuan and Shi, 1995). The production of high quality tea with regional characteristics has nevertheless remained a highly profitable business. The breeding of the new high quality varieties and the conservation of tea germplasm resources continue to be important for the sustainable cultivation of tea in Taiwan.

Tea is an out-crossing species, and selected elite genotypes are propagated vegetatively and released as clonal varieties. Clonal identification has traditionally been based on morphological descriptors such as plant shape, leaf shape, young leaf type, and fruit shape. However, as in many out-crossing crops, tea is highly heterozygous with most of its morphological, physiological and biochemical descriptors showing continuous variation and high plasticity. Similarly, most morphological traits are influenced by environmental factors, plant age and phenology. Furthermore, since objectivity is crucial to accurate morphological typing, the above factors render the use of

such descriptors in plant identification and discernment of genetic relationships difficult. Molecular markers such as RAPD and ISSR can, however, be used for these purposes. The advantages of molecular markers are that they are least affected by environmental factors and are almost unlimited in number. They also offer a possibility to observe the genome directly, and thus eliminate the shortcomings inherent in a phenotype observation.

The first tea cultivar cultivated in Taiwan was introduced from Fukien (China), between 1796 and 1820. More cultivars were introduced from China thereafter. From 1926, some of the new cultivars were introduced from India. The cultivars introduced from China belong to China tea (var. sinensis [L] O. Kuntze) while those introduced from India belong to Assam tea (var. assamica [Mast.] Kitam.). The majority of tea clones cultivated in Taiwan are China tea, reflecting the order of introduction and the preference for domestic consumption. Besides the introduced clones, new clones have been developed by hybridization and selection. The native wild tea (var. assamica [Mast.] Kitam.f. formosensis Kitam.) grows in the central and southern mountains of Taiwan. Based on leaf characteristics and tree type, they have been taxonomically classified as a form of var. assamica. The leaves and young leaf buds of the native wild tea can also be used in the production of tea (Ho and Wang, 1984). Although they are not commonly exploited, the native wild teas provide an important reservoir of genes which can be introgressed into the current generation of clones. Their genetic relationship with cul

*Corresponding author. Tel: 886-4-22840417 ext. 315; Fax: 886-4-22874740; E-mail: jyhsiao@dragon.nchu.edu.tw


Botanical Bulletin of Academia Sinica, Vol. 42, 2001

tivated clones, therefore, deserves investigation. Random Amplified Polymorphic DNA (RAPD) markers, developed by Williams et al. (1990) have been employed widely in cultivar identification and characterisation (Hu and Quiros, 1991; Halward et al., 1992; Hsiao and Rieseberg, 1994; Sharma et al., 1995; Lai and Hsiao, 1997; Mandolino et al., 1999). In tea, this molecular marker system has been used to determine genetic diversity and differentiation within and between cultivated tea and related Camellia species (Wachira et al., 1995; Wachira et al., 1997). Intersimple Sequence Repeat Polymorphism (ISSR) markers developed by Zietkiewicz et al. (1994) can also be employed for the same purpose (Wolff et al., 1995; Tsumura et al., 1996; Fang and Roose, 1997; Chen et al., 1998).

Materials and Methods

Materials

Leaf samples were collected from 37 tea cultivars and from native Taiwanese wild tea listed in Table 1. The

samples included 21 clones of China tea, 3 clones of Assam tea, 7 China/Assam hybrid clones developed in Taiwan, and 6 individual samples of Taiwanese native wild tea. The samples were collected from theYuchih Substation of the Taiwan Tea Experiment Station.

DNA Extraction and Amplification

The DNA was extracted from the leaf samples according to the method of Kobayashi et al. (1998). RAPD amplification generally followed the method of Williams et al. (1990) with some minor modifications of thermal cycles as follows: 94°C for 2 min; 44 cycles of 94°C for 30 s, 36°C for 30 s, 72°C for 2 min; 72°C for 5 min; 4°C end. One hundred and forty decanucleotide primers from kits A, B, C, E, M, Q, and V of Operon Technology Inc. (USA) were screened for polymorphism. The PCR amplifications were carried out on a PTC-100 Thermal Cycler Controller (MJ Research Inc.). ISSR amplification generally followed the method of Tsumura et al. (1996) with a minor modification of the thermal cycles as follows: 94°C for 3 min; 45 cycles of 94°C for 40 s, 50°C for 45 s, 72°C for 100 s; 72°C for 5 min; 4°C end. The DNA polymerase from HT Biotechnology (UK) was used in the optimized RAPD and ISSR polymerase chain reactions. A negative control with no DNA was included in each PCR run. The amplification was repeated at least twice. The amplification products along with a Bio100 DNA ladder (PROtech technology, Inc.) were size fractionated in 1.5% agarose and electrophoresed in 0.5X TBE buffer at 200 V for 2 h and stained with ethidium bromide. The banding patterns were documented on Polaroid 667 films.

Statistical Analysis

Only intensely stained, unambiguous, and reproducible polymorphic bands were scored for presence (1) and absence (0). The binary data was used to calculate similarity matrix among samples using Dice's (1945) algorithm. The similarity matrix was used in an unweighted pair group method using arithmetic averages (UPGMA) cluster analysis. The Pearson's correlation coefficient between the similarity matrices based on RAPD and ISSR data was calculated and the significance of the correlation tested by the Mantel test (Sokal and Rohlf, 1995). The samples, excluding hybrid tea clones developed in Taiwan, were separated into the three groups of China, Assam, and native wild tea. A matrix of inter-phenotypic distances was constructed and analyzed with WINAMOVA 1.55 (Analysis of Molecular variance) according to the formula of Excoffier et al. (1992), D=N(1-(N11/N)), where N is the total number of polymorphic bands and N11 the number of bands shared by two samples. Genetic variation was then partitioned within and among groups and significance values assigned to variance components based on the random permutation (10,000 times) of individuals assuming no genetic structure. Nei's gene diversity (Hs; Nei, 1973) for each group was derived using the computer program, POPGENE 3.2 (Yeh et al., 1999) assuming Herdy-Weinberg equilibrium.

Table 1. Samples studied and the codes used in the present study.

Code Clone or accession name

China tea 1 Gungtuyy

China tea 2 Hwanggung

China tea 3 Chinshingungtuyy

China tea 4 Wuuyi

China tea 5 Hongshinwuuyi

China tea 6 Tieeguanin

China tea 7 Sheauyehtieeguanin

China tea 8 Yingtzetzaojoong

China tea 9 Tutuyykengpeimaohu

China tea 10 Heimaohu

China tea 11 Dananuanpeimaohu

China tea 12 Peimaohu

China tea 13 Kimen 1

China tea 14 Kimen 2

China tea 15 Gaolu

China tea 16 Shiangyuan

China tea 17 Dahpang

China tea 18 Chingshindahpang

China tea 19 Dahyehoolong

China tea 20 Hangshinoolong

China tea 21 Chingshinoolong

Hybrid tea 1 TTE No. 11

Hybrid tea 2 TTES No. 12

Hybrid tea 3 TTES No. 13

Hybrid tea 4 Taicha 14

Hybrid tea 5 Taicha 15

Hybrid tea 6 Taicha 16

Hybrid tea 7 Taicha 17

Native wild tea 1 Shueijing (native wild tea)

Native wild tea 2 Laitou (native wild tea)

Native wild tea 3 Fenghuang (native wild tea)

Native wild tea 4 Senshan (native wild tea)

Native wild tea 5 Leye (native wild tea)

Native wild tea 6 Minghai (native wild tea)

Assam tea 1 Assam Indigenous

Assam tea 2 Manipuri

Assam tea 3 Jaripuri


Lai et al. — Genetic relationships in tea

Results

RAPD

Out of the primers screened, 12 (Table 2) produced intensely stained, reproducible bands. An example of the polymorphisms detected among some test samples by primer OPV6 is shown in Figure 1. A total of 53 polymorphic bands (Table 2) were scored from the amplifications using these primers. The average number of polymorphic bands per primer was 4.4. All of the tea clones could be distinguished from one another based on these polymorphic bands except "Heimaohu" and "Dananuanpeimaohu", which had identical profiles. Similarities among the test samples calculated with Dice's formula (Dice, 1945) indicated that the highest similarity (1.000) was between "Heimaohu" and "Dananuanpeimaohu" while the lowest (0.238) was between "Shiangyuan" and "Laitou". The similarity matrix obtained (not presented) was used in an UPGMA cluster analysis. The cophenetic correlation coefficient of this cluster analysis was 0.870, indicating good agreement between the similarity matrix and cophenetic matrix although a certain degree of distortion is usually inevitable in the clustering. The dendogram (Figure 2) showed that three groups could be recognized at a similarity index of 0.5. The first group consisted of all cultivars of China tea. The second group consisted of three cultivars of Assam tea while the third group consisted of samples of native wild tea. The dendrogram also indicated that the group of native wild tea was the most isolated group. Seven clones developed in Taiwan and selected from a hybridization program between China and Assam tea were clustered in the China tea group. The clustering was consistent with morphological similarity except in the case of cultivar "TTE No. 11", which clustered with the China cultivars though it is morphologically more similar to Assam tea. Within the group of native wild tea, two subgroups could be recognized at the similarity index of 0.6. One subgroup consisted of Shueijing and Laitou, both of which have red leaf buds. The other subgroup was composed of native wild tea without the red color.

The Nei's gene diversity measure for each group is listed in Table 3. The native Taiwanese wild tea group had the largest within group diversity (H=0.280) while the Assam tea group had the least diversity (Hs=0.074). The diversity within the China tea group was Hs=0.197. The results of AMOVA (Table 4) showed that the variance components among groups and among individual samples within groups were 5.099 (46.69%) and 5.822 (53.31%), respectively.

Figure 2. Dendrogram based on polymorphic RAPD bands.

Figure 1. An example of the polymorphisms detected among some test samples using RAPD primer OPV6. (left to right: lane 1, 100 bp marker; lane 2 - lane 19, samples C1-C18; lane 20, 100 bp marker).

Figure 3. An example of the polymorphisms detected among some test samples using ISSR primer 814.1. (left to right: lane 1, 100 bp marker; lane 2 - lane 19, samples C1-C18; lane 20, 100 bp marker).


Botanical Bulletin of Academia Sinica, Vol. 42, 2001

Table 2. Nucleotide sequences of primers used and the fragments recorded.

Primer code Sequence (5'-3') Fragments recorded

OPB10 CTGCTGGGAC 0.55 kb, 0.75 kb, 1.2 kb, 1.6 kb, 1.8 kb

OPQ13 GGAGTGGACA 0.65 kb, 0.71 kb, 0.8 kb, 0.95 kb, 1.2 kb

OPM2 ACAACGCCTC 0.85 kb, 0.95 kb, 1.2 kb, 1.45 kb, 1.8 kb

OPV2 AGTCACTCCC 0.45 kb, 0.71 kb, 0.95 kb, 1.55 kb, 2.1 kb

OPQ5 CCGCGTCTTG 0.38 kb, 0.45 kb, 0.5 kb, 0.65 kb, 0.68 kb

OPE12 TTATCGCCCC 0.31 kb, 0.45 kb, 0.55kb, 0.88 kb

OPV6 ACGCCCAGGT 0.52 kb, 0.65 kb,0.71 kb, 0.95 kb,1.5 kb

OPA8 GTGACGTAGG 0.72kb, 0.73 kb, 1.2kb

OPA9 GGGTAACGCC 0.49 kb, 0.95 kb, 1.1 kb, 1.2 kb, 2.8 kb

OPA12 TCGGCGATAG 0.8 kb, 0.92 kb, 1.2 kb, 1.7 kb

OPA4 AATCGGGCTG 0.43 kb, 0.65 kb,1.1 kb

OPV12 ACCCCCCACT 0.72kb, 0.84 kb, 1.2kb, 1.3 kb

814.1 (CT)8TG 0.51 kb, 0.55kb, 0.64 kb, 0.65kb, 0.81 kb, 0.82kb, 0.94 kb, 1.15kb, 1.2 kb, 1.4kb, 1.41 kb

UBC830 (GA)8C 0.52 kb, 0.54kb, 0.55 kb, 0.65kb, 0.7 kb, 0.84kb, 0.85 kb, 0.96kb, 0.98 kb, 1.05kb, 1.1 kb

UBC825 (AC)8YT 0.55 kb, 0.66kb, 0.82 kb, 0.84kb, 0.86 kb, 0.93kb, 0.96 kb, 1.05kb, 1.2 kb

UBC840 (AC)8YG 0.51 kb, 0.63kb, 0.66 kb, 0.84kb, 0.95 kb, 1.1kb, 1.35 kb, 1.4kb, 1.6 kb

UBC842 (CT)8RG 0.5 kb, 0.72kb, 0.74 kb, 0.95kb, 0.96 kb, 1.2kb, 1.22 kb, 1.26kb, 1.28kb

17901 (GT)6YR 0.71 kb,0.72 kb, 0.83 kb,0.84 kb, 1.2 kb,1.3 kb, 1.35 kb

ISSR

Out of the twenty 3'-anchored ISSR primers screened, six (Table 2) produced non-ambiguous and reproducible bands. An example of the polymorphisms detected among some test samples by primer 814.1 is shown in Figure 3. A total of 56 polymorphic bands were scored in the test samples from the primers. The average number of polymorphic bands per primer was 9.3. All the tea clones could be distinguished from one another based on these polymorphic bands.

Similarities among samples calculated with Dice's formula (data not presented) indicated that the highest similarity (0.923), was between "Heimaohu" and "Dananuanpeimaohu" while the lowest similarity (0.270) was between Minghai of native wild tea and "Gaolu". The similarity matrix (not presented) was used in an UPGMA cluster analysis. The cophenetic correlation coefficient of this cluster analysis was 0.843. The dendogram observed

(Figure 4) showed that two groups could be recognized at the similarity index of 0.5. The first group consisted of all China and hybrid cultivars. As was demonstrated with RAPDs, cultivar "TTE No. 11", which is morphologically similar to Assam tea also clustered with China tea. The second group consisted of samples of native wild tea and cultivars of Assam tea. Within this group, two subgroups could be recognized at the similarity index of 0.55. One subgroup consisted of the red leafed native wild teas Shueijing and Laitou. The second subgroup consisted of Assam tea cultivars and some non-red leafed native wild teas. The cultivars of Assam tea were separated from samples of native wild tea within the second subgroup.

The Nei's gene diversity measure for each group is listed in Table 3. The native wild tea group had the largest within group diversity (Hs=0.253) while the Assam tea had the least diversity (Hs=0.114). The diversity within the China tea group was Hs=0.181. AMOVA (Table 4) revealed that the variance components among groups and among individual samples within groups were 5.021 (44.11%) and 6.362 (55.89%), respectively.

RAPD and ISSR Combined

When RAPD and ISSR data were combined, the results of cluster analysis (Figure 5) showed two major groupings similar to the result of ISSR.

Table 3. Gene diversity (Hs) within China, Assam and native wild tea.

China tea Assam tea Native wild tea

RAPD 0.197 0.074 0.280

ISSR 0.181 0.114 0.253

Table 4. Result of analysis of molecular variance (AMOVA).

RAPD ISSR

Source of variation d.f. SSD MSD Variance % Total P* d.f. SSD MSD Variance % Total P* component component

Among groups 2 82.0 41.0 5.099 46.69 <0.001 2 82.0 41.0 5.021 44.11 <0.001

Among individuals 27 156.6 5.8 5.822 53.31 <0.001 27 172.8 6.4 6.362 55.89 <0.001 wthin group

*After 10,000 random permutations.


Lai et al. — Genetic relationships in tea

Discussion

Three main groups could be recognized from the result of cluster analysis based on RAPD data. Samples of Assam tea formed a group while those of native wild tea formed another group. The remaining samples clustered in a group that consisted of samples of China tea and the hybrid tea clones developed in Taiwan. The hybrid tea clones are generally closer to China tea morphologically with the exception of clone "TTE No. 11", which is closer to Assam tea. The major groupings in the dendrogram based on RAPD markers are thus, with the exception of "TTE No. 11", consistent with morphological differentiation. This result seems to indicate that "TTE No. 11" is closer to China tea in overall genetic relationship. Wachira et al. (1995) studied the relationship among tea clones using RAPD markers and found that, among the clones studied, some clones clustered in the Assam tea group despite their seemingly China characteristics. These clones were thought to be putative hybrids of China and Assam varieties which had retained morphological traits of the former. Genetic differentiation based on ISSR polymorphism was similar to that obtained using RAPD markers. When RAPD and ISSR data were pooled together, the results of cluster analysis showed two major groups, similar to the result obtained using ISSR markers alone. These results support the taxonomic treatment in which the native wild tea was treated as an Assam variety.

Clones "TTES No. 12" and "TTES No. 13" are difficult to distinguish morphologically. However, these clones are different in parentage, method of cultivation, and tea quality. They can be distinguished based on their RAPD profiles, indicating that there is genetic difference between them. These two cultivars could also be separated based on ISSR markers. The result indicated that both RAPD and ISSR have high resolution in the genotype identification of tea.

Clones "Peimaohu", "Dananuanpeimaohu", and "Tutuyykengpeimaohu" were introduced from Fukien, China (Zuan and Shi, 1995). They had been suspected to be the same clone, despite their minor morphological differences. They could, however, be separated based on their RAPD and ISSR profiles. The similarities among these cultivars ranged from 0.68 to 0.74 for RAPD and from 0.58 to 0.76 for ISSR.

Clones "Taicha 14", "Taicha 15", "Taicha 16", and "Taicha 17" were developed from "Peimaohu". Both RAPD and ISSR dendrograms showed that "Taicha 14", "Taicha 15", and "Taicha 17" clustered with "Peimaohu", reflecting pedigree relationship. Although "Taicha 16" did not cluster with "Peimaohu", it had a high RAPD similarity (0.80) and high ISSR similarity (0.77) with "Peimaohu". The result confirmed the potential of RAPD and ISSR in reflecting a pedigree relationship.

Clones "Shiangyuan" and "Gaolu" are similar in morphology. They are triploids and thus flower rarely. "Gaolu" was introduced from Japan while "Shiangyuan"

Figure 4. Dendrogram based on polymorphic ISSR bands.

Figure 5. Dendrogram based on polymorphic RAPD and ISSR bands.


Botanical Bulletin of Academia Sinica, Vol. 42, 2001

was introduced from Fukien, China. The RAPD similarity (0.58) and ISSR similarity (0.60) between them indicated a large genetic difference in spite of morphological similarity. "Shiangyuan" has the highest RAPD similarity (0.81) and ISSR similarity (0.86) with "Sheauyehtieequanin". They were both introduced from Fukien, China and have similar leaf morphology.

Taiwan native wild tea is close to Assam tea morphologically, and it has been taxonomically treated as an Assam variety. The cluster analysis based on RAPD markers revealed that it is the most isolated group. The variety assamica is distributed from southern China to northern India. In the present study, three clones introduced from India were analyzed, representing only a small portion of the total variation of the variety assamica. The result of the RAPD study suggests that the native wild tea is native to Taiwan and not the result of an escape from cultivation because there is considerable genetic difference between it and the cultivated teas. The germplasm of native wild tea might be useful in plant breeding programs and deserve conservation. The result of the ISSR study suggests that the native Taiwanese wild tea is close to Assam tea genetically and thus supports the current taxonomic treatment.

Table 3 showed that Assam tea had the smallest within group diversity while native wild tea had the largest for both RAPD and ISSR markers. Three clones of Assam tea were included in the present study. These clones represent only a small portion of the genetic variation of Assam tea. This might account for the small within group diversity of Assam tea observed. Six samples of native wild tea were studied, and the diversity within native wild tea was larger than China tea, which consisted of 21 cultivars. The result indicated that the native wild tea is highly variable and the germplasms of native wild tea might be useful in breeding programs.

Wachira et al. (1995) studied the genetic diversity and relationship of 38 tea clones of China, Assam, and Cambod tea (C. assamica ssp. lasiocalyx Planchon ex Watt) using RAPD markers and showed that 30% of the total diversity resided among populations while 70% resided within populations based on Shannon's diversity index. The result of cluster analysis was generally consistent with the taxonomic treatment. Wachira et al. (1997) studied the genetic relationship of 20 species of the genus Camellia using RAPD and organelle-specific PCR. The result was generally consistent with the classification based on morphology and the relationship revealed from comparative phytochemical data. Paul et al. (1997) studied the diversity and genetic differentiation of India and Kenyan tea using AFLP markers. Shannon's index of diversity was used to partition the total variation, and they found that most of the diversity was detected within populations, with 79% of the variation being within and 21% being between populations of India and Kenyan tea. A dendrogram constructed on the basis of band sharing separated the tea samples into China, Assam and Cambod types. The genetic diversity and relationships of tea clones available in

Taiwan, together with samples of native wild tea, were investigated in the present study using RAPD and ISSR markers. The results may serve as reference information for tea breeding and germplasm conservation purposes. In the present study, native wild tea was included as a group while Cambod tea was not studied. The AMOVA analysis revealed that the percentages of variances attributable to the differences among and within groups were 46.69% and 53.31% for RAPD and 44.11% and 55.89% for ISSR, respectively. These results indicated considerable genetic differentiation among the three groups studied. Wachira et al. (1995) didn't analyze their data using AMOVA.

The Pearson's correlation coefficient between similarity matrices based on RAPD and ISSR was 0.811. The Mantel test revealed that the correlation was highly significant (P<0.001). This implied that the results of RAPD and ISSR studies were highly congruent. However, ISSRs seemed to be more discriminative in cultivar identification then RAPDs because cultivars that could not be distinguished by RAPD markers were separable based on ISSR markers. This finding suggests that the evolution rate of ISSRs might be faster then that of RAPDs in the tea samples studied. ISSR markers are, therefore, suitable for use in the study of genetic diversity and determination of genetic relationships of closely related tea cultivars. Other studies also indicated that ISSR markers exhibit higher levels of polymorphism than RAPD markers (Yang et al., 1996; Nagaoka and Ogihara, 1997; Parsons et al., 1997; Esselman et al., 1999). The observed difference between ISSR and RAPD might be explained in terms of functional constraints since some RAPD bands may be associated with functionally important loci (Penner, 1996). The fast evolutionary rate and the hypervariability of ISSR may suggest that ISSR bands represent neutral markers (Esselman et al., 1999).

Acknowledgments. This study was supported in part by Grant NSC 88-2311-B-005-015 from the National Science Council, Republic of China. We would like to thank Mr. Hue-Shuan Shi of the Yuchih Substation of the Taiwan Tea Experiment Station for his assistance and advice in the collection of plant materials. The authors thank Dr. F. N. Wachira and an anonymous reviewer for their helpful suggestions and critical review of the manuscript.

Literature Cited

Chen, Y., G. Hausner, E. Kenaschuk, D. Procunier, P. Dribnenki, and G. Penner. 1998. Identification of microspore-derived plants in anther culture of flax (Lilium usitatissimum L.) using molecular markers. Plant Cell Rep. 18: 44-48.

Dice, L.R. 1945. Measures of the amount of ecologic association between species. Ecology 26: 297-302.

Esselman, E.J., L. Jianqiang, D.J. Crawford, J.L. Windus, and A.D. Wolfe. 1999. Clonal diversity in the rare Calamagrostis porteri ssp. insperata (Poaceae): comparative results for allozymes and random amplified polymorphic DNA (RAPD) and intersimple sequence repeat (ISSR) markers.


Lai et al. — Genetic relationships in tea

Mol. Ecol. 8: 443-451.

Excoffier, L., P.E. Smouse, and J.M. Quattro. 1992. Analysis of molecular variance inferred from matrix distances among DNA haplotypes: application to human mitochondrial DNA restriction data. Genetics 131: 479-491.

Fang, D.Q. and M.L. Roose. 1997. Identification of closely related citrus cultivars with inter-simple sequence repeat markers. Theor. Appl. Genet. 95: 408-417.

Halward, T., T. Stakker, E. LaRue, and G. Kochert. 1992. Use of single-primer DNA amplifications in genetic studies of peanut (Arachis hypogaea L.). Plant Mol. Biol. 18: 315-325.

Ho, S.H. and L.C. Wang. 1984. The collection of native wild tea in Taiwan. Taiwan Tea Res. Bull. 3: 133-155 (in Chinese).

Hsiao, J.Y. and L.H. Rieseberg. 1994. Population genetic structure of Yushania niitakayamensis (Bambusoideae, Poaceae) in Taiwan. Mol. Ecol. 3: 201-208.

Hu, J. and C.F. Quiros. 1991. Identification of broccoli and cauliflower cultivars with RAPD markers. Plant Cell Rep. 10: 501-511.

Kobayashi, N., T. Horikoshi, H. Katsuyama, T. Handa, and K. Takayanagi. 1998. A simple and efficient DNA extraction method for plants, especially woody plants. Plant Tissue Cult. Biotech. 4: 76-80.

Lai, C.C. and J.Y. Hsiao. 1997. Genetic variation of Phyllostachys pubescens (Bambusoideae, Poaceae) in Taiwan based on DNA polymorphisms. Bot. Bull. Acad. Sin. 38: 145-152.

Mandolino, G., A. Carboni, S. Forapani, V. Faeti, and P. Ranalli. 1999. Identification of DNA markers linked to the male sex in dioecious hemp (Cannabis sativa L.). Theor. Appl. Genet. 98: 86-92.

Nagaoka, T. and Y. Ogihara. 1997. Applicability of inter-simple sequence repeat polymorphisms in wheat for use as DNA markers in comparison to RFLP and RAPD markers. Theor. Appl. Genet. 94: 597-602.

Nei, M. 1973. Analysis of gene diversity in subdivided populations. Proc. Nat. Acad. Sci. USA 70: 3321-3323.

Parsons, B.J., H.J. Newbury, M.T. Jackson, and B.V. Ford-Lloyd. 1997. Contrasting genetic diversity relationships are revealed in rice (Oryza sativa L.) using different marker types. Mol. Breeding 3: 115-125.

Paul, S., F. N. Wachira, W. Powell, and R. Waugh. 1997. Diversity and genetic differentiation among populations of In

dian and Kenyan tea (Camellia sinensis (L.) Kuntze, O) revealed by AFLP markers. Theor. Appl. Genet. 94: 255-263.

Penner, G.A. 1996. RAPD analysis of plant genomes. In P.P. Jauhar (ed.), Methods of Genome Analysis in Plants. CRC Press, Boca Raton, pp. 251-268.

Sharma, S.K., I. K. Dawson, and R. Waugh. 1995. Relationship among cultivated and wild lentils revealed by RAPD analysis. Theor. Appl. Genet. 91: 647-654.

Sokal, R.R. and F.J. Rohlf. 1995. Biometry. Third Edition. Freeman, New York.

Tsumura, Y., K. Ohba, and S.H. Strauss. 1996. Diversity and inheritance of inter-simple sequence repeat polymorphisms in Douglas-fir (Pseudotsuga menziesii) and sugi (Cryptomeria japonica). Theor. Appl. Genet. 92: 40-45.

Wachira, F.N., R. Waugh, C.A. Hackett, and W. Powell. 1995. Detection of genetic diversity in tea (Camellia sinensis) using RAPD markers. Genome 38: 201-210.

Wachira, F.N., W. Powell, and R. Waugh. 1997. An assessment of genetic diversity among Camellia sinensis L. (cultivated tea) and its wild relatives based on randomly amplified polymorphic DNA and organelle-specific STS. Heredity 78: 603-611.

Williams, J.G.K., A.R. Kubelik, K.J. Livak, J.A. Rafalski, and S.V. Tingey. 1990. DNA polymorphisms amplified by arbitrary primers are useful as genetic markers. Nucl. Acids Res. 18: 6531-6535.

Wolff, K., E. Zietkiewicz, and H. Hofstra. 1995. Identification of chrysanthemum cultivars and stability of DNA fingerprinting patterns. Theor. Appl. Genet. 91: 439-447.

Yang, W., A.C. de Oliveira, I. Godwin, K. Scheritz, and J.L. Bennetzen. 1996. Comparison of DNA marker technologies in characterizing plant genome diversity: variability in Chinese sorghums. Crop Sci. 36: 1669-1676.

Yeh, F.C., R.-C. Yang, T.B. J. Boyle, Z.-H. Ye, and J.X. Mao. 1999. POPGENE 3.2, the User-Friendly Shareware for Population Genetic Analysis. Molecular Biology and Biotechnology Centre, University of Alberta, Edmonton, Alberta, Canada.

Zietkiewicz, E., A. Rafalski, and D. Labuda. 1994. Genome fingerprinting by simple sequence repeat (SSR)-anchored polymerase chain reaction amplification. Genomics 20: 176-183.

Zuan, Y.M. and Y.S. Shi. 1995. The History of Tea Plantation in Taiwan. Taiwan Tea Agriculture Improvement Institute, Taipei (in Chinese).


Botanical Bulletin of Academia Sinica, Vol. 42, 2001

À³¥Î RAPD ¤Î ISSR ¬ã¨s»OÆW®â°ö»P³¥¥Í¯ù¾ð¤§¿ò¶Çª[²§«× ¤Î¿Ë½tÃö«Y

¿à¬L¦w ·¨°¶¨° ¿½¦p­^

°ê¥ß¤¤¿³¤j¾Ç´Óª«¾Ç¨t

¯ù¾ð (Camellia sinensis L. (O. Kuntz)) ¬O­«­nªº¸gÀÙ§@ª«¡C»OÆWªº¯ù¾ð®â°ö«~ºØ¥D­n·½¦Û©ó¤¤°ê¤Î¦L «×¡A¦Ó¤À§G¦b¥xÆW¤s°Ïªº³¥¥Í¯ù¾ð¥¼³Q¼sªxªº§Q¥Î»P¬ã¨s¡C¦b¥»¬ã¨s¤¤¡AÀ³¥Î RAPD ¤Î ISSR §Þ³N¤ÀªR»OÆW¦a°Ï¤Þ¶iªº«~ºØ¡BÂø¥æ¨|¦¨ªº«~ºØ©M»OÆW³¥¥Í¯ù¾ð¦@ 37 ­Ó¼Ë¥»¡A¨ä¤¤¥]¬A¤¤°ê¯ù 21 ­Ó¼Ë¥»¡AªüÂÄ ©i¯ù 3 ­Ó¼Ë¥»¡A¤¤°ê¯ù»PªüÂÄ©i¯ùÂø¥æ©Ò¨|¥X¤§«~ºØ 7 ­Ó¼Ë¥»¡A¤Î»OÆW­ì²£³¥¥Í¯ù¾ð 6 ­Ó¼Ë¥»¡Cµ²ªG¥H 12 ­Ó RAPD ¤Þ¤l¤Î 6 ­Ó ISSR ¤Þ¤l¤À§O±o¨ì 53 ¤Î 56 ­Ó¦h«¬©Ê±ø±a¡C RAPD ¤À¤l¼Ð»x°£¤F¤j«nÆW¥Õ¤ò µU¤Î¶Â¤òµU¤£¯à°Ï¤À¥~¯à°Ï¤À¨ä¥Lªº¼Ë¥»¡A¦Ó ISSR ¤À¤l¼Ð»x¯à°Ï¤À©Ò¦³ªº¼Ë¥»¡C¥Ñ RAPD ¤À¤l©Êª¬ªº Âk¸s¤ÀªR±o¨ì¤T¸s¡A²Ä¤@¸s¥]§t©Ò¦³ªº¤¤°ê¯ù®â°ö«~ºØ¤ÎÂø¥æ¨|¦¨ªº«~ºØ¡A²Ä¤G¸s¥]§tªüÂÄ©i¯ù¤§¤T­Ó«~ ºØ¡A²Ä¤T¸s«h¥]§t»OÆW­ì²£³¥¥Í¯ù¾ð¡C¦Ó¦b ISSR ¤§Âk¸s¹Ï¡A­ì²£³¥¥Í¯ù¾ð¥ý»PªüÂÄ©i¯ù³sµ²¡AµM«á»P¤¤ °ê¯ù¤ÎÂø¥æ¨|¦¨«~ºØ©Òºc¦¨¤§¤@¸s³sµ²¡C¦U®â°ö«~ºØ¤j­P¨Ì·Óµo·½¦a¤Î¤ÀÃþ¦a¦ì¦Ó¤À¸s¡C»OÆWªº³¥¥Í¯ù¾ð ªº¤À¤l©Êª¬°¾¦V©óªüÂÄ©iÅܺءA¥B³¥¥Í¯ù¾ð¼Ë¥»¶¡ªºª[²§«×³Ì¤j¡C¨ÌÂk¸sµ²ªG¤§¤À¸s¶i¦æ AMOVA ¤ÀªRªºµ²ªG«ü¥X¸s¤ºÅܤ覨¤À¤j©ó¸s¶¡ªºÅܤ覨¤À¡A»P«e¤H¬ã¨s¬Û²Å¡C¤ñ¸û RAPD ¤Î ISSR ¬Û¦ü«×¯x°}¡A¨â ¯x°}¶¡¬ÛÃö«Y¼Æ¬° 0.811¡AMantel ÀË©w¤§µ²ªGÅã¥Ü¦¹¬ÛÃö·¥ÅãµÛ (P<0.001)¡A¦]¦¹¨âºØ¤À¤l¼Ð»x©Ò±oµ²ªG ¦³°ªªº§k¦X«×¡C¥H«~¨tªº°Ï¤À¯à¤OÅã¥Ü ISSR §Þ³N¨ã¦³¸û°ªªºÆF±Ó«×¡C

ÃöÁäµü¡G AMOVA¡FCamellia sinensis¡F¿ò¶Çª[²§«×¡F RAPD¡FISSR¡F¯ù¡C