Bot. Bull. Acad. Sin. (2002) 43: 283-290

Li et al. — Pigment analysis and algal community investigations

Phytoplankton pigment analysis by HPLC and its application in algal community investigations

Hsiu-Ping Li1, Gwo-Ching Gong2, and Tung-Ming Hsiung1,*

1Institute of Bioscience and Biotechnology, National Taiwan Ocean University, 202 Keelung, Taiwan

2Department of Oceanography, National Taiwan Ocean University, Keelung, Taiwan

(Received May 29, 2001; Accepted May 28, 2002)

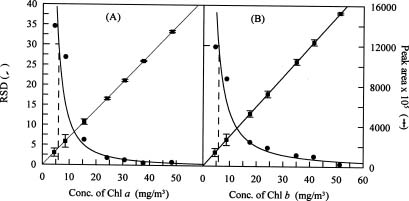
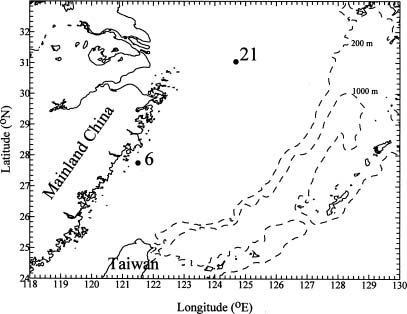
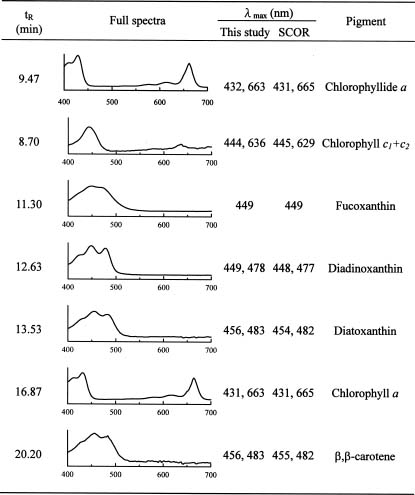
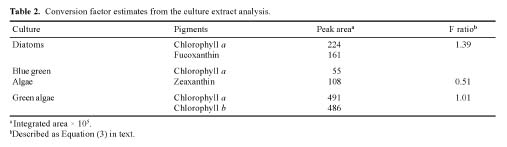
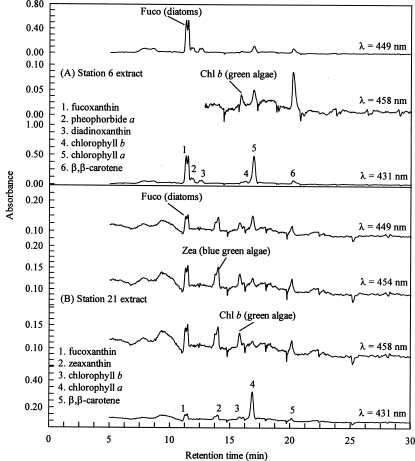
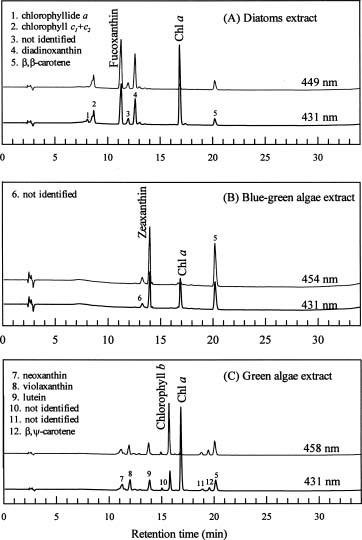
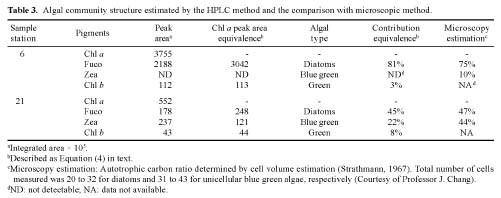
Abstract. A high performance liquid chromatography (HPLC) system for pigment analysis of marine phytoplankton was established. The characteristic quantification limits of the major photosynthetic chlorophylls a and b were 0.29 and 0.27 ng, respectively. The reliability of this method was verified by resolving the marker pigments in culture extracts from diatoms, blue-green algae and green algae. Fucoxanthin, zeaxanthin and chlorophyll b were selected for calculating the chlorophyll a/marker pigment ratios for the three types of algae, which were 1.39, 0.51 and 1.01, respectively. The composition of the phytoplankton community in summer samples, collected from the continental shelf of the East China Sea, was estimated by simple regression of these ratios. When results of composition abundance of diatoms and blue-green algae obtained by this method were compared with those obtained by the microscopic technique, the relative percentage difference was less than 6% for diatoms. On the other hand, a lower abundance of blue-green algae was estimated by the HPLC method.

Keywords: Algal community; HPLC; Marker pigments; Phytoplankton.

Introduction

Marine primary productivity can be referred to as the energy conversion generator for the marine food web. The abundance of marine phytoplankton in the oceans amounts to one-fourth of all plants in the world (Jeffrey and Hallegraeff, 1990). Phytoplankton, then, clearly play a critical role in global carbon fluxes (Falkowski et al., 1998). Chlorophyll a, the major photosynthetic pigment of marine phytoplankton, has been commonly used as an indicator of biomass or primary productivity in the ocean sphere. Various marine phytoplankton can be distinguished by their cellular diameter. For example, the cellular diameter of picoplankton is less than 2 µm, whereas that of nanoplankton or microplankton is larger than 20 µm. It has been reported that the carbon dioxide exchange flux in the oceans is significantly influenced by the size and assemblage of phytoplankton (Takahashi et al., 1993; Balch et al., 1996; Rivkin et al., 1996). Therefore, the distribution of, and variations in, the phytoplankton community, including in the chlorophyll contents, is critical in the study of marine carbon cycles.

Spectrophotometry and fluorometry are usually used to measure chlorophyll a (Lorenzen, 1967; Jeffrey and Humphrey, 1975). The former method is less sensitive and requires a large sample volume. Also, an appropriate empirical equation must be chosen (Jeffrey and Humphery, 1975; Porra et al., 1989). Despite having greater sensitivity, the fluorometric method tends to underestimate chloro

phyll a when chlorophyll b is unequally distributed in the water (Gieskes, 1991). Earlier investigations of these two methods have shown that their accuracy depended on the sample matrix and the calculation equations used (Lorenzen and Jeffrey, 1980; Wright and Jeffrey, 1997).

Thus far, most studies of phytoplankton communities have employed microscopy, using specific fixing agents for different algae. Pretreatment steps have included filtration and staining, and species identification and counting have been performed using light, fluorescence, or electron microscopy. Microscopy has been far from ideal, however. Obtaining data with high density and high frequency is somewhat difficult since the method requires experienced specialists and considerable time. Furthermore, some picoplankton, such as prochlorophyta, which possibly contributes to sea productivity, cannot be identified by microscopy (Chisholm et al., 1988). Flow-cytometric analysis has been developed for phytoplankton identification, but it must be based on a full understanding of the optical-characteristics of the species. Furthermore, flow-cytometry cannot be employed to measure large phytoplanktons (Jeffrey et al., 1999).

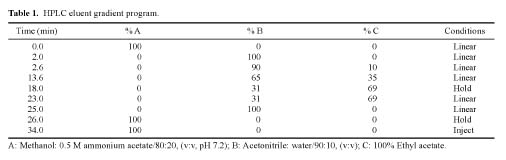
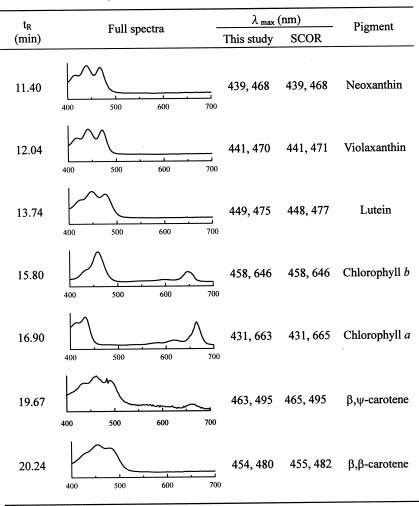
To overcome some of the inadequacies of microscopy, high performance liquid chromatography (HPLC) pigment method has been investigated in recent years to obtain both accurate chlorophyll a data and detailed information about the composition of phytoplankton communities (Mantoura and Llewellyn, 1983). This method is based on the premise that different algal classes have specific signature, or marker, pigments. For example, fucoxanthin, zeaxanthin, and chlorophyll b have been selected as taxonomical pigments for bacillariophyta (diatoms),

*Corresponding author. Tel: 886-2-24622192 ext. 5515; Fax: 886-2-24634243; E-mail: tmhsiung@mail.ntou.edu.tw


Botanical Bulletin of Academia Sinica, Vol. 43, 2002

cyanobacteria (blue-green algae), and chlorophyta (green algae), respectively (Stauber and Jeffrey, 1988; Millie et al., 1993; Jeffrey and Vest, 1997). Each marker pigment concentration can be further expressed as a percentage of the chlorophyll a value for a specific algal class, with a suitable conversion factor used to estimate the relative distribution of each algal class in the sample (Wright et al., 1996; Obayashi et al., 2001).

In spite of the superiority of the HPLC method, traditional fluorometry and microscopy continue to be used to study chlorophyll content and phytoplankton assemblage in the East China Sea region (Gong et al., 1995, 1996; Chiang et al., 1999; Chang et al., 2000). In our investigation, for the very first time the HPLC method developed by the Joint Global Ocean Flux Study (Wright et al., 1991; Wright and Jeffrey, 1997) was considered to measure photosynthetic pigments in the region. Based on the findings, the method's applicability for estimating the phytoplankton population density of the East China Sea is discussed.

Materials and Methods

HPLC System

Measurements were performed using a Waters HPLC system, which included a Waters 600 pump (flow rate 1 mL/min), a 717 plus autosampler (50 µL sampling loop, at 4°C), a Waters 996 photodiode array detector (1 cm light path quartz flow cell) and a 4 µm C-18 reverse phase column (Nova-Pak, 3.9 × 300 mm, Waters).

The mobile phase was a gradient mixture of three eluents prepared from Merck Chemicals. They were (A) methanol: 0.5 M ammonium acetate/80:20 (v:v, pH 7.2), (B) acetonitrile: water/90:10 (v:v), and (C) 100% ethyl acetate. The eluent gradient program is listed in Table 1. Thirty-four min were required per measurement.

Concentration Calibration of Chlorophylls a and b

Calibration standards for chlorophylls a and b (Sigma) were prepared in acetone from their pure substances. The absorbance was measured with a spectrophotometer (Lambda 900, PerkinsElmer), and the concentration of each

standard was calculated by substituting the known extinction coefficients (Jeffrey and Humphery, 1975; Lichtenthaler and Wellburn, 1983) into these equations:

Chl a (mg m-3) = (A662.7 nm _ A750 nm)/(ea×b) ×106; and (1)

Chl b (mg m-3) = (A645 nm _ A750 nm)/(eb×b) ×106, (2)

where A662.7, A645 and A750 were the absorbance at 662.7, 645 and 750 nm, respectively, and b was the light path length of the cuvette. Specific extinction coefficients of chlorophylls a and b were 88.15 Lg-1cm-1 (ea) and 56.11 Lg-1cm-1 (eb), respectively.

Microalgal Cultures and Culture Extract

Three species of alga, Thalassiosira weissflogii (clone vic), Synechococcus bacillaris (clone SYN/CCMP 1333) and Tetraselmis chui (clone TA), representing diatoms, blue-green algae, and green algae, respectively, were grown in our laboratory (Courtesy of Professor J. Chang). The media compositions and culture procedures of Guillard (1983) were employed. One hundred mL of filtered seawater (Whatman GF/F, 0.7 µm) was poured into 125 mL Erlenmeyer flasks, and nutrient, metal and vitamin solutions were added. The flasks were plugged with non-absorbent cotton and autoclaved at 121°C for 35 min. After cooling to room temperature, 3 mL of aged algae culture were added, and the suspension was stirred to homogeneity. The cultures were incubated under fluorescent light under 12:12, light:dark cycles. The sub-culture period for algal growth was one week.

Algae were collected by filtering the sample through a glass fiber membrane (Whatman GF/F, 0.7 µm, <100 mmHg). For pigment extraction, 10 mL of acetone and the glass fiber membrane were placed in a 15 mL polypropylene (PP) centrifuge tube and were ground with a Teflon pestle. The tubes were then placed in a 4°C incubator and shaken in darkness for 8 h. After high speed centrifugation, the supernatant was subjected to pigment analysis by HPLC.

Marker Pigments and Conversion Factors

It has been reported that biliprotein and divinyl chlorophylls a or b were the major marker pigments of blue-green algae (Chisholm et al., 1988; Goericke and Repeta, 1992; Goericke and Repeta, 1993; Jeffrey and Vest,


Li et al. — Pigment analysis and algal community investigations

1997). However, biliprotein is hydrophilic, and divinyl chlorophylls a and b could not be resolved by the monomeric C-18 column system. Thus, our HPLC method does not enable measurements of those three pigments. Accordingly, as employed by Stauber and Jeffrey (1988), fucoxanthin, zeaxanthin, and chlorophyll b were selected as marker pigments for diatoms, blue-green algae, and green algae, respectively.

Commercially purified pigments were not available, other than those of chlorophylls a and b. Thus, the pigments were identified by absorption spectra, based on their retention times. The absorption spectra have been published by the Scientific Committee on Oceanic Research (SCOR) and are used for comparing fingerprints (Jeffrey et al., 1997). The chlorophyll a/marker pigment ratio, or the conversion factor, was calculated at the peak area, rather than the concentration. The equation used was:

(3)

where dt and represented the integrated peak area at lmax for chlorophyll a and the individual pigments as evident in a separate chromatogram.

Field Sample and Algal Species Distribution

To examine the feasibility of our method for investigating the distribution of phytoplankton communities in the East China Sea (Figure 1), surface water samples collected at Stations 6 and 21 on the R/V Ocean Researcher I, Cruise 521 (June 28 - July 7, 1998), representing the inner and middle shores, respectively, were analyzed. The filtered sample volumes were 730 and 1,680 mL, or values equal to the concentration factors of 73 and 168, respectively. The filter papers were wrapped in aluminum foil and frozen in liquid nitrogen for storage.

Figure 2. Detection limits corresponding to RSD = 30% (n=7): (A) 5.8 mg/m3 for chlorophyll a; (B) 5.4 mg/m3 for chlorophyll b.

After analyzing the extract by HPLC, specified pigment peak areas were converted to their chlorophyll a value equivalents, using previously derived pigment/chlorophyll a ratios. The relative distribution of algal classes was obtained from the ratios of chlorophyll a value equivalents to the total chlorophyll a value. The equation used was:

(4)

Results

Quantitative Analysis of Chlorophylls a and b

Well-resolved chromatograms were observed for chlorophylls a and b when the l value was set at 431 nm, and the retention times for chlorophylls a and b were 16.9 and 15.7 min, respectively. Because of higher sensitivity and less overlapping with chlorophyll b when the l value was set at 458 nm, we selected chromatograms with specific wavelengths for the individual pigment analysis.

In this investigation, the corrected calibration standards ranged from 80 to 640 mg/m3 for chlorophyll a and from 32 to 256 mg/m3 for chlorophyll b. The detection limit was determined from seven standard solutions of different concentrations, and a relative standard deviation (RSD) of seven replicated measurements for each standard were calculated. After calculating the regression of RSD against concentration, the concentration corresponding to an RSD of 30% was determined as the detection limit. As shown in Figure 2, the detection limits of chlorophylls a and b were, respectively, 5.8 mg/m3 and 5.4 mg/m3. Thus, based on 100-fold concentration and 50 µL injection volume, 0.29 ng and 0.27 ng represented the characteristic quantification limits of chlorophylls a and b, respectively.

Results of Laboratory-Prepared Culture Extracts

The analysis of diatoms from full spectra fingerprint-matching revealed that the ranking of the pigments with respect to retention time was, in ascending order, chlorophyllide a, chlorophyllc1+c2, fucoxanthin, diadinoxanthin, diatoxanthin, chlorophyll a, and b,b-carotene (Figure 3). Three pigments—zeaxanthin, chlorophyll

Figure 1. Map showing sampling stations. (RVI/CR521/Summer/1998).


Botanical Bulletin of Academia Sinica, Vol. 43, 2002

Figure 5. Full spectra of the pigments of the green algae extract.

Figure 3. Full spectra of the pigments of the diatom extract.

a, and b,b-carotene—were detected in the blue-green algae extract (Figure 4), and six pigments—neoxanthin, violaxanthin, lutein, chlorophyll b, chlorophyll a, and b,b-carotene (Figure 5)—were identified in the green algae extract. The pigments in the three algae were previously observed by Jeffrey et al. (1997). However, our results differed slightly in lmax from those of SCOR, possibly resulting from variations in wavelength calibrations and eluents.

In Figure 6, fucoxanthin (tR = 11.3 min), zeaxanthin (tR = 14.0 min), and chlorophyll b (tR = 15.8 min) were employed for calculating the conversion factors for diatoms, blue-green algae and green algae, respectively. To prevent overestimations by possibly overlapping peaks, only peaks to the left were integrated for chlorophyll b and fucoxanthin, and peaks to the right for zeaxanthin.

Figure 4. Full spectra of the pigments of the blue-green algae extract.


Li et al. — Pigment analysis and algal community investigations

Based on these estimates, the resultant F ratios (Table 2) were 1.39 for diatoms, 0.51 for blue-green algae, and 1.01 for green algae. Since the F ratios were calculated from the integrated values at each individual lmax for every pigment, their comparison with ratios reported by other authors may be misleading. We did, nevertheless, evaluate a chromatogram of the green algae extract at l=431 nm, and the chlorophyll b/chlorophyll a ratio showed an F value of 1.47, which is within the range of 1.5-3 of other authors (Peeken, 1997).

Results of Field Samples and Algal Species Distribution

Chromatograms at l=431 nm of pigments from samples at Stations 6 and 21 are shown in Figure 7. Six major pigments were evident at Station 6 (Figure 7A), and five at Station 21 (Figure 7B). By external spectrum fingerprint-matching, fucoxanthin, pheophorbide a, diadinoxanthin, chlorophyll b, chlorophyll a and b,b-carotene were identified in the sample from Station 6. Fucoxanthin, zeaxanthin, chlorophyll b, chlorophyll a, and b,b-carotene were observed in the Station 21 sample. Chlorophylls a and b were

Figure 7. Chromatograms of the extract of the seawater sample, marker pigments fucoxanthin (diatoms), zeaxanthin (blue green algae) and chlorophyll b (green algae) were identified by full spectra, and quantitative integration at individual lmax. (A) Extract of Station 6 sample. (B) Extract of Station 21 sample.

7.97 and 0.24 mg/m3 at Station 6, and 1.16 and 0.09 mg/m3 at Station 21, respectively. The marker pigment fucoxanthin of diatoms as well as a trace of chlorophyll b for green algae was observed at both stations. At Station 21, the occurrence of blue-green algae was also indicated by the finding of zeaxanthin.

As evident in Table 3, at Station 6, estimates of abundances were as high as 81% for diatoms and as low as 3% for green algae. At Station 21, the amount of diatoms comprised 45%, blue-green algae 22%, and green algae a mere 8%.

Discussion

The algal distributions found by the HPLC method were compared with the autotrophic carbon ratios generated by the microscopic technique (Courtesy of Professor J. Chang). The error between the two methods was less than 6% for diatoms (Table 3). For the blue-green algae at Station 21, the autotrophic carbon ratio (44%) was double that found by HPLC (22%). Since these blue-green algae belong to the smaller-sized phytoplankton and have a higher carbon/chlorophyll ratio (Geider, 1987), overestimation of abundance is common with the autotrophic carbon ratio method. At Station 6, however, the abundance of blue-green algae could not be calculated by the HPLC method because the pigment concentration was below the detection limit of the method.

Figure 6. Chromatograms of cultured algal extract by HPLC pigment analysis at specific wavelength: (A) Diatoms; (B) Blue-green algae; and (C) Green algae.


Botanical Bulletin of Academia Sinica, Vol. 43, 2002

The abundance of phytoplankton as revealed by the HPLC method was based on the assumption that marker pigments specific to one algal group do not exist in other algal groups. Since the prymnesiophyceae also possess fucoxanthin, subtraction by the multiple regression method is required to accurately determine the abundance. However, prymnesiophyceae were probably negligible, in as much as other major identifying pigments of this group, namely 19'-butanoyloxyfucoxanthin and 19-hexanoyloxyfucoxanthin, were also undetected in the field sample. Based on these data, it can be reasonably concluded that the HPLC method has advantages over microscopic observation for investigating algal distribution.

The advantage of conducting seawater pigment analysis in the East China Sea by HPLC, using a C-18 column, has been demonstrated. The method yields accurate quantitative data for major photosynthetic pigments, such as chlorophylls a and b. The pigments fucoxanthin, zeaxanthin and chlorophyll b in diatoms, blue-green algae, and green algae can be measured with this method and used for calculating their conversion factors, which were 1.39, 0.51 and 1.01 in this study, respectively. The algal abundance estimations by the HPLC method were consistent with the autotrophic carbon ratios disclosed by the microscopic method for diatoms. Further study of the chemotoxonomy of the East China Sea using the HPLC method is currently in progress.

Acknowledgements. We are grateful to the officers and crew of the Ocean Research I for their assistance in sampling. We are also thankful for the constructive suggestions and comments by Professors. J. Chang and K.P. Chiang. Appreciation is also due to Mr. W.D. Lucas who helped to improve the use of English in the manuscript. This work was supported by Grant NSC89-2611-M-025-OP3 from the National Science Council (ROC).

Literature Cited

Balch, W.M., K.A. Kilpatrick, P.M. Holligan, and C. Trees. 1996. The 1991 coccolithophore bloom in the central North

Atlantic. 1. Optical properties and factors affecting their distribution. Limnol. Oceanogr. 41: 1669-1683.

Chang, J., K.P. Chiang, and G.C. Gong. 2000. Seasonal variation and cross-shelf distribution of the nitrogen-fixing cyanobacterium, Trichodesmium, in southern East China Sea. Cont. Shelf Res. 20: 479-492.

Chiang, K.P., Y.T. Chen, and G.C. Gong. 1999. Spring distribution of diatom assemblage in the East China Sea. Mar. Ecol. Prog. Ser. 186: 75-86.

Chisholm, S.W., R.J. Olson, E.R. Zettler, R. Goericke, J.B. Waterbury, and J.B. Welschmeyer. 1988. A novel free-living prochlorophyte abundant in the oceanic euphotic zone. Nature 334: 340-343.

Falkowski, P.G., R.T. Barber, and V. Smetacek. 1998. Biogeochemical controls and feedbacks on ocean primary production. Science 281: 200-206.

Geider, R.J. 1987. Light and temperature dependence of the carbon to chlorophyll a ratio in microalgae and cyanobacteria: implications for physiology and growth of phytoplankton. New Phytol. 106: 1-34.

Gieskes, W.W.C. 1991. Algal pigment fingerprints: clue to taxon-specific abundance, productivity and degradation of phytoplankton in seas and oceans. In S. Demers (ed.), Particle Analysis in Oceanography. NATO ASI Ser. Vol. G27, pp. 61-99.

Goericke, R. and D.J. Repeta. 1992. The pigments of Prochlorococcus marinus: The presence of divinyl chlorophyll a and b in a marine prokaryote. Limnol. Oceanogr. 37: 425-433.

Goericke, R. and D.J. Repeta. 1993. Chlorophylls a and b and divinyl chlorophylls a and b in the open subtropical North Atlantic Ocean. Mar. Ecol. Prog. Ser. 101: 307-313.

Gong, G.C., W.R. Yang, and J. Chang. 1995. In vivo fluorescence-derived chlorophyll a concentrations in the southern East China Sea. Acta Oceanographica Taiwanica 34: 73-85.

Gong, G.C., Y.L. Chen, and K.K. Liu. 1996. Summertime hydrography and chlorophyll a distribution in the East China Sea in summer: Implications of nutrient dynamics. Cont. Shelf Res. 16: 1561-1590.

Guillard, R.R.L. 1983. Culture of phytoplankton for feeding marine invertebrates. In C.J. Berg Jr. (ed.), Culture of Ma


Li et al. — Pigment analysis and algal community investigations

rine Invertebrates: Selected Readings. Hutchinson Ross Publ. Co. Stroudsberg, Pensylvania, pp. 109-132.

Jeffrey, S.W. and G.M. Hallegraeff. 1990. Phytoplankton ecology of Australian waters. In M.N. Clayton and R.J. King (eds.), Biology of Marine Plants. Longman Cheshire, pp. 310-348.

Jeffrey, S.W. and G.F. Humphrey. 1975. New spectrophotometric equations for determining chlorophylls a, b, c1 and c2 in higher plants, algae and natural phytoplankton. Biochem. Physiol. Pflanzen 167: 191-194.

Jeffrey, S.W., R.F.C. Mantoura, and T. Bjřrland. 1997. Data for identification of 47 key phytoplankton pigments. In S.W. Jeffrey, R.F.C. Mantoura, and S.W. Wright (eds.), Phytoplankton Pigments in Oceanography, UNESCO, Paris, pp. 449-559.

Jeffrey, S.W. and M. Vest. 1997. Introduction to marine phytoplankton and their pigment signatures. In S.W. Jeffrey, R.F.C. Mantoura, and S.W. Wright (eds.), Phytoplankton Pigments in Oceanography, UNESCO, Paris, pp. 37-84.

Jeffrey, S.W., S.W. Wright, and M. Zapata. 1999. Recent advances in HPLC pigment analysis of phytoplankton. Mar. Freshwater Res. 50: 879-896.

Lichtenthaler, H.K. and A.R. Wellburn. 1983. Determination of total carotenoids and chlorophylls a and b of leaf extracts in different solvents. Biochem. Soc. Trans. 11: 591-592.

Lorenzen, C.J. 1967. Determination of chlorophyll and pheopigments: spectrophotopmetric equations. Limnol. Oceanogr. 12: 343-346.

Lorenzen, C.J. and S.W. Jeffrey. 1980. Determination of Chlorophyll in Seawater: Report of Intercalibration Tests. UNESCO Technical Papers in Marine Science 35.

Mantoura, R.F.C. and C.A. Llewellyn. 1983. The rapid determination of algal chlorophyll and carotenoid pigments and their breakdown products in natural waters by reverse-phase high-performance liquid chromatography. Anal. Chim. Acta. 151: 297-314.

Millie, D.F., H.W. Paerl, J.P. Hurley, and G.J. Kirkpatrick. 1993. Algal pigment determinations in aquatic ecosystems: analytical evaluations, applications and recommendations. Current Topics Bot. Res. 1: 1-13.

Obayashi, Y., E. Tanoue, K. Suzuki, N. Handa, Y. Nojiri, and C.S. Wong. 2001. Spatial and temporal variabilities of phytoplankton community structure in the northern North Pacific as determined by phytoplankton pigments. Deep-Sea

Res. I 48: 439-469.

Peeken, I. 1997. Photosythetic pigment fingerprints as indicators of phytoplankton biomass and development in different water masses of the Southern Ocean during austral spring. Deep-Sea Res. II 44: 261-282.

Porra, R.J., W.A. Thompson, and P.E. Kriedemann. 1989. Determination of accurate extinction coefficients and simultaneous equations for assaying chlorophylls a and b extracted with four different solvents: verification of the concentration of chlorophyll standards by atomic absorption spectroscopy. Biochim. Biophys. Acta 975: 384-394.

Rivkin, R.B., L. Legendre, D. Deibel, J.E. Trembley, B. Klein, K. Crocker, S. Roy, N. Silverberg, C. Lovejoy, F. Mesple, N. Romero, M.R. Anderson, P. Matthews, C. Savenkoff, A. Vezina, J.C. Therriault, J. Wesson, C. Berube, and R.G. Ingram. 1996. Vertical flux of biogenic carbon in the ocean: Is there food web control? Science 272: 1163-1166.

Stauber, J.L. and S.W. Jeffrey. 1988. Photosynthetic pigments in fifty-one species of marine diatoms. J. Phycol. 24: 158-172.

Strathmann, R.R. 1967. Estimating the organic carbon content of phytoplankton from cell volume or plasma volume. Limnol. Oceanogr. 12: 411-418.

Takahashi, T., J. Olafsson, J.G. Goddard, D.W. Chipman, and S.C. Sutherland. 1993. Seasonal variation of CO2 and nutrients in the high-latitude surface oceans: a comparative study. Global Biogeochem. Cycles 7: 843-878.

Wright, S.W., S.W. Jeffrey, R.F.C. Mantoura, C.A. Llewellyn, T. Bjřrland, D. Repta, and N. Welschmeyer. 1991. Improved HPLC method for the analysis of chlorophylls and carotenoids from marine phytoplankton. Mar. Ecol. Prog. Ser. 77: 183-196.

Wright, S.W. and S.W. Jeffrey. 1997. High-resolution HPLC system for chlorophylls and carotenoids of marine phytoplankton. In S.W. Jeffrey, R.F.C. Mantoura, and S.W. Wright (eds.), Phytoplankton Pigments in Oceanography, UNESCO, Paris, pp. 327-341.

Wright, S.W., D.P. Thomas, H.J. Marchant, H.W. Higgins, M.D. Mackey, and D.J. Mackey. 1996. Analysis of phytoplankton of the Australian sector of the Southern Ocean: composition of microscopy and size frequency data with interpretations of pigment HPLC data using the CHEMTAX matrix factorisation program. Mar. Ecol. Prog. Ser. 144: 285-298.


Botanical Bulletin of Academia Sinica, Vol. 43, 2002