Bot. Bull. Acad. Sin. (2003) 44: 159-166

Wang et al. — Spatial pattern of Cryptocarya chinensis

Spatial pattern of Cryptocarya chinensis life stages in lower subtropical forest, China

Zheng-Feng Wang1,*, Shao-Lin Peng1, Shi-Zhong Liu1, and Zhen Li2

1South China Institute of Botany, Chinese Academy of Sciences, Guangzhou 510650, P. R. China

2School of Life Sciences, Zhongshan University, Guangzhou 510275, P. R. China

(Received April 2, 2002; Accepted December 3, 2002)

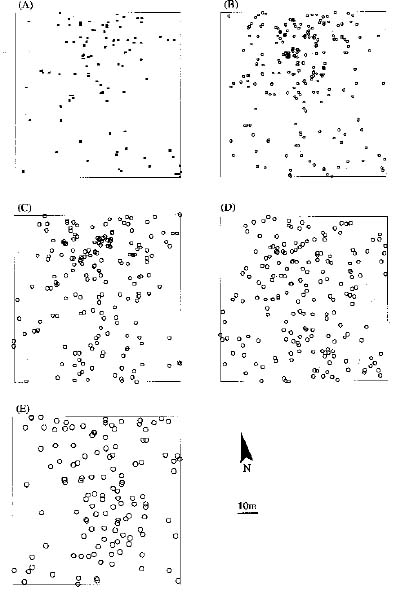
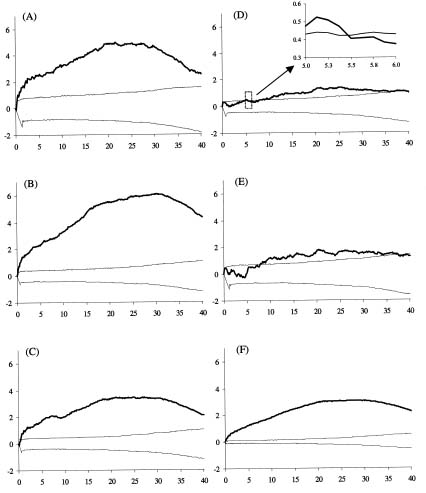
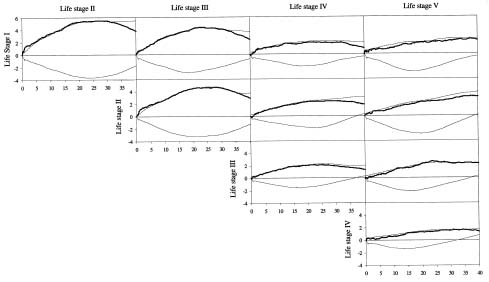
Abstract. Two aspects of life stages are important determinants in the spatial pattern of plant populations: one is spatial distribution of individual plants within life stages; the other is spatial association between different life stages. Using Ripley's univariate L(t) and bivariate L12(t) functions, we analyzed the spatial pattern within and between life stages of Cryptocarya chinensis in an 80 m × 80 m plot in lower subtropical China. Based on stem diameter and height, five life stages (I, II, III, IV, V) were distinguished. Ripley's univariate L(t) function showed clumped distributions within all life stages, with fine-scale random distributions in old life stages VI and V. From the bivariate L12(t) function, young life stages I, II and III appeared significantly attractive to each other at local and intermediate distances, but independently distributed regarding old life stages VI, V at almost all distances. The oldest life stage, V, was independently distributed relative to other life stages. Considering these results, we inferred that the existence of suitable survival environments (e.g. canopy gaps) are a determinant in shaping the spatial pattern of young life stages of C. chinensis; with increasing body size with growth, intraspecific competition develops, and a fine-scale random distribution appears within old life stages.

Keywords: Cryptocarya chinensis; Intraspecific competition; Life stage; Spatial pattern; Spatial statistics.

Introduction

Plant spatial patterns have long been a major issue in ecology (Ashby, 1935; Greig-Smith, 1983), and spatial patterns at various life stages or age classes have received considerable attention in ecological research (e.g. Lu, 1986; Sterner et al., 1986; Rebertus et al., 1989; Liu, 1990; Liang, 1992; Moeur, 1993; Xu and Zheng, 1993; Cai and Song, 1997; Barot et al., 1999; He and Li, 1999; Nanami et al., 1999; Dovciak et al., 2001). Since adults have undergone the life stages of seedlings, saplings and juveniles, an analysis of the spatial patterns of these early life stages may help reveal processes determining the spatial patterns at later life stages.

To do so, two aspects in life stage spatial pattern have to be analyzed. One is spatial distribution of individuals within life stages, and the other is spatial association between different life stages. Both of them represent important aspects of species' spatial pattern. Within life stages, thinning processes might increase distances between individuals of different cohorts and lead to regular distributions (Antonovics and Levin, 1980; Sterner et al., 1986; Kenkel, 1988; Moeur, 1993); On the other hand, offspring might be associated with some "nurse plants" (Callaway and Walker, 1997; Haase, 2001) or escape their conspecific adults due to more predation/pathogen in the periphery

of adults (Smith and Goodman, 1987; also see Barot et al., 1999), leading either to positive or negative associations between life stages. Environmental heterogeneity, seed dispersal and other factors also influence spatial patterns (Duncan, 1991; Barot et al., 1999; Dovciak et al., 2001).

Moreover, numerous studies have demonstrated that an individual plant competes for nutrient resources with its immediate neighbors (Mack and Harper, 1977; Antonovics and Levin, 1980; Connell et al., 1984; Moeur, 1993; Barot et al., 1999), leading to changes in the spatial patterns within and between life stages on both a small and large scale. Therefore, analysis of spatial pattern within and between life stages at different spatial ranges will aid in interpreting the species spatial and temporal dynamics during species population development.

In lower subtropical China there have been no reports to date of plant spatial pattern in different life stages at different distance ranges. Here we present our research on Cryptocarya chinensis (Hance) Hemsl. (Lauranceae) in this region. Our aim was to (1) detect the dynamic aspects of spatial pattern at different life stages; (2) examine the spatial association between life stages; and to (3) discuss the possible mechanisms shaping the species spatial pattern. As one project to study the role of the spatial dynamics in determining species response to forest fragmentation on time scales of generation, our study, using C. chinensis in continuous lower subtropical monsoon evergreen broad-leaved forest, will also provide baseline information on the natural dynamics of C. chinensis.

*Corresponding author. Tel: +86-20-85232862; Fax: +86-20-85232615; E-mail: wzf@scib.ac.cn


Botanical Bulletin of Academia Sinica, Vol. 44, 2003

To measure spatial pattern, quadrat-based methods have been the most widely used (Greig-Smith, 1983) and have been the main methods of detecting spatial pattern of C. chinensis in previous studies (Lu, 1982, 1986; Peng and Wang, 1984; Peng and Fang, 1994). The results, however, were inconsistent: Lu (1982), Peng and Wang (1984) and Peng and Fang (1984) detected clumped patterns of C. chinensis while Lu (1986) detected random distributions. These studies all used 10 m × 10 m quadrats, and the quadrat number varied: forty-two (Lu, 1982), fourteen (Peng and Wang, 1984), twelve and sixteen (Lu, 1986), twelve (Peng and Fang, 1994). Therefore, the inconsistent results reflected the fact that using quadrat-based methods, the size of the quadrat must be well fitted with the plant clump size, if it exists. One quadrat size may not be adequate for analyzing spatial patterns because of its lack of resolution of pattern (Lu, 1986; Moeur, 1993; Zhang, 1998).

Over the last decades, efficient spatial statistical methods using point-mapped data have been developed (Ripley, 1977; Diggle, 1983), among which Ripley's L(t) and L12(t) functions have been widely used (Sterner et al., 1986; Kenkel, 1988; Rebertus et al., 1989; Moeur, 1993; Peterson and Squiers, 1995; Barot et al., 1999; Cole and Syms, 1999; Nanami et al., 1999; Haase, 2001; Pélissier and Goreaud, 2001). These analyses consider, not only nearest neighbor pairs, but all the individual pairs at a given distance to characterize spatial patterns. They are therefore more robust than quadrat and nearest neighbor based methods (Moeur, 1993; Zhang, 1998).

Materials and Methods

Species Description

Cryptocarya chiensis is a common evergreen tree, widely distributed in lower subtropical southern China, growing up to 20 meters high (Li, 1982). It is mesophyte (Guangdong Institute of Forest, 1964; Peng and Fang, 1994), climax species in lower subtropical monsoon evergreen broad-leaved forest (He et al., 1991; Kong et al., 1993; Peng and Fang, 1994), occupying canopy and sub-canopy story (Guangdong Institute of Forest, 1964; Zheng, 1983; He et al., 1991). Cryptocarya chinensis is a half-shade tolerant species: high dense canopy will prevent its regeneration (Guangdong Institute of Forest, 1964; Zheng, 1983). In our study field, all of the dead individuals of C. chinensis were found under dense canopy (Wang, Z. F., personal observation).

Trees as large as 5-6 cm in dbh (diameter at breast height) can bear fruits (He, D. Q., personal communication), which are one-seeded drupes, 9-12 mm in diameter (Li, 1982). Seeds of C. chinensis are dispersed by vertebrates (e.g. birds and small mammals) and gravity (Mo, D. S., personal communication).

Site Description

Vegetation in lower subtropical China ranges from grassland to monsoon evergreen broad-leaved forest, including mixed coniferous and evergreen broad-leaved forests, co

niferous forest, shrubland, and others (Wu, 1980; He et al., 1991). Monsoon evergreen broad-leaved forest is zonal typical vegetation, dominated by Leguminosae, Lauraceae, Theaceae, Moraceae, Fagaceae, Melastomaceae, Myrtaceae, Sapindaceae, and Magnoliaceae (Wu, 1980; He et al., 1991; Kong et al., 1993). Because of human activities, the forests have been largely destroyed, and what remains are restricted to several reserves like Dinghushan Biosphere Reserve, where our study site was located.

Dinghushan Biosphere Reserve (DHSBR, 112°30´39"-112°33´41"E, 23°09´21"-23°11´30"N) is located in Guangdong Province, China, near the Tropic of Cancer. It is one of the most important national nature reserves in China. This area was chosen as a forest Ecosystem Station of the Chinese Academy of Sciences in 1978 and as one of the Biosphere Reserves of the MAB programs of UNESCO in 1979 (Kong et al., 1993).

In DHSBR, the mean annual temperature is 20.9°C, and the mean monthly temperature varies from 12°C to 28°C. The mean annual precipitation is 1956 mm. The soil type is lateritic-red earth and red earth (Kong et al., 1997).

Lower subtropical monsoon evergreen broad-leaved forest has been well preserved in DHSBR for at least 400 years and covers a large area of about 125 ha (Kong et al., 1993). Due to low human disturbance, this forest is an ideal place for investigating natural species dynamics (Kong et al., 1993).

Data Collection

In August 2001, an 80 m × 80 m plot (altitude 300 m a.s.l.) was established in the lower subtropical evergreen broad-leaved forest in DHSBR. The plot was divided into 64 quadrats each measuring 10 m × 10 m. All individuals (total 842) of C. chinensis were mapped in x and y coordinates by measuring in each quadrat the distance to the nearest borderline (Figure 1). Stem diameter was recorded for every individual ³ 2.5 cm dbh. Individuals < 2.5 cm dbh were recorded by their height.

The population chosen for this study is in the core area of DHSBR, near the Permanent Research Plot 1 of Dinghushan Forest Ecosystem Research Station of Chinese Academy of Sciences. It has no recorded history of fire disturbance or evidence of planting activities in the past few centuries (Mo, D. S., personal communication). The vegetation structure is continuous, and the site has a homogeneous physiognomy with a slope of about 20°. The complete soil characteristics are not yet available, but no obvious patches of tree species are found in this site (Wang, Z. F., personal observation). Cryptocarya chinensis is a dominant species of the stand, along with other canopy species such as Schima superba Gardn. et Champ., Castanopsis chinensis Hance, C. concinna Hance, Syzygium rehderianum Merr. et Perry and Aporosa yunnanensis (Pax & Hoffm) Metc. The herb level includes Hemigramma decurrens (Hook.) Copel. and Arachniodes exilis (Hance) Ching. Woody vines include Fissistigma glaucescens (Hance) Merr., Mucuna birdwoodiana Tutcher, Calamus rhabdocladus Burret. Epiphytes include


Wang et al. — Spatial pattern of Cryptocarya chinensis

Dischidia chinensis Champ., Pothos chinensis (Raf.) Merr., and Piper arboricola C. DC.

Our interest is in detecting changes in the spatial pattern of different life stages. However, accurate age determination of individuals of C. chinensis is at present impossible, and we used stem diameter and height as parameters to partition this population into different life stages. According to Chu's method (Chu et al., 1952), individuals were classified into five life stages: life stage I (seedlings, height < 0.33 cm, 103 individuals); life stage II (younger saplings, 0.33 £ height < 1 m, 207 individuals); life stage III (older saplings, height ³ 1 m and dbh < 2.5 cm, 213 individuals; life stage IV (juveniles, 2.5£dhb<7.5, 194 individuals); and life stage V (adults, dhb ³ 7.5 cm, 125 individuals).

Spatial Statistics

Within-life-stage distribution of C. chinenese was analyzed using Ripley's univariate L(t) function (transformation of K(t), Ripley, 1977; Diggle, 1983). Ripley's univariate L(t) is calculated from the number of conspecific individuals in concentric circles of radius t around each individual. We calculated L(t) at 0.1 m interval up to half the side of the plot (40 m). Theoretically, when L(t)=0, the spatial pattern is random at the scale of t (null hypothesis of complete spatial randomness); when L(t)<0, the distribution tends to be uniform; and when L(t)>0, the distribution tends to be clumped.

To assess spatial association between life stages, Ripley's bivariate L12(t) function (Lotwick and Silverman,

Figure 1. The spatial distribution of Cryptocarya chinensis in an 80 m × 80 m plot of lower subtropical evergreen broad-leaved forest in Dinghushan Biosphere Reserve, China. (A) life stage I (seedlings, height < 0.33 cm, 103 individuals); (B) life stage II (younger saplings, 0.33 £ height < 1 m, 207 individuals); (C) life stage III (older saplings, height ³ 1 m and dbh < 2.5 cm, 213 individuals); (D) life stage IV (juveniles, 2.5 £ dhb < 7.5, 194 individuals); (E) life stage V (adults, dhb ³ 7.5 cm, 125 individuals).


Botanical Bulletin of Academia Sinica, Vol. 44, 2003

1982; Diggle, 1983) was used. For L12(t), two different statistical null hypotheses correspond to the absence of spatial association between life stages (see Lotwick and Silverman, 1982; Diggle, 1983). Here we considered the different life stages as different sub-populations and used the null hypothesis of independence of the two sub-populations in order to test the spatial association between life stages. Calculation of the bivariate L12(t) function is similar to the one of univariate L(t) function, but considering trees of one life stage as the central points around which neighbors of the other life stage are counted. We also used 0.1 m intervals to compare L12(t). Theoretically, if two life stages are independent at the scale of t, the value of L12(t) would be zero; when L12(t)<0, the two life stages tend to be attractive; and when L12(t)>0, the two life stages tend to be repulsive. Using the bivariate L12(t) function, we tested if young life stages of C. chinenes were associated with old life stages.

Due to random process, both L(t) and L12(t) estimates may fluctuate around their theoretical values. To assess the statistical significance of the deviation from the null hypotheses, L(t) and L12(t) values were compared to 99% confidence envelopes generated from 10,000 Monte Carlo simulations of the null hypotheses. At a given distance, L(t) or L12(t) is significantly different from zero at P<0.01 if the observed value falls above or below the 99% confidence envelope.

For earlier uses of both univariate L(t) and bivariate L12(t) analyses, see Moeur (1993), Zhang (1998), Barot et al. (1999), Nanami et al. (1999), Haase (2001), and with slight modification, Kenkel (1988), Rebertus et al. (1989), Peterson and Squiers (1995). All calculations and simulations were performed using ADS in ADE-4 package (http://pbil.univ-lyonl.fr/ADE-4/; Thioulouse et al., 1997).

To check if young life stages were distanced away from old life stages, we also calculated the mean nearest neighbor distance between life stages.

Results

The spatial patterns detected by Ripley's univariate L(t) function showed an overall significantly clumped distribution of C. chinensis individuals (Figure 2F), as well as significant clumped patterns within each life stage (Figure 2 A-E).

Life stages I, II and III were significantly clumped at almost all distances (Figure 2A-C), while mostly random distributions were found in life stage IV (Figure 2D) and life stage V (Figure 2E) in the range 0-8 m, indicating that old life stages were spaced farther apart than were young life stages at small distances.

The spatial association, tested using Ripley's bivariate L12(t) function, revealed a tendency towards attraction among the different life stages. Attraction between young life stages was more significant than between young and old life stages. For example, life stage I and life stages II, III showed significant attractions at various distances, while non-significant attractions were found between life

Figure 2. Univariate L(t) function of (A) life stage I; (B) life stage II; (C) life stage III; (D) life stage IV; (E) life stage V; (F) all individuals; Thick line: observed distribution; Thin lines: 99% confidence envelope.

stage I and life stages IV, V at most distances (Figure 3). A significant attraction was also detected between life stages II and III, in contrast to the pattern between life stage II and life stages IV, V. This suggests a spatial independence between the young and old life stages: young life stage trees were distributed closer to each other than to the old life stage trees.

Disscussion

Within Life Stages Spatial Patterns

Unlike the previous studies, which only detected spatial pattern of C. chinensis in one scale (10 m × 10 m) and had inconsistent results (Lu, 1982, 1986; Peng and Wang, 1984; Peng and Fang, 1994, see introduction section), our results showed that the spatial pattern of C. chinensis varied at different distance scales and life stages. In addition, the area of 10 m × 10 m was corresponding to a circle (the mode of Ripley's univariate L(t) function) with radius of ~5.64 m. At this distance, the overall spatial pattern of C. chinensis was clumped (Figure 2F). Life stages I, II and III were clumped (Figure 2A-C), and life stages IV and V were random (Figure 2D, E). This could partly explain the inconsistent results of previous studies, the use of different or overlapping life stages. Both Lu (1982) and Peng and Wang (1984) used individuals higher than 1.5 m, which represented overlapping life stages, but the life stage information is not available from either Lu (1986) or Peng and Fang


Wang et al. — Spatial pattern of Cryptocarya chinensis

(1994). However, the use of different communities (Hou and Han, 1997; Barot et al., 1999) and different development stages of the community (Zhang et al., 1999) may also contribute to the inconsistency.

Traditionally, theory hypothesized that the spatial pattern of forest stands experiencing competitive thinning should become more regular with time (Sterner et al., 1986; Kenkel, 1988; Duncan, 1991; Moeur, 1993). However, it is not a generalization. Many other studies have suggested that initial clumped distributions may become simply less clumped (He and Li, 1999) or random across life stages (Lu, 1986; Liu, 1990; Liang, 1992; Xu and Zheng, 1993; Cai and Song, 1997; Dovciak et al., 2001). Our study also failed to detect regular patterns in adult trees, maybe partly because our adult trees were multiage (Hughes, 1988; Kenkel, 1988): differences in body sizes might have decreased inter-individual competition. It has also been suggested that both biotic (Peterson and Squiers, 1995; Nanami et al., 1999) and abiotic factors (Rebertus et al., 1989; Duncan, 1991; Berg and Hamrick, 1994; Barot et al., 1999) might influence shifting from clumped to regular spatial patterns.

The spatial pattern of C. chinensis was not significantly different from a random distribution at local distances (0-8 m) at old life stages, but it was significantly clumped beyond this distance (Figure 2D, E). The clumped distribution was significant at almost the entire 40 m range for young life stages (Figure 2A-C). These results indicate that intraspecific interactions occurred at the local level during later development stages. We proposed that 8 m would characterize the "area of influence" or "ecologically effective distance" (Kenkel, 1988) or "local inhibition zone" (Moeur, 1993) for mature individuals of C. chinensis. Moreover, these results agreed with the suggestion that individuals only compete with immediate neighbors.

Comparing changes in spatial pattern across life stages, we found that effects of within-life-stages competition

were visible from stage VI though the competition might have started at earlier stages (see Dovciak et al., 2001).

Between Life Stages Spatial Patterns

Only a few studies so far have considered the spatial association among life stages (Barot et al., 1999; Nanami et al., 1999; Dovciak et al., 2001).

In our study, a clear trend was that young life stage (I, II, III) trees were positively associated with each other and independently distributed relative to old life stage (IV, V) trees, especially at local and intermediate distances. At larger distances, almost all life stages were independent (Figure 3).

Adult trees (life stage V) were independently distributed relative to other life stages at most distances. This distribution pattern did not agree with the escape hypothesis stipulating that offspring are strongly affected by escape from conspecific adult neighbors, gradually creating a significant repulsive pattern (Wada and Ribbens, 1997; Barot et al., 1999). If it really happened, we would expect repulsion between life stage V and the other life stages, but this was not observed. From the mean nearest neighbor distance, we only saw life stage I a little closer to life stage V (3.4 m) than to life stage IV (3.7 m). In addition, no sharp distance changes occurred between life stage V and life stage II (3.2 m) or III (3.6 m). The independent distribution between life stage V and other life stages suggests that the growth of offspring depends on random occurrences of suitable environments.

Although Dovciak et al. (2001) did not observe escape evidence either, our results differ from theirs. At stand scale, they found that large size classes were distributed closer to adult trees than younger size classes, which they attributed to environmental heterogeneity (Dovciak et al., 2001).

Figure 3. Bivariate L12(t) function between life stages; Thick line: observed distribution; Thin lines: 99% confidence envelope.


Botanical Bulletin of Academia Sinica, Vol. 44, 2003

In other cases, the dioecy in species also had effects on the spatial relationship between offspring and female or male adults (Barot et al., 1999; Nanami et al., 1999). However, such influences did not exist in our study, because C. chinensis was hermaphrodite. All mature adults were responsible for the spatial pattern in offspring, which pattern was mainly shaped by seed dispersal and resource competition.

We were, however, not surprised that young life stages were significantly positively associated with each other at local and intermediate distances because they were not large enough to experience inter-individual competition. Similar results were also reported for a tropical palm tree Borassus aethiopum (Barot et al., 1999).

Spatial and Temporal Dynamics

Based on these results, we suggest that the spatial pattern of C. chinensis resulted from two phases.

Early establishment phase. Although seed dispersal mode of C. chinensis is not yet available, if it was the main factor influencing C. chinensis spatial pattern, we would expect attractive (shelter environments in the periphery of adults) or repulsive (escape from adults) distribution between young and old life stages. This was not the case.

Considering the significant fine-scale clumped distribution within young life stages, fine-scale random distribution within old life stages and independent distribution between young life stages and old life stages, we propose the existence of suitable survival environments as a major determinant of the spatial pattern of C. chinensis' young life stages. Although what constitutes suitable environments for seedling and sapling survival is still unclear, canopy gaps could be of particular importance for the regeneration of this species in lower subtropical monsoon evergreen broad-leaved forests. In or near suitable canopy gaps, the seedling and sapling may become established in clumps. This interpretation is supported by the half-shade tolerant characteristics of C. chinensis, for which high dense canopy precludes regeneration (Guangdong Institute of Forest, 1964; Zheng, 1983).

Later intraspecific competition phase. Our results suggest that, as individuals grow in body size over time, intraspecific competition probably increases. This was supported by the local random pattern found in life stages IV and V (also see Haase et al., 1996).

Further studies are however needed to understand how and to what extent light, other environmental factors, and inter-specific competition influence the spatial pattern of our study species.

Acknowledgements. We thank R. Pélissier and one anonymous reviewer for their comments on the manuscript. This work was supported by the International Foundation for Science (No. D/3239-1) and Natural Science Foundation of Guangdong Province (003031).

Literature Cited

Antonovics, J. and D.A. Levin. 1980. The ecological and genetic consequences of density-dependent regulation in plants. Ann. Rev. Ecol. Sys. 11: 411-452.

Ashby, E. 1935. Quantitative analysis of vegetation. Ann. Bot. 49: 779-802.

Barot, S., J. Gignoux, and J. Menaut. 1999. Demography of a savanna palm tree: predictions from comprehensive spatial pattern analyses. Ecology 80: 1987-2005.

Berg, E.E. and J.L. Hamrick. 1994. Spatial and genetic structure of two sandhills oaks: Quercus laevis and Quercus margaretta (Fagaceae). Am. J. Bot. 81: 7-14.

Cai, F. and Y. Song. 1997. A study on the structure and dynamics of Schima superba population on Wuyi Mountain. Acta. Phytoecol. Sin. 21: 138-148.

Callaway, R.M. and L.R. Walker. 1997. Competition and facilitation: a synthetic approach to interactions in plant communities. Ecology 78: 1958-1965.

Chu, C.H., C.W. Wen, and K.K. Chu. 1952. An analytical study of the forest of the spirit valley, Nanking. Acta. Bot. Sin. 1: 18-49.

Cole, R.G. and C. Syms. 1999. Using spatial pattern analysis to distinguish causes of mortality: an example from kelp in north-eastern New Zealand. J. Ecol. 87: 963-972.

Connell, J.H., J.G. Tracey, and L.J. Webb. 1984. Compensatory recruitment, growth, and mortality as factors maintaining rain forest tree diversity. Ecol. Mono. 54: 141-164.

Diggle, P.J. 1983. Statistical Analysis of Spatial Point Patterns. Academic Press, London.

Dovciak, M., L.E. Frelich, and P.B. Reich. 2001. Discordance in spatial patterns of white pine (Pinus strobus) size-classes in a patchy near-boreal forest. J. Ecol. 89: 280-291.

Duncan, R.P. 1991. Competition and the coexistence of species in a mixed podocarp stand. J. Ecol. 79: 1073-1084.

Greig-Smith, P. 1983. Quantitative Plant Ecology, 3rd edn. Blackwell Scientific Publication, London.

Guangdong Institute of Forest (ed.). 1964. Main Economical tree in Hainan, China. Agriculture Press, Beijing, China

Haase, P. 2001. Can isotropy vs. anisotropy in the spatial association of plant species reveal physical vs. biotic facilitation? J. Veg. Sci. 12: 127-136.

Haase, P., F.I. Pugnaire, S.C. Clark, and L.D. Incoll. 1996. Spatial patterns in a two-tiered semi-arid shrubland in south-eastern Spain. J. Veg. Sci. 7: 527-534.

He, D.Q., H.X. Ao, and D.Q. Wu. 1991. Vegetation in Guangdong Mountains. Guangdong Scientific Press, Guangzhou, China.

He, Y. and C. Li. 1999. The ecological geographic distribution, spatial pattern and collecting history of Cycas panzhihuaensis populations. Acta. Phytoecol. Sin. 23: 23-30.

Hou, X. and J. Han. 1997. Simulation analysis of spatial patterns of main species in the Korean-pine broadleaved forest in Changbai Mountain. Acta. Phytoecol. Sin. 21: 242-249.

Hughes, G. 1988. Spatial dynamics of self-thinning. Nature 336: 521.


Wang et al. — Spatial pattern of Cryptocarya chinensis

Kenkel, N.C. 1988. Pattern of self-thinning in jack pine: testing the random mortality hypothesis. Ecology 69: 1017-1024.

Kong, G., C. Liang, H. Wu, and Z. Huang. 1993. Dinghushan Biosphere Reserve: Ecological Research History and Perspective. Science Press, Beijing, China.

Kong, G., Z. Huang, and Q. Zhang. 1997. Type, structure, dynamics and management of the lower subtropical evergreen broad-leaved forest in the Dinghushan Biosphere Reserve of China. Tropics 6: 335-350.

Li, X.W. (ed). 1982. Flora of China, Vol 31. Science Press, Beijing, China.

Liang, S. 1992. A preliminary study on the structure and dynamics of Pubescent hornbean population in Karst Mountain of Guiyang. Acta. Phytoecol. Geobot. Sin. 16: 108-117.

Liu, Z. 1990. A primary study on the structure and dynamics of Castanopsis fargesii population on Jinyun Mountain, Sichuan Province. Acta. Phytoecol. Geobot. Sin. 14: 120-128.

Lotwick, H.W. and B.W. Silverman. 1982. Methods for analysing spatial processes of several types of points. J. R. Stat. Soc., London. Series B 44: 403-413.

Lu, Y. 1982. Quantitative analysis of the forest community from Dinghushan. Ecol. Sci. 1: 74-80.

Lu, Y. 1986. The application of the sampling method to the plant population pattern in the lower subtropical forest. Acta. Phytoecol. Geobot. Sin. 10: 272-282.

Mack, R.N. and J.I. Harper. 1977. Interference in dune annuals: spatial pattern and neighbourhood effects. J. Ecol. 65: 345-363.

Moeur, M. 1993. Characterizing spatial patterns of trees using stem-mapped data. For. Sci. 39: 756-775.

Nanami, S., H. Kawaguchi, and T. Yamakura. 1999. Dioecy-induces spatial patterns of two codominant tree species, Podocarpus nagi and Neolitsea aciculate. J. Ecol. 87: 678-687.

Pélissier, R. and F. Goreaud. 2001. A practical approach to the study of spatial structure in simple cases of heterogeneous vegetation. J. Veg. Sci. 12: 99-108.

Peng, S.L. and B.S. Wang. 1984. Analysis on the forest communities of Ding Hu Shan. III. Species pattern. In Dinghu Shan Forest Ecosystem Stationary, The Chinese Academy of Sci

ences (eds.), Tropical and Subtropical Forest Ecosystem. Popular Science Press, Guangzhou Branch, Guangzhou, pp. 24-37.

Peng, S.L. and W. Fang. 1994. Studies on the dynamic of dominant populations of Dinghushan forest during succession. III. Cryptocarya chinensis and Cryptocarya concinna. J. Trop. Subtrop. Bot. 2: 79-87.

Peterson, C.J. and E.R. Squiers. 1995. An unexpected change in spatial pattern across 10 years in an aspen-white-pine forest. J. Ecol. 83: 847-855.

Rebertus, A.J., G.B. Williamson, and E.B. Moser. 1989. Fire-induced changes in Quercus laevis spatial pattern in Forida sandhills. J. Ecol. 77: 638-650.

Ripley, B.D. 1977. Modelling spatial patterns. J. R. Stat. Soc., London. Series B 39: 172-212.

Smith, T.M. and P.S. Goodman. 1987. Successional dynamics in an Acacia nilotica-Euclea divinorum savannah in Southern Africa. J. Ecol. 75: 603-610.

Sterner, R.W., C.A. Ribic, and G.E. Schatz. 1986. Testing for life historical changes in spatial patterns of four tropical tree species. J. Ecol. 74: 621-633.

Thioulouse, J., D. Chessel, S. Dolédec, and J.M. Olivier. 1997. ADE-4: a multivariate analysis and graphical display software. Stat. Comp. 7: 75-83.

Wada, N. and E. Ribbens. 1997. Japanese maple (Acer palmatum ver. Matsumurae, Aceraceae) recruitment patterns: seeds, seedling, and saplings in relation to conspecific adult neighbors. Am. J. Bot. 84: 1294-1300.

Wu, Z.Y. (ed.). 1980. Vegetation of China. Science Press, Beijing, China.

Xu, W. and Y. Zheng. 1993. Structure and dynamics of Picea mongolica population on sand dune. Chin. J. Appl. Ecol. 4: 126-130.

Zhang, J.T. 1998. Analysis of spatial point pattern for plant species. Acta. Phytoecol. Sin. 22: 344-349.

Zhang, J., L. Chen, Q. Guo, D. Nie, X. Bai, and Y. Jiang. 1999. Research on the change trend of dominant tree population distribution patterns during development process of climax forest communities. Acta. Phytoecol. Sin. 23: 256-268.

Zheng, W.J. (ed.). 1983. Tree of China, Vol. 1. Chinese Forest Press, Beijing, China.


Botanical Bulletin of Academia Sinica, Vol. 44, 2003