Bot. Bull. Acad. Sin. (2003) 44: 257-265

Lee et al. — Regulation of sucrose phosphate synthase of sweet potato callus

Regulation of sucrose phosphate synthase of the sweet potato callus is related to illumination and osmotic stress

Mu-Ho Lee1, Chien-Chi Yang1, Heng-Long Wang2, and Ping-Du Lee1,*

1Graduate Institute of Agricultural Chemistry, National Taiwan University, Taipei, Taiwan 106

2Department of Life Science, National University of Kaoshiung, Kaohsiung University Rd., Kaohsiung, Taiwan 811

(Received January 27, 2003; Accepted June 6, 2003)

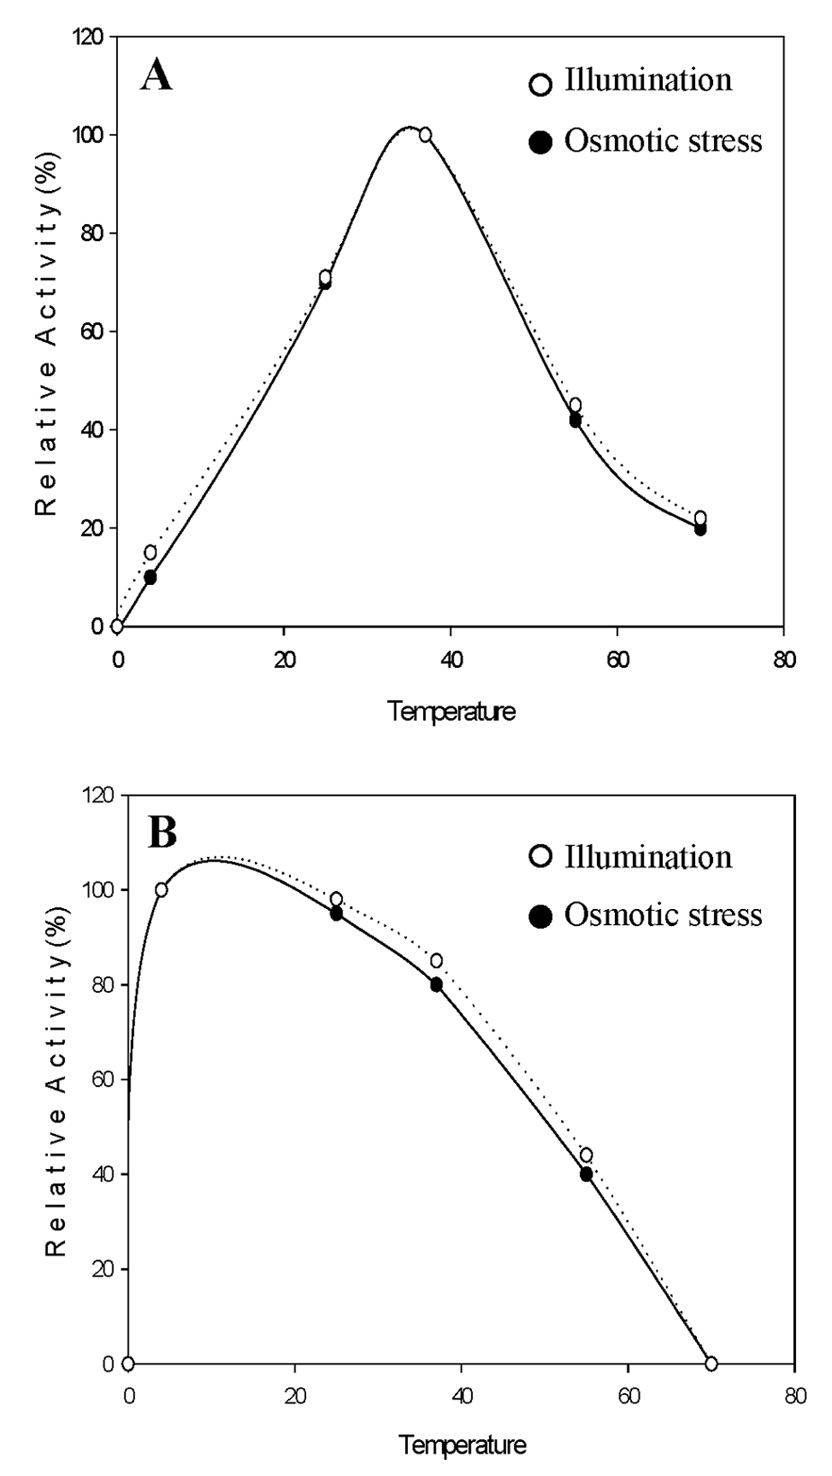
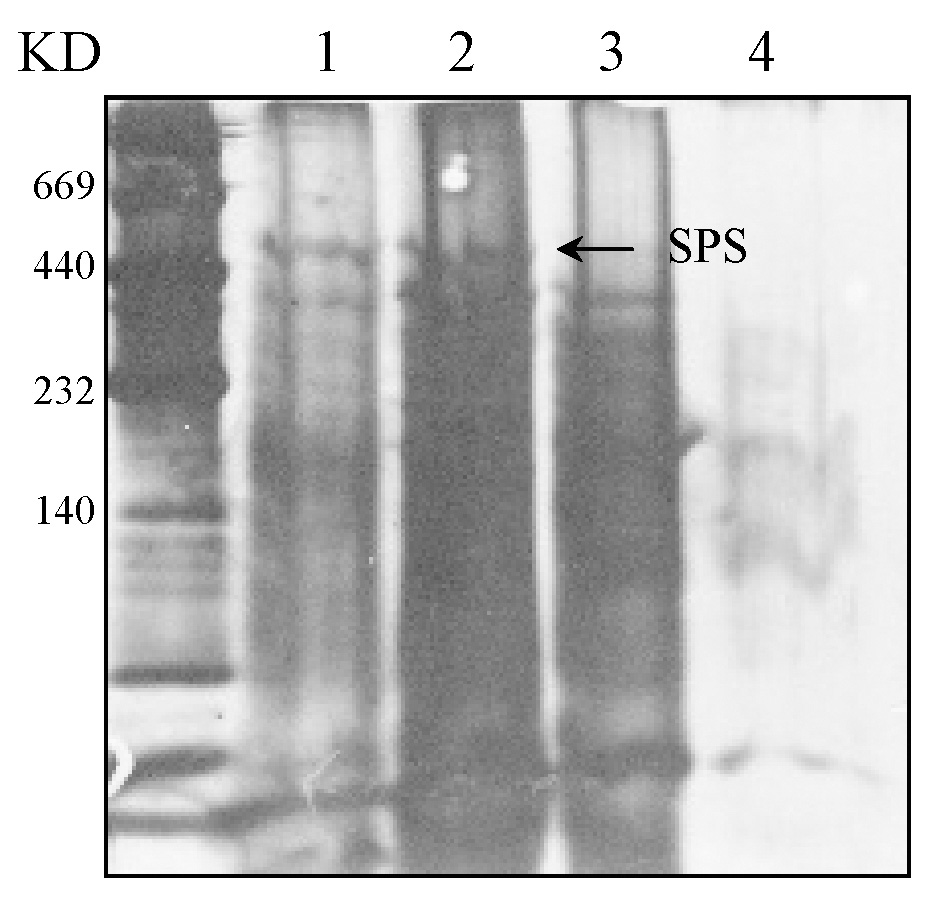
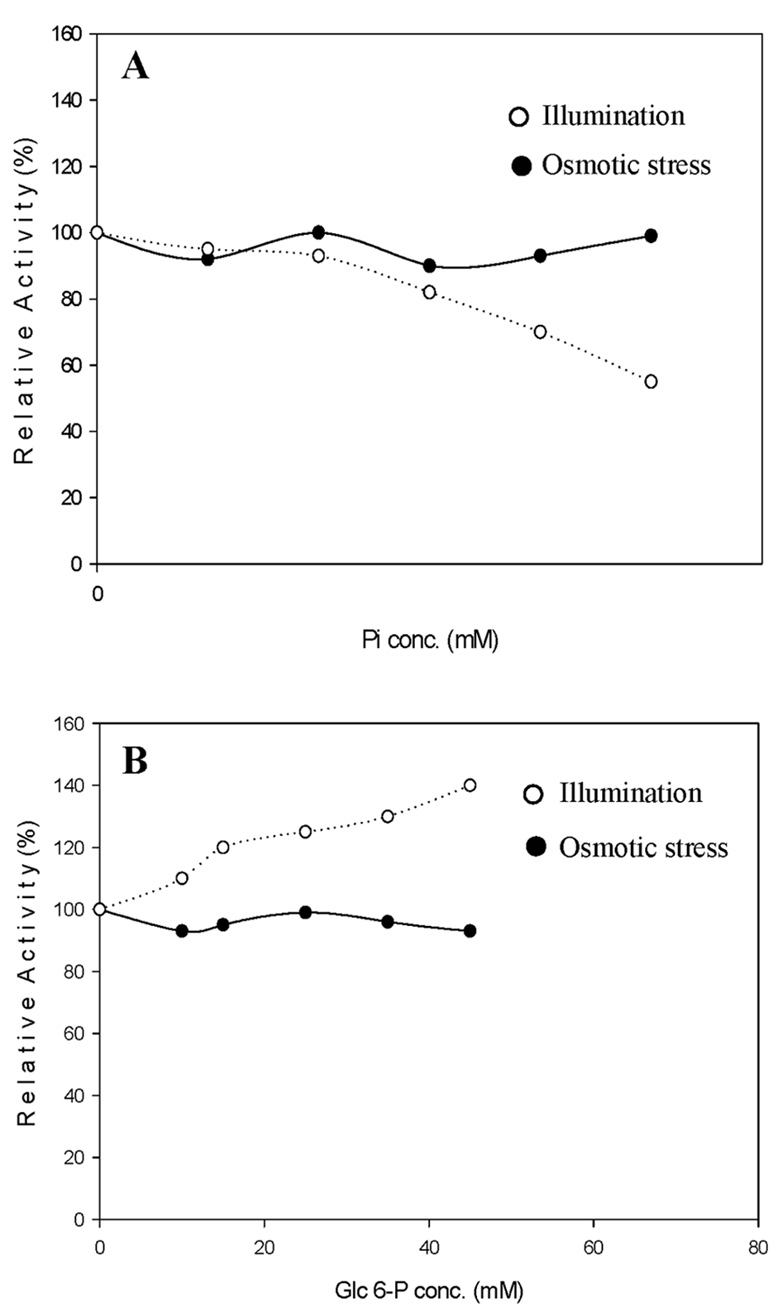
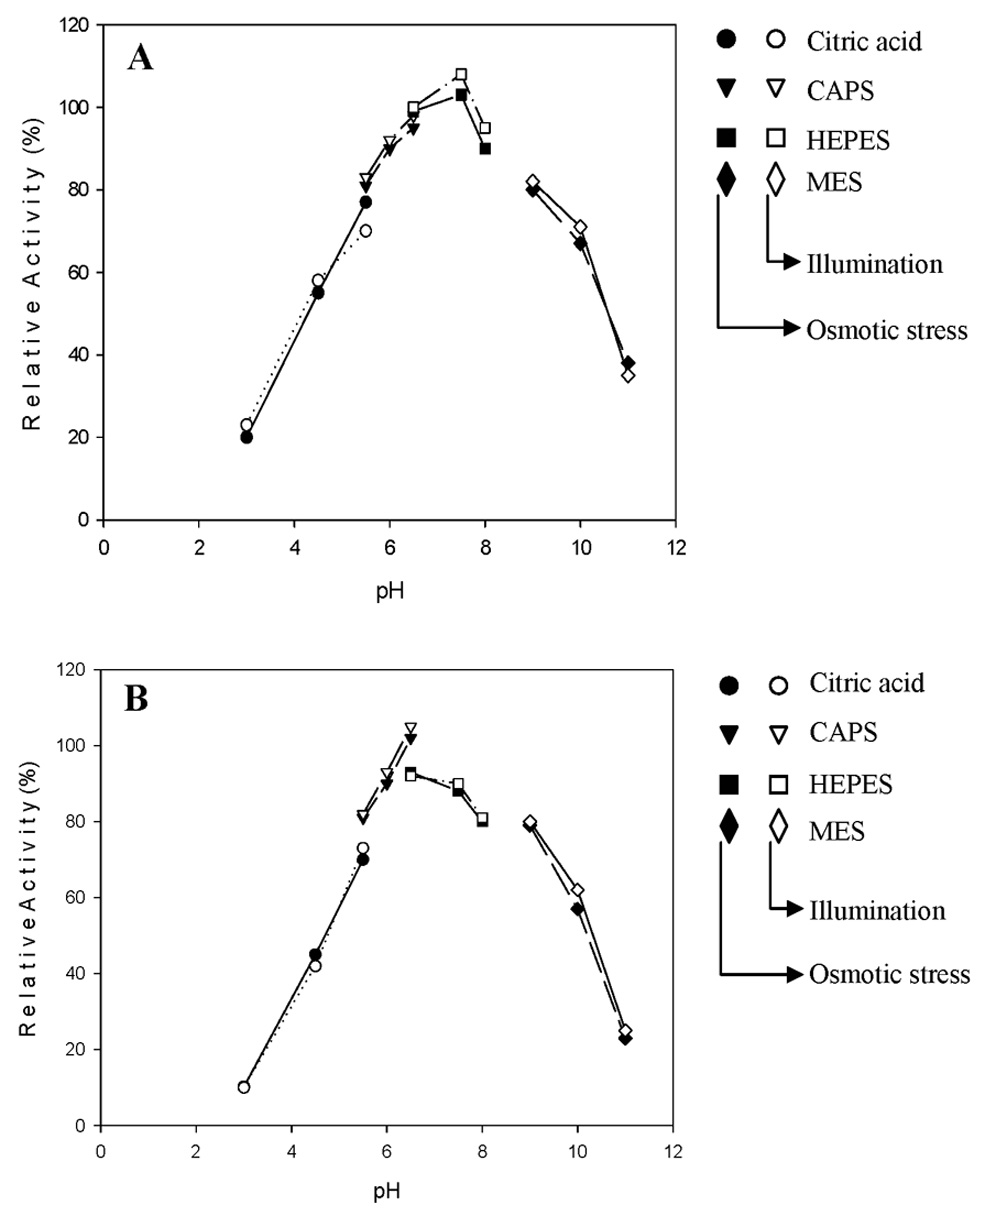
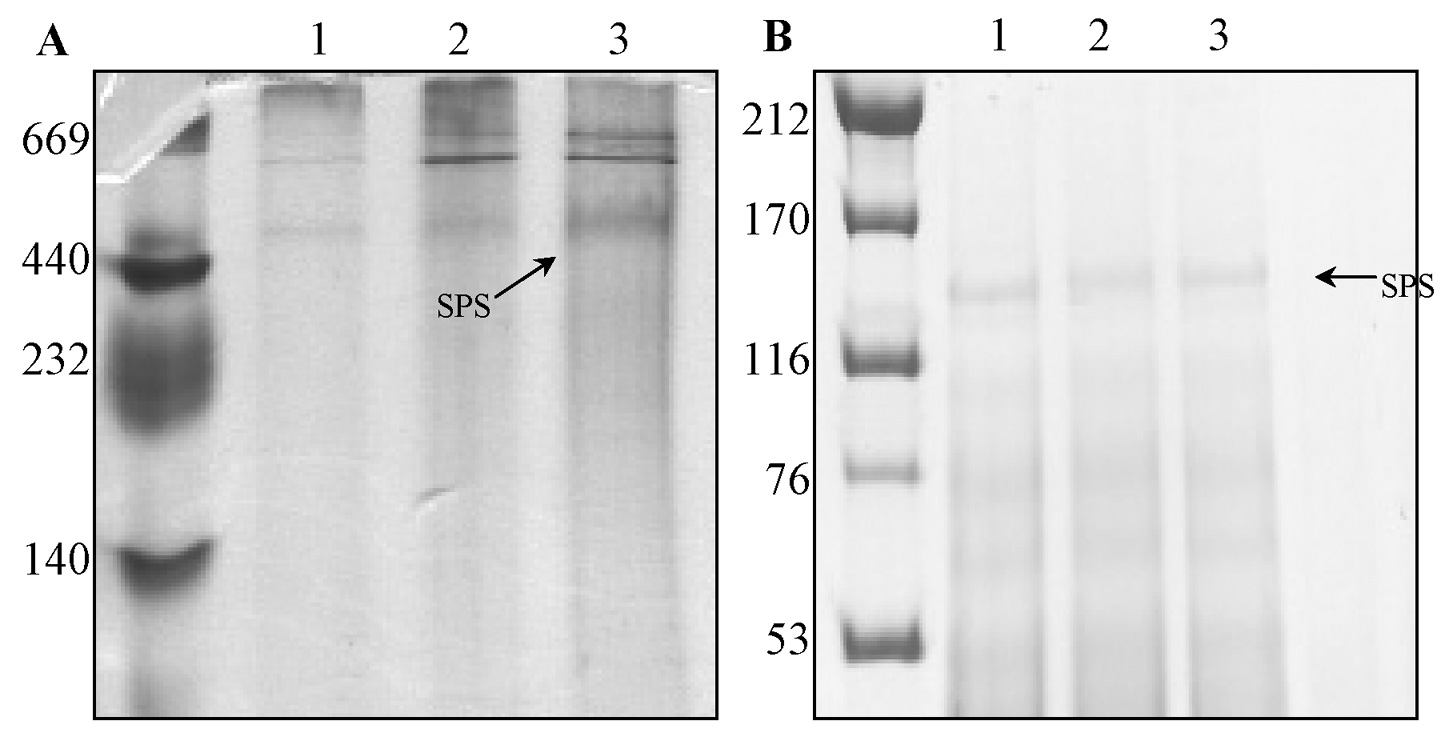
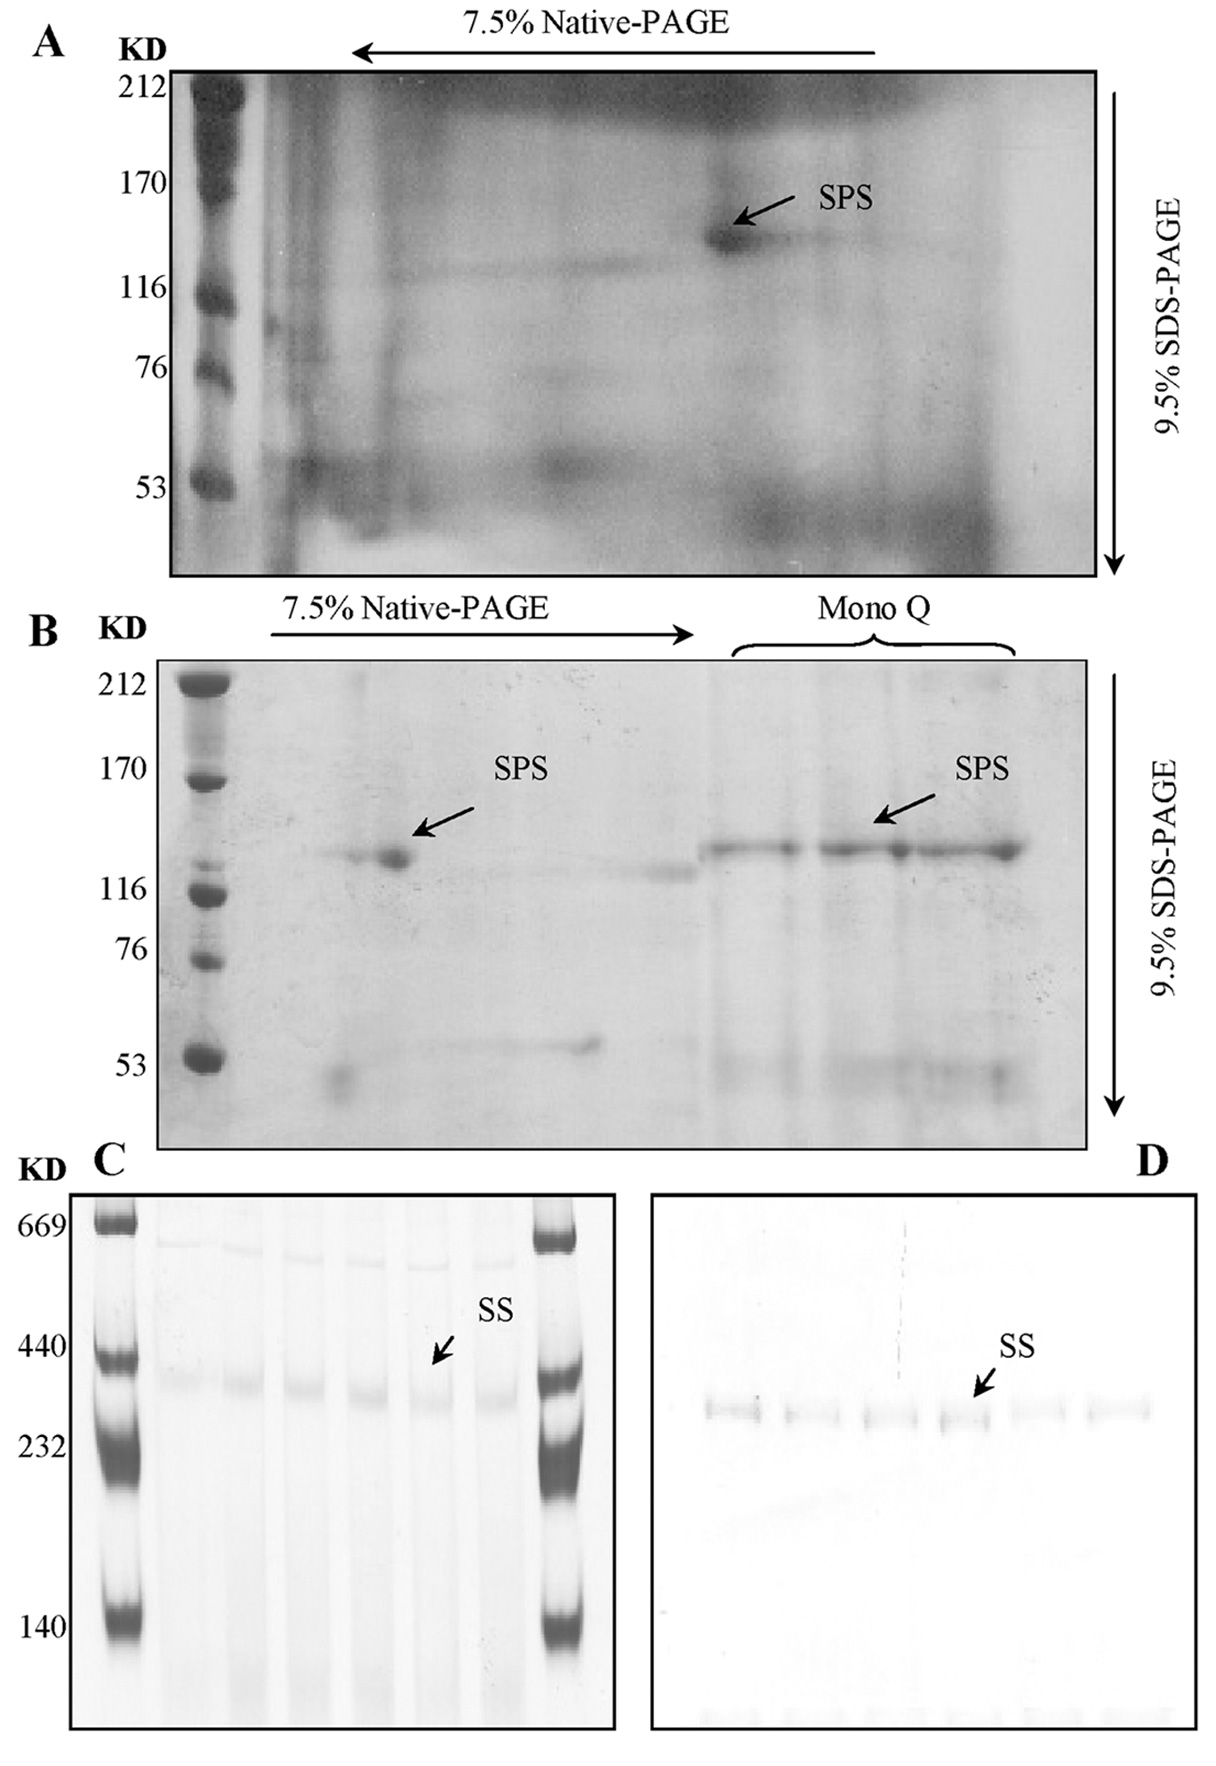
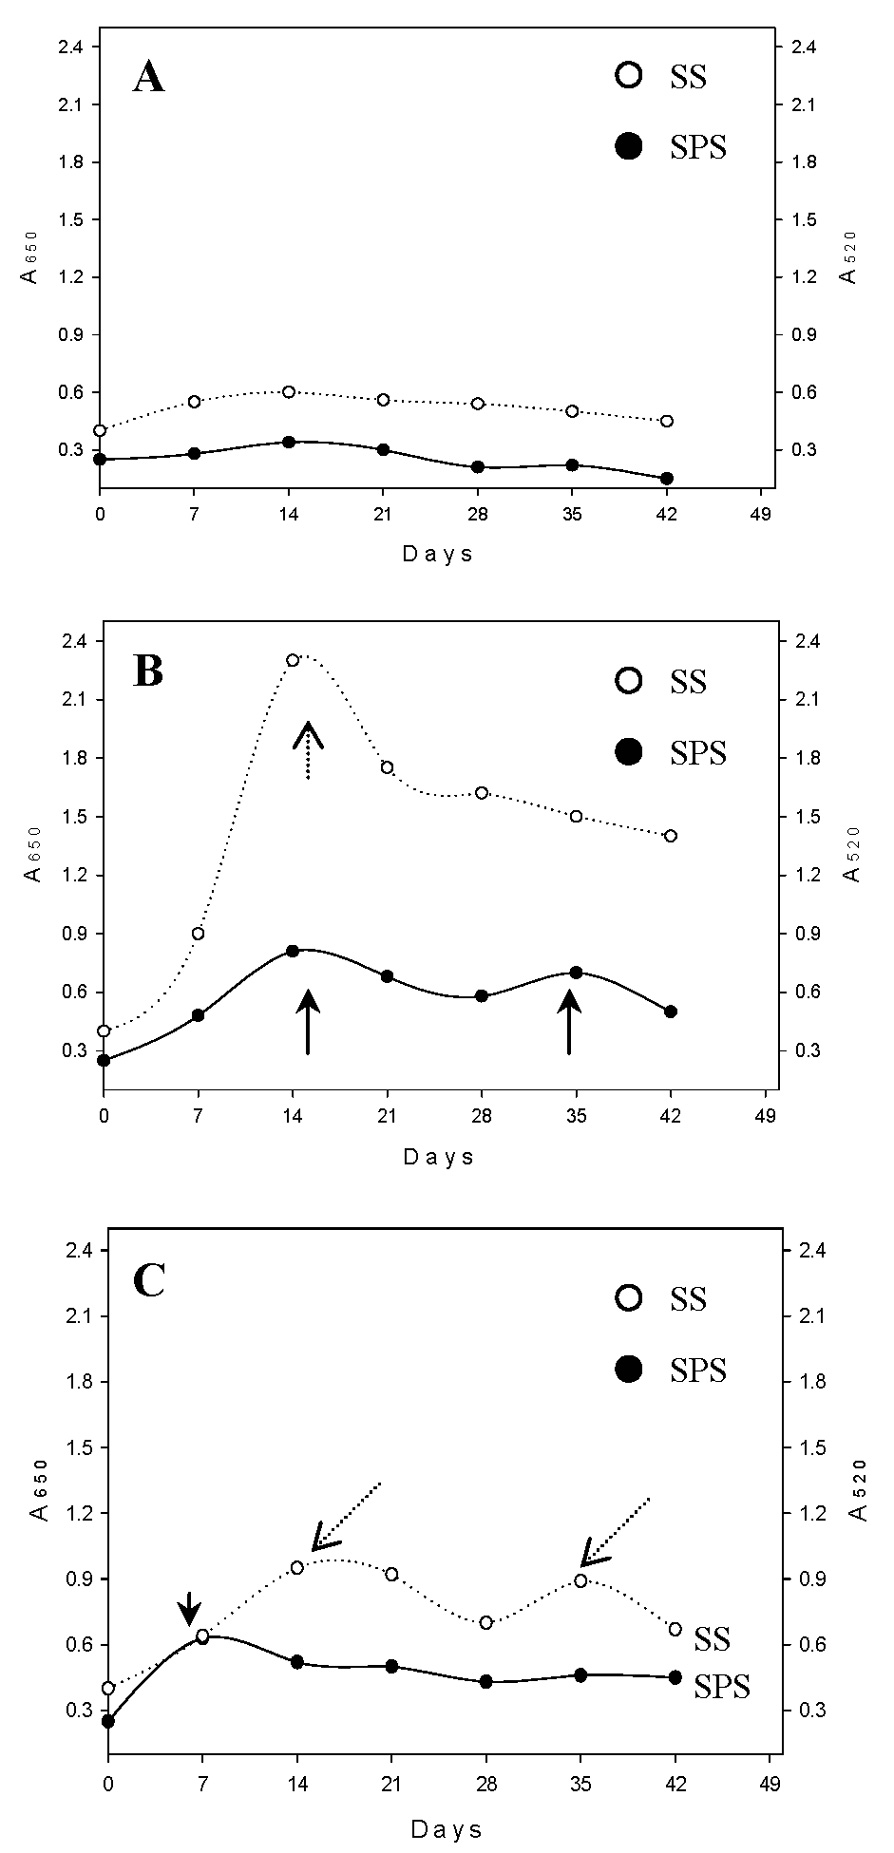
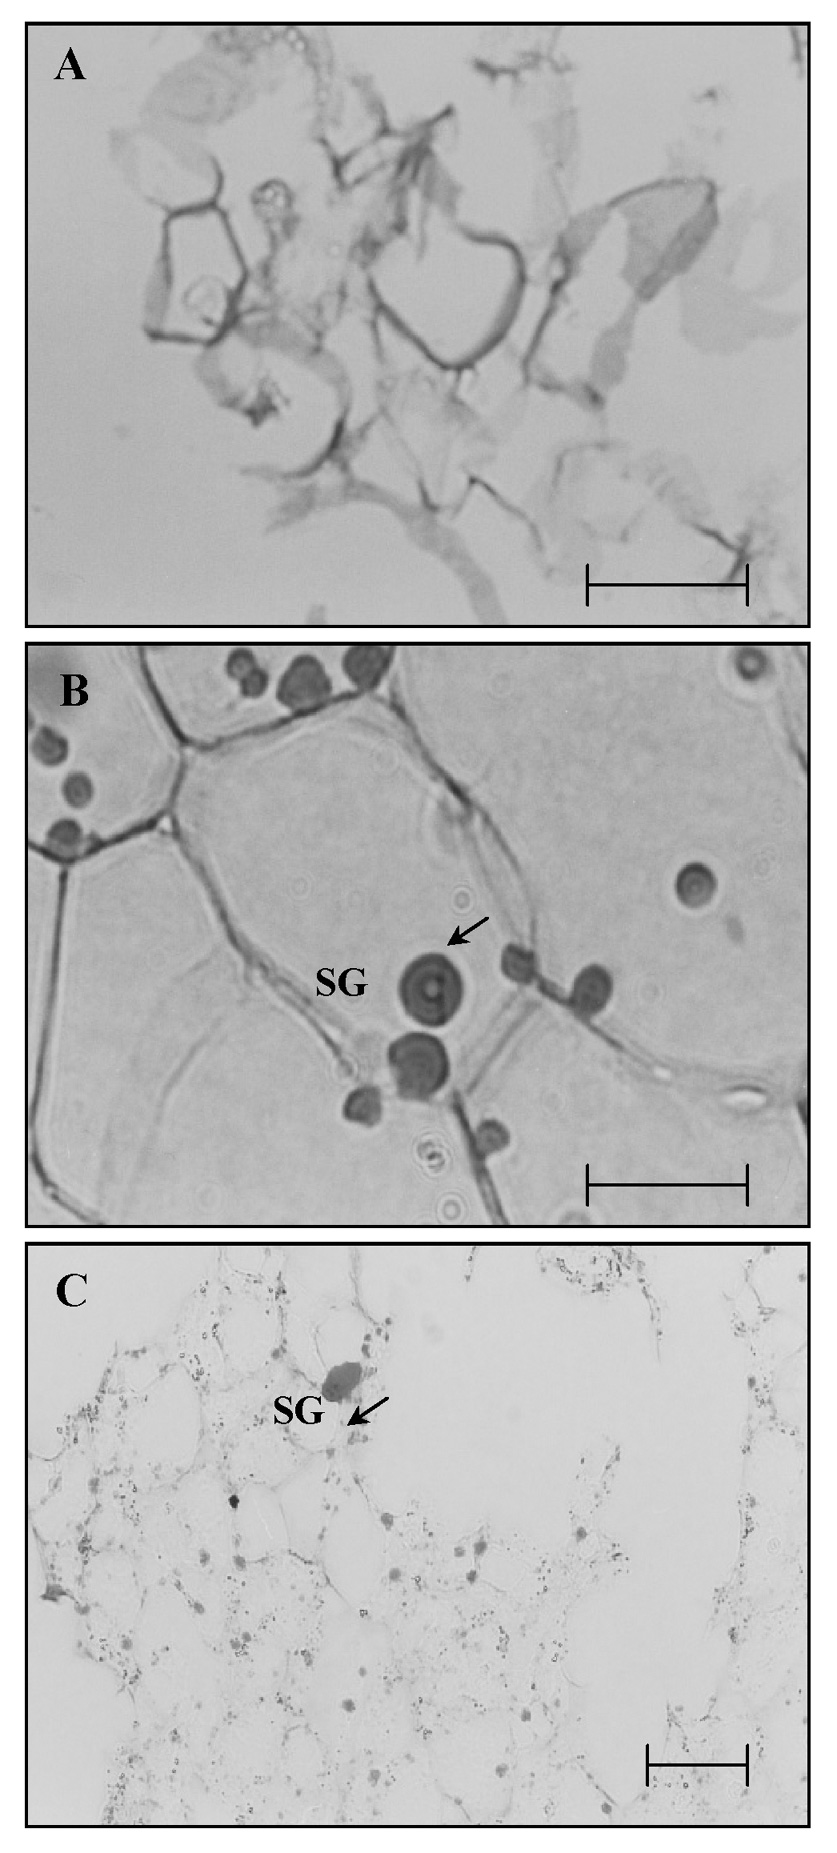
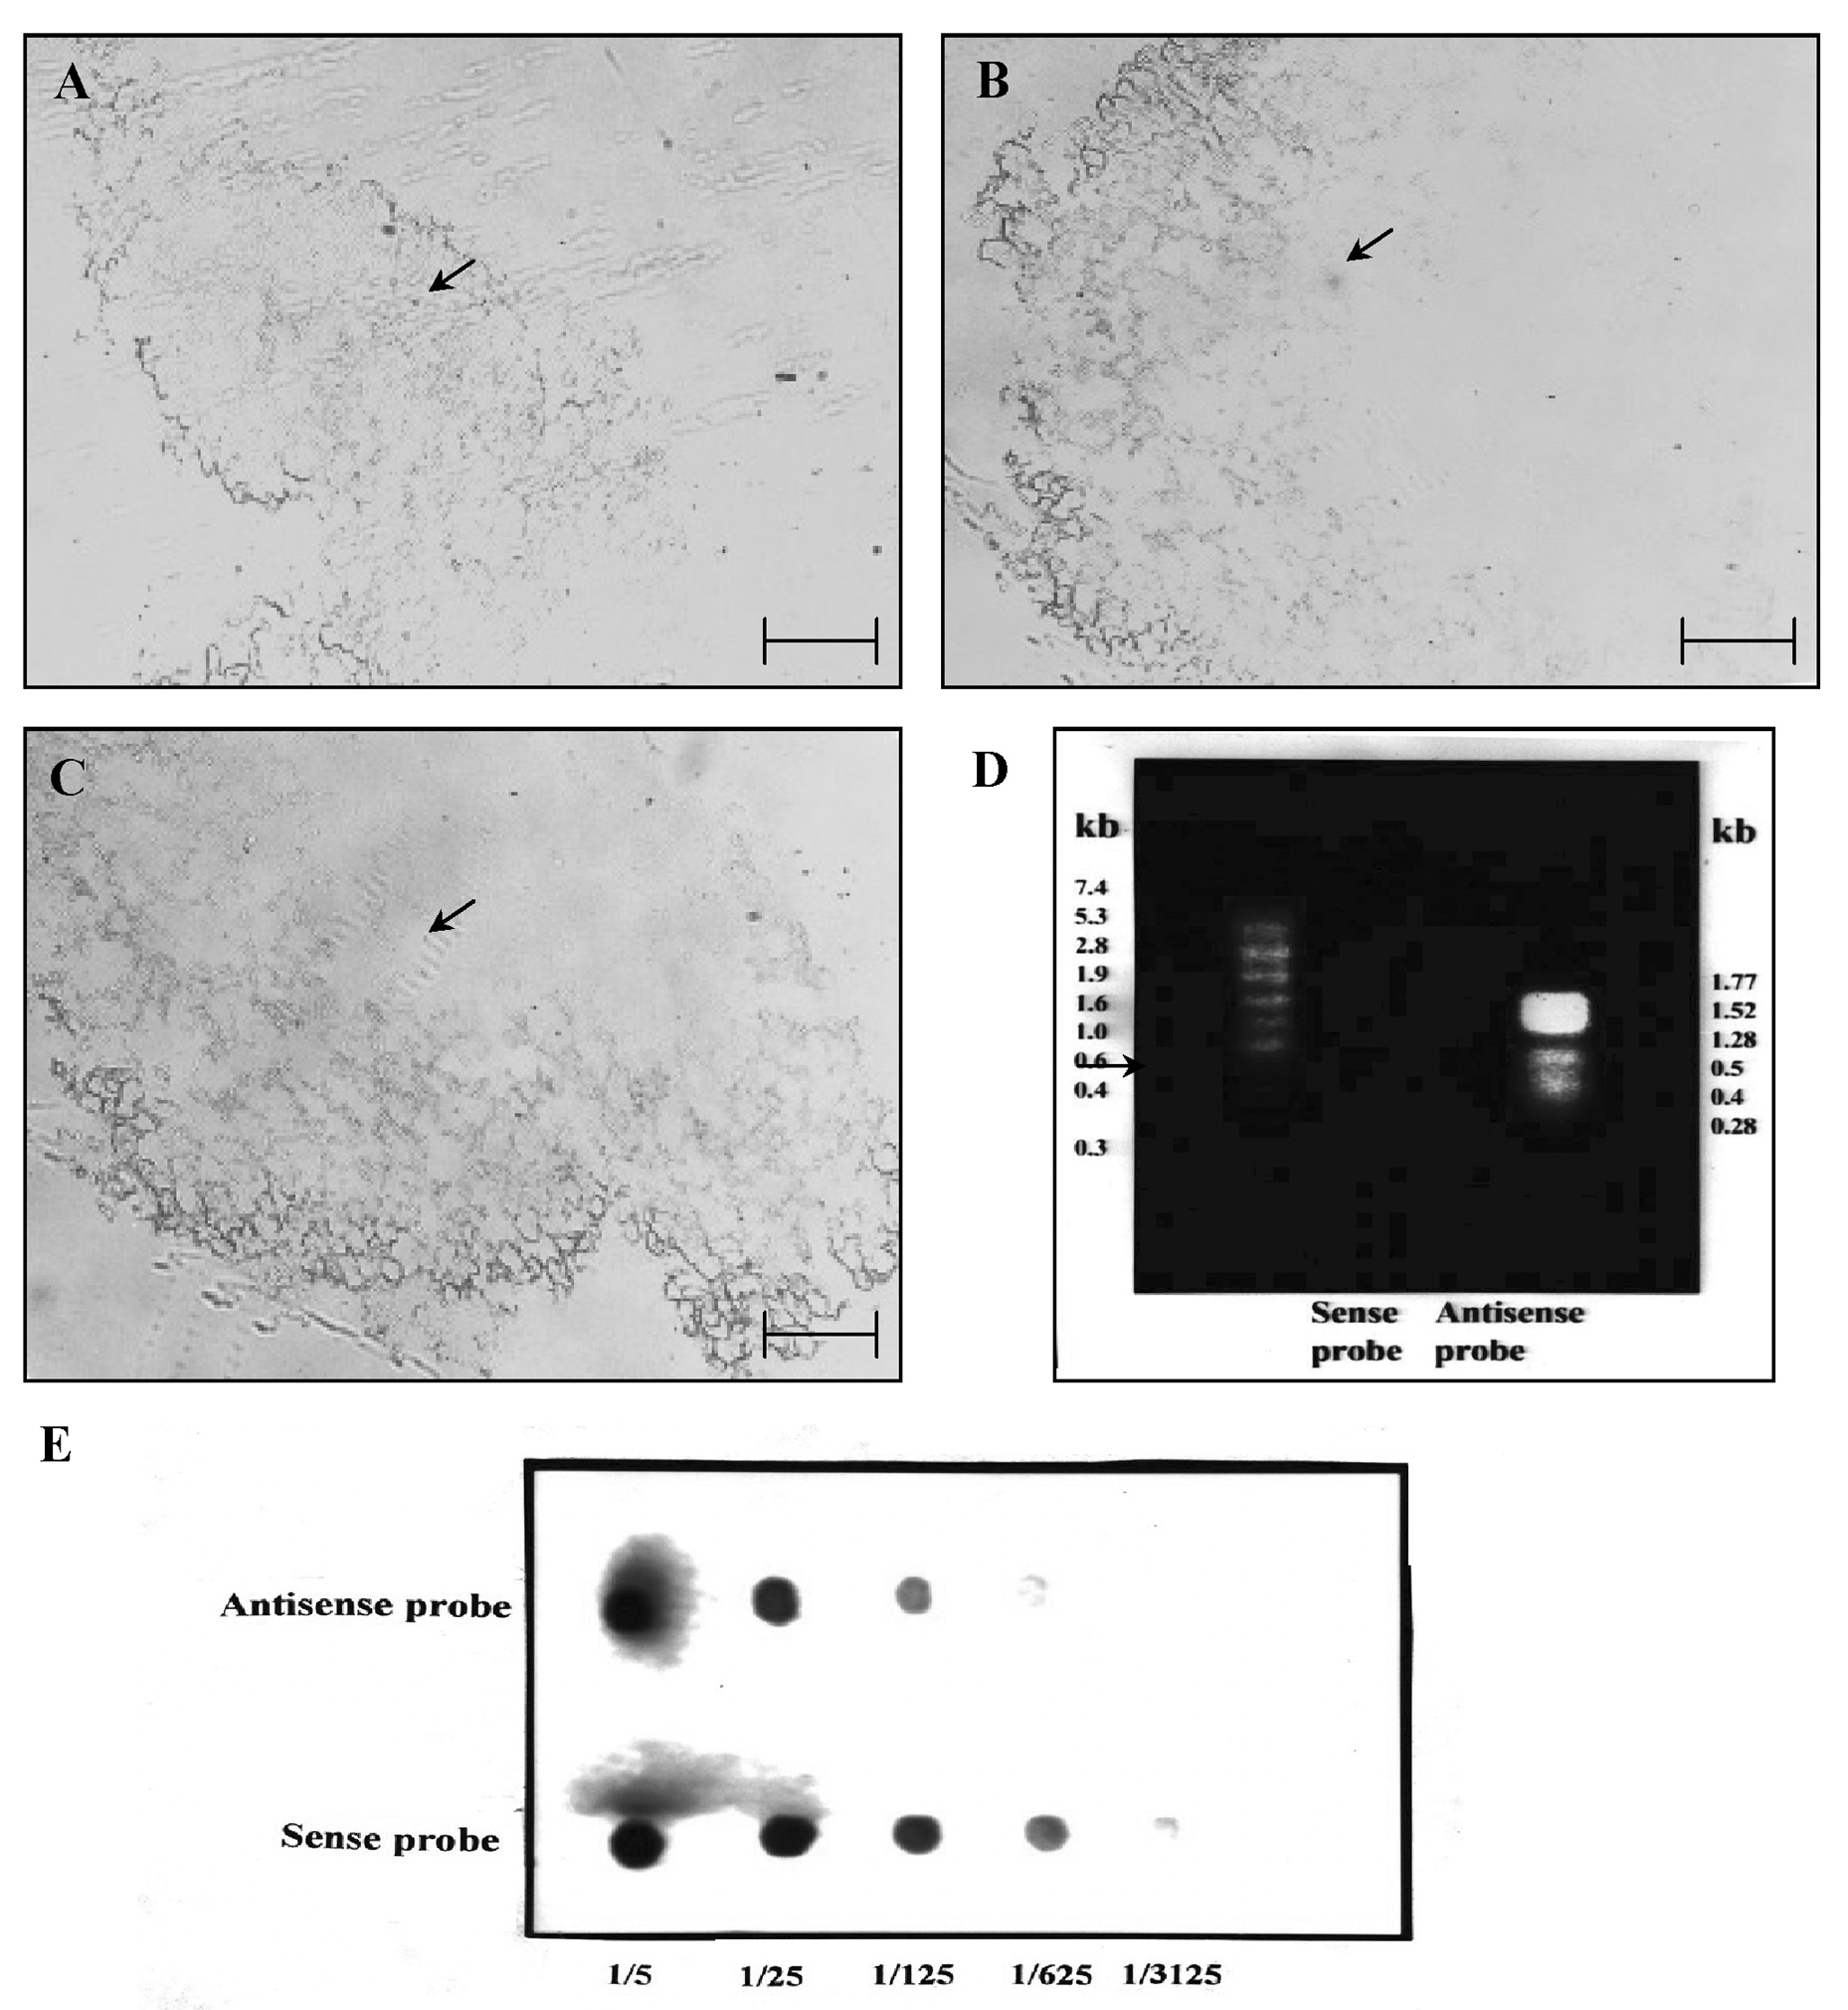
Abstract. Sucrose phosphate synthase (SPS) was purified from sweet potato callus grown under different conditions, including illumination, darkness, and osmotic stress. The properties of the enzymes purified from the different conditions were compared. Since sucrose synthase (SS) could also be purified using the purification process, the expression patterns and properties of the two enzymes were also compared. The SPS purified from the calli tissue medium under illumination had an optimum pH of 7.5. The enzyme had an optimum reaction temperature of 37°C, and maintained stable activity at pH 6 to 8. It was allosterically regulated using either Glc 6-P or Pi. However, the enzyme purified from the tissues grown under osmotic stress conditions was not allosterically regulated using Glc 6-P or Pi. The maximal activity of SPS and maximal protein content of the illumination grown calli appeared on the 14th day after the culture was transferred into a new medium. This was compared with the peak value on the 7th day for the samples under osmotic stress. The maximum activity for SS was observed on the 14th day. The dark grown cells had very low SPS, but normal SS activities. A histological study revealed an abundance of starch granules in the osmotic stressed cells. The in situ hybridization technique showed that the illumination and osmotic stress conditions induced the accumulation of SPS mRNA. The PAGE and enzyme activity assay data showed that, in addition to enhancing SPS gene expression, the activation of SS gene expression isozymes may be achieved under the illumination and osmotic stress conditions.

Keywords: Dark; Illumination; Osmotic stress; Sucrose phosphate synthase; Sucrose synthase; Sweet potato callus.

Introduction

Higher plants synthesize sucrose through two processes. The first and the major method employs sucrose phosphate synthase (EC 2.4.1.14; SPS), a soluble enzyme located in the cytoplasm that catalyzes the reaction:

UDPGlc + Fru6-phosphate UDP + Suc6'-phosphate

Suc 6'-phosphate is then dephosphorylated by Suc-P phosphatase (EC 2.3.1.14; SPP) to produce sucrose as the final product (Huber and Huber, 1996). The second is sucrose synthase (EC 2.4.1.13; SS) which catalyzes a reversible reaction:

UDP _ glucose + Fructose Sucrose + UDP

Sucrose is the main carbohydrate used by most plant species to translocate photo assimilates from the leaves to non-photosynthetic tissues. In addition, it is the most common carbon source added to plant tissue cultures. Sucrose is transported by a combination of symplasmic and apoplasmic pathways to the phloem, where it is loaded using a proton-driven symporter (Riesmeier et al., 1994). In the phloem, sucrose is translocated by a mass flow to sink tissues, where it is cleaved by SS to produce UDPG and fructose or it is hydrolyzed by invertase (EC 3.2.1.26) to

yield glucose and fructose (Giaquinta, 1983). They are then used for other biosynthetic pathways as energy and sources of structural components. SPS has also been proposed to be an important limiting step in the source-sink relationship, in grain filling in cereals (Prioul and Schwebel-Dugue, 1990), in sugar accumulation in fruits (Hubbard et al., 1990; Dali et al., 1992) and in cold stress acclimation (Guy et al., 1992).

SPS undergoes many regulatory mechanisms. First, SPS is subjected to allosteric regulation by Glc 6-P (activator) and Pi (inhibitor) (Douglas and Huber, 1983; Stitt et al., 1988). Secondly, it can be reversible and covalently modified in response to light (Stitt et al., 1988; Huber et al., 1989; Huber and Huber, 1991, 1992), accumulation of sucrose (Stitt et al., 1988) or osmotic stress (Toroser and Huber, 1997). Finally, it is involved with transcriptional regulation during sink-source transition (Harn et al., 1993; Klein et al., 1993).

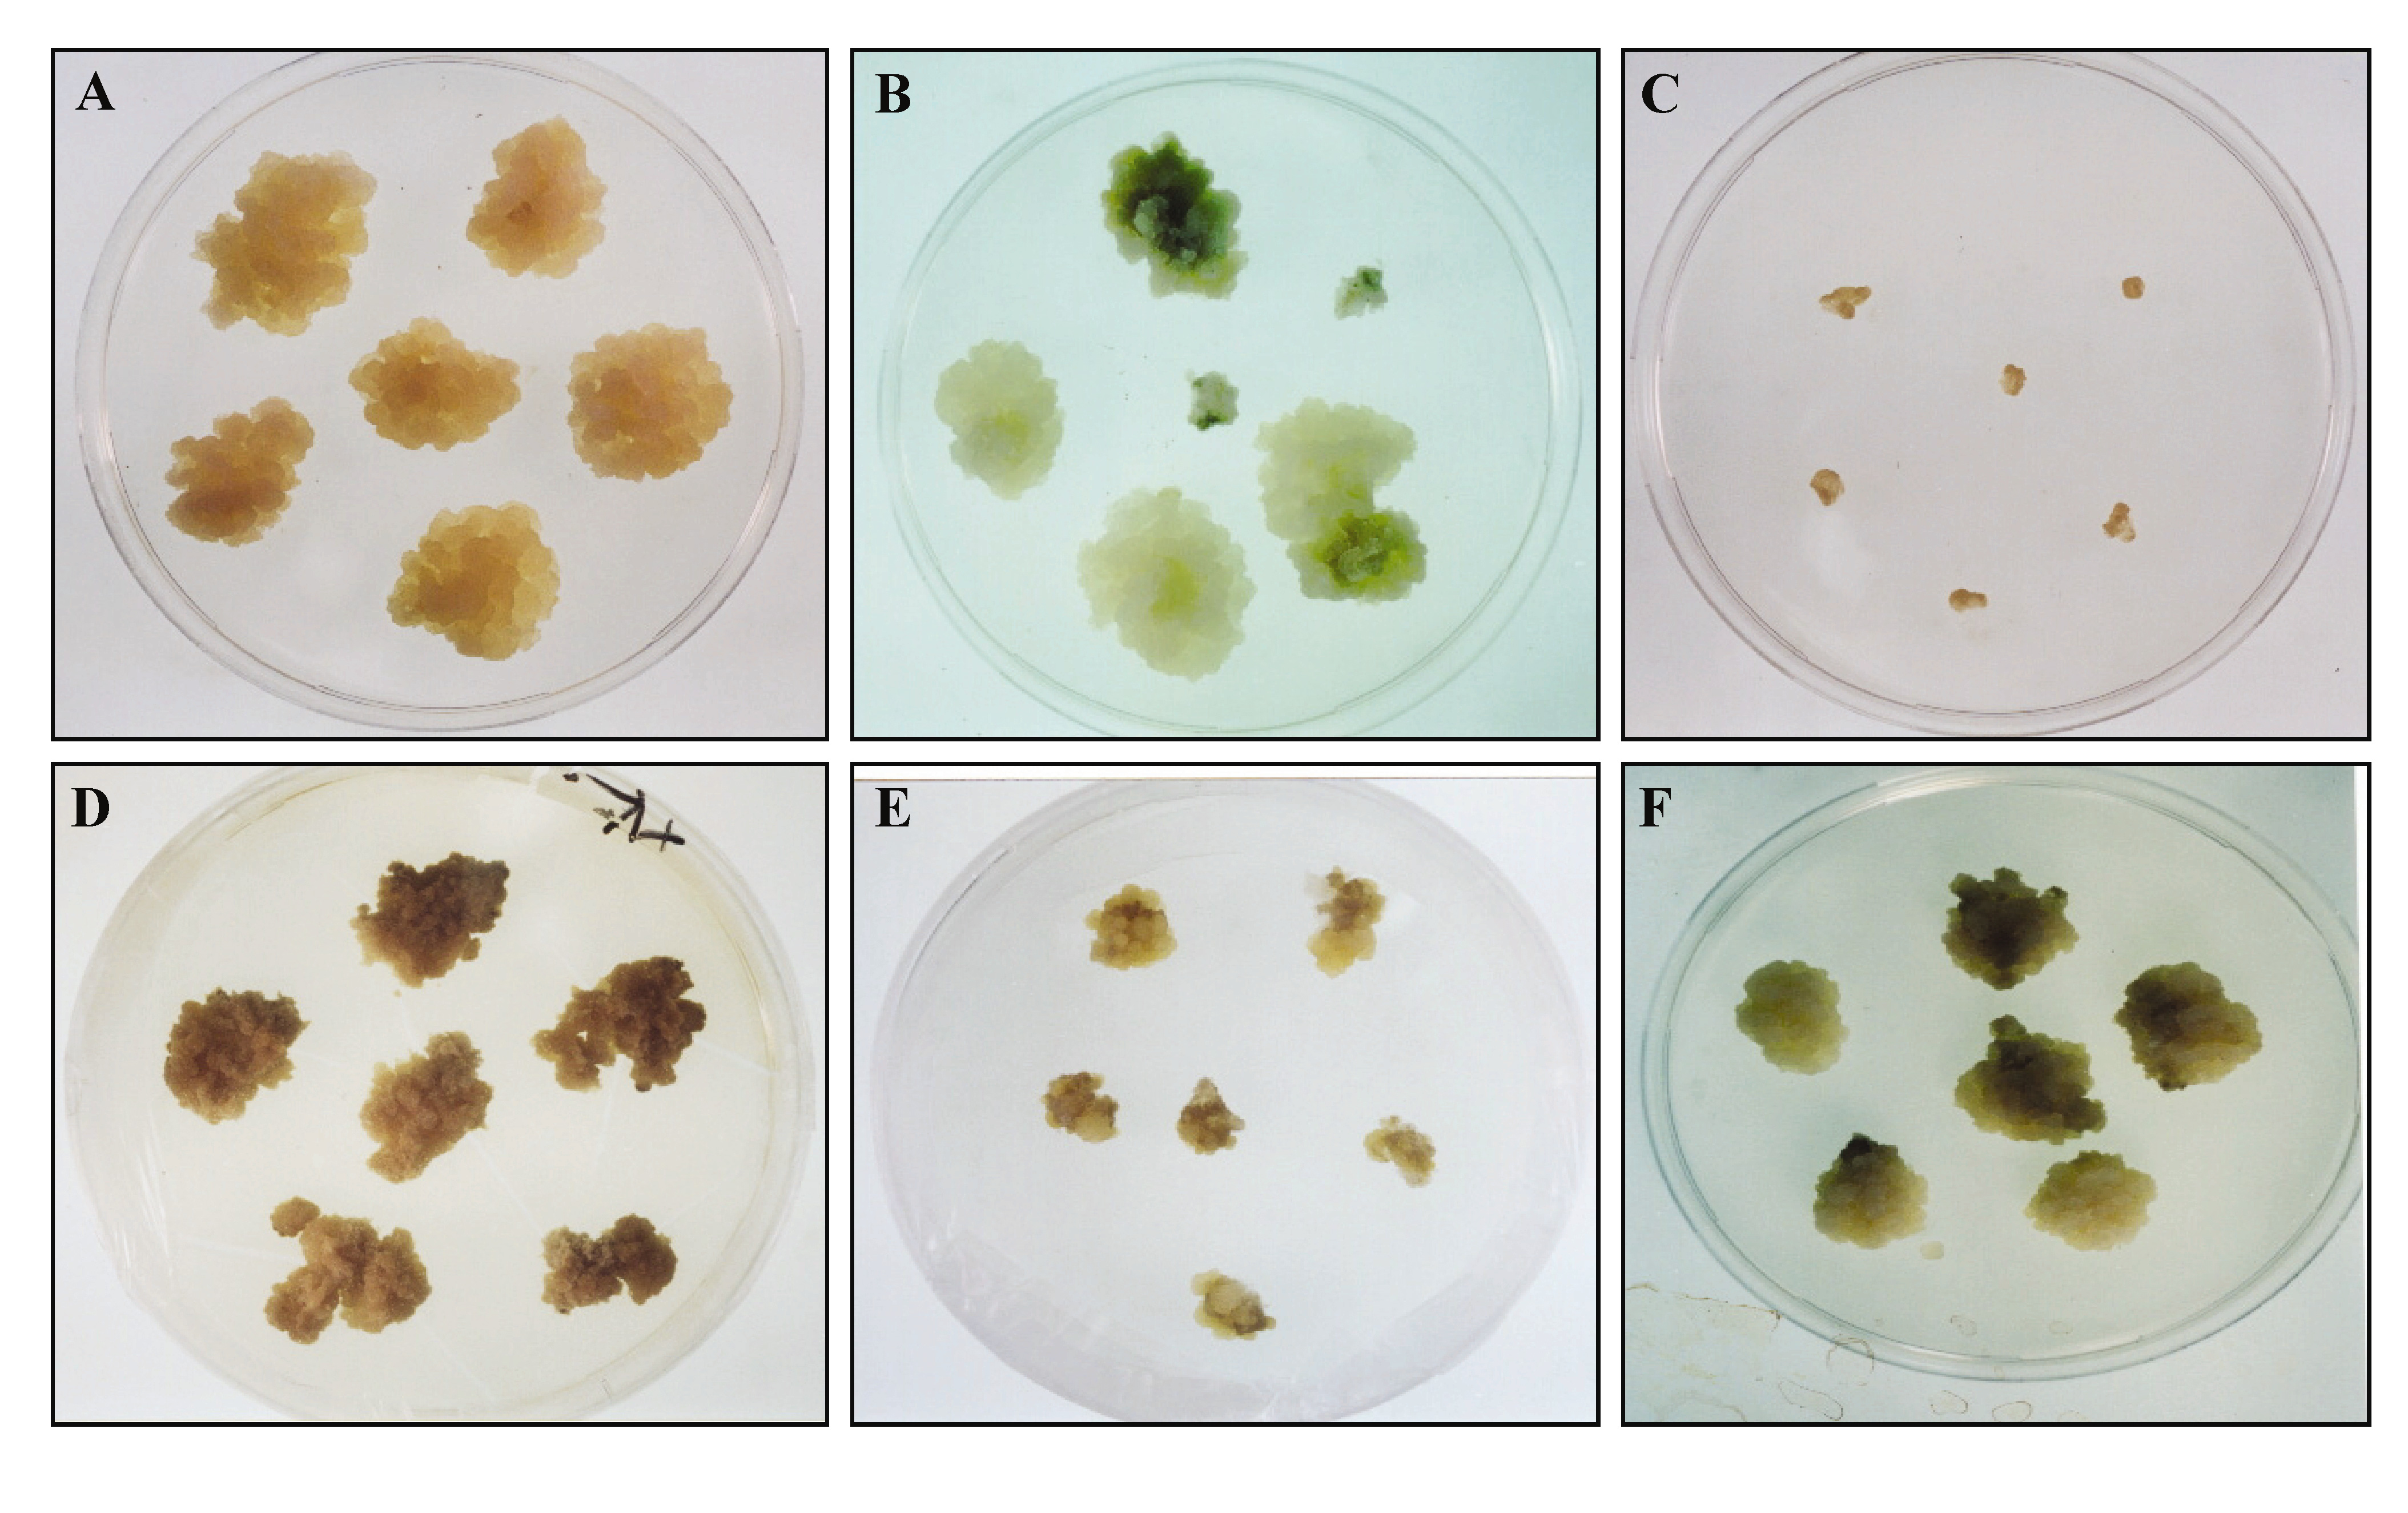
The aim of this report was to explore the SPS activity of non-photosynthetic tissues under illumination. The callus of sweet potato was induced from tubers for simplicity in manipulating the conditions. After treatment with illumination and high osmotic stress, the callus cells acquired a high starch content. Illumination and high osmotic stress were then used as two controlled factors for SPS activity. The condition of highest enzyme activity was used for the biochemical characterization of SPS.

*Corresponding author. E-mail: pingdu@ccms.ntu.edu.tw


Botanical Bulletin of Academia Sinica, Vol. 44, 2003

Materials and Methods

Plant Materials

Calli of sweet potato were induced from sweet potato tuber root (Ipomoea batatas cv. Tainong 57) and cultured as previously described (Wang et al., 2000). Briefly, they were subcultured by monthly transference into a fresh Murashige-Skoog medium containing 2 µg·mL-1 2,4-D, 0.2 µg·mL-1 kinetin, 30 gL-1 sucrose and 8 gL-1 agar. Cells for experiments were harvested 35 days after routine transfer into the same medium. Calli cells were collected at 7-day intervals until 35 days of cultivation, and then they were used for further analysis.

Assay of SPS and SS

SPS activity was monitored using the anthrone test during the entire purification procedure (Huber et al., 1989). In this test, 70 µL of the reaction mixture including the extract was adjusted to a final concentration of 4 mM Fru 6-P, 20 mM Glc 6-P, 3 mM UDPG, 50 mM Hepes-KOH (pH ), 5 mM MgCl2, and 1 mM EDTA. The mixture was incubated at 37°C for 15 min before adding 70 µl 30% (w/v) KOH and heating for 10 min at 95°C. To this 1 mL 0.14% (w/v) anthrone in 95% H2SO4 was then added. The mixture was incubated 20 min at 37°C, and A650 was measured. An assay of the SS activity method was described using Nel

son's modification of Somogi's method (Nelson, 1944). The method was used when various nucleotides were tested as the substrate.

Western Blotting

After electrophoresis, native-PAGE or SDS-PAGE gel plates were soaked in blotting buffer containing 25 mM Tris and 192 mM glycine at pH 8.3 for 5 to 10 min. Proteins were transferred onto a polyvinylidene difluoride membrane (Immobilon; Amersham Pharmacia Biotech). Protein gel blots were blocked using 5% fat-free powdered milk solution in 20 mM Tris-HCl, pH 7.5, and 500 mM NaCl. Blots were incubated with rabbit antiserum raised against RBE1, glutathione-S-transferase (GST)_SPK fusion protein, GST-Suc synthase fusion protein (Urao et al., 1994) for the detection of each protein. Immunodecorated proteins were visualized with horseradish peroxidase-conjugated anti-goat secondary antibody using the Vectastain ABC kit (Vector Laboratories, Burlingame, CA) and DAB substrates (Funakoshi, Tokyo, Japan). The amount of total protein was estimated using a protein assay kit (Bio-Rad).

In Situ Hybridization Technology

RNA in situ analysis was performed as previously described (Gavis and Lehmann, 1992). Sections of immature tissues were prepared from the callus of a sweet potato.

Figure 1. The changes of sweet potato tuberous calli cells with different treatment. Calli of sweet potato were induced from sweet potato tuber root and cultured on MS medium under illumination, dark and osmotic stress treatment. Cells for experiments were harvested at 35 days after routine transfer into the same medium. A, cells grown under dark; B, cells grown under illumination; C, cells growth were inhibited under osmotic stress; D, cells grew at negligible rate under osmotic stress, and as time went on, they turned brown; E and F, the new cells grown from browning cell upon illumination.


Lee et al. — Regulation of sucrose phosphate synthase of sweet potato callus

PAS Staining

Tissue slides were stained for carbohydrates with periodic acid-Schiff (PAS) stain (Segrest and Jackson, 1972) using a Gelcode glycoprotein staining kit (Sigma) according to the manufacturer's protocols.

Results

Qualitative Protein Analysis

The callus was cultured on a medium under the conditions described in the previous section (Figure 1). The Bradford method was used to estimate the total protein content. It was found that the protein expression increased during the second week (data not shown). As the osmotic stress increased, the protein content increased as well. It should be noted that the expression of protein was different when comparing the following conditions: illumination versus sans-illumination; high osmotic stress versus the normal; and illumination versus high osmotic stress. Different protein profiles were observed from the cultures with illumination or osmotic stress (Figure 2). This stimulation may have also induced large quantities of SPS and SS expressions.

Enzyme Properties

After osmotic stress induction or illumination, the SPS partially purified from sweet potato callus was determined to have an optimal reaction temperature of 37°C (Figure 3A). It was also discovered that at low temperatures, the solution seemed to become stable (Figure 3B). Approximately 80% of the activity was maintained at a temperature of 37°C. However, when the temperature rose above 37°C, maintenance of the activity was difficult. No activity was

Figure 3. Biochemical characterization of SPS from sweet potato calli under osmotic stress and illumination. A, temperature dependence of the activity of SPS from sweet potato tuberous calli. After osmotic stress induction or illumination, the SPS partially purified from sweet potato calli was determined to have an optimal reaction temperature of 37°C; B, thermal stability of SPS from sweet potato tuberous calli. It is also discovered that at the low temperatures, SPS is more stable.

detected at 70°C. Therefore, the purification and the storage of SPS were carried out at low temperatures throughout the experiment.

The optimal pH value for the enzyme reactions was determined to be pH 7.0 (Figure 4A). The enzyme exhibited high reaction activity from pH 5.5 to 9.0. However, SPS was the most stable at pH 7.0 (Figure 4B). Approximately 80% of the activity could be maintained in the range of pH 5.5 to 9.0 after 15 min of incubation (data not shown). Maintaining the activity outside that range was difficult.

SPS from callus with osmotic stress treatment was not regulated by Glc 6-P or Pi (Figure 5A-B). From the results of previous studies, SPS was obtained from photosynthetic tissues subjected to the allosteric regulation of Glc 6-P and Pi (Figure 5A-B). This suggested the existence of isoenzymes to meet the different physiological roles in the different tissues.

Figure 2. Silver-staining patterns of SPS on 7.5% Native-PAGE. Lane 1, illumination; lane 2, illumination and osmotic stress; lane 3, osmotic stress; lane 4, dark. It should be noted that the expression of protein varied with different treatment.


Botanical Bulletin of Academia Sinica, Vol. 44, 2003

Comparative Analysis of Enzyme Activity

The activities of SPS and SS from calli under different conditions were recorded every 7 days (Figure 8). This was to identify the activity changes of the non-illuminated area during its growth and development. The activities of SPS and SS reached their peak during the second week (Figure 8B). However, the changes were not significant. In comparing the CBR-stained electrophoresis slides, no bands were apparent from the Native-PAGE 440 to 550 kDa (Figure 6A) or from the SDS-PAGE 116 to 140 kDa (Figure 6B), where the SPS was expected. This may suggest that the gene expression of the SPS was minimal without illumination.

The illuminated cells were placed under constant illumination of 5000 Lux (approximate wavelength of 700 nm) from 06:00 to 21:00 (with no illumination from 21:00 to 05:00) for 45 days. The activity recorded every 7 days revealed that SPS and SS had the highest activities during the second week as well (Figure 8B). Using electrophoresis analysis, several visible bands appeared on the electrophoresis gels. SPS bands were also present around 130 kDa in SDS-PAGE (Figure 7A-B).The important

Figure 5. Biochemical characterization of SPS from sweet potato calli under osmotic stress and illumination. A, Effect of inorganic phosphate on SPS from sweet potato tuberous calli; B, Effect of Glc 6-P on SPS from sweet potato tuberous calli. SPS from calli with osmotic stress treatment was not regulated by Glc 6-P or Pi. From the results of previous studies, SPS was obtained from photosynthetic tissues subjected to the allosteric regulation of Glc 6-P and Pi.

difference was that illumination may direct the calli to transform their amyloplast into chloroplast (Figure 1B). The presence of chloroplasts suggests the occurrence of photosynthesis; hence, the detection of SPS agreed with this physiological change. The SS activities were highest during the second week (Figure 8B). In spite of the fact that sucrose encourages SS gene expression (Figure 7C-D), cells must decompose sucrose to provide monosaccharides for growth. The growth rates during the second and the third weeks were the fastest. Since most sucrose would have been decomposed after two days, the effects were minimal. The comparison between illuminated subjects and non-illuminated subjects was alone sufficient to show that illumination does indeed induce the gene expression of SPS and SS. High osmotic stress analysis for SPS and SS activity (Figure 8C) also revealed that activity was higher in batches under high osmotic stress than in those without illumination. The activity peaked during the first week for SPS and during the second week for SS (Figure 8C). When comparing the growth rate with protein content, the high osmotic stress induced SPS gene expression at the shortest lapse of time to synthesize

Figure 4. Biochemical characterization of SPS from sweet potato calli under osmotic stress and illumination. A, pH dependence of the activity of SPS from sweet potato tuberous calli. The optimal pH value for the enzyme reactions was determined to be pH 7.0; B, pH stability of the activity of SPS from sweet potato tuberous calli. SPS was the most stable at pH 7.0 under CAPS buffer. CAPS: 3-[cyclohexylamino]-1-propanesulfonicacid. HEPES: N-2-Hydroxyethylpiperazine-N´-2-ethanesulphonic acid. MES: 2-(N-morpholino)ethanesulfonic acid.


Lee et al. — Regulation of sucrose phosphate synthase of sweet potato callus

Figure 6. CBR-staining patterns of SPS on 7.5% Native-PAGE and 9.5% SDS-PAGE. Lane 1, illumination; lane 2, illumination and osmotic stress; lane 3, osmotic stress. Comparing the CBR-stained electrophoresis slides, no bands were apparent from the Native-PAGE 440 to 550 kDa (A), or from the SDS-PAGE 116 to 140 kDa (B) where the SPS was expected. The extract was fractionated with the polyethylene glycol precipitation followed by the successive chromatographic steps of DEAE-Sepharose ion exchange, Hitrap heparin affinity adsorption, and FPLC/Mono-Q columns.

Figure 7. Silver, CBR reagent-staining patterns of SPS and immuno-staining patterns of SS on 7.5% Native-PAGE and 9.5% SDS-PAGE. Lane 1, Illumination; lane 2, illumination and osmotic stress; lane 3, osmotic stress. A, Two-dimensional PAGE of SPS staining with silver; B, Two-dimensional PAGE of SPS staining with CBR; C and D, CBR and immuno-staining patterns of SS on 7.5% Native-PAGE SPS bands were also present around 130 kDa in SDS-PAGE.


Botanical Bulletin of Academia Sinica, Vol. 44, 2003

sucrose. The sucrose produced by SPS was then used as a substrate for SS or sucrose transformation as well as to synthesize starch to counter osmotic stress. When osmotic stress was present, sucrose was synthesized as a temporal solution until starch synthesis began to occupy the intracellular space. When the space was reduced, a lesser amount of solute was required to deter osmotic stress. Furthermore, cells grew at a negligible rate under osmotic stress, and as time went on, they turned brown (Figure 1D). The browning cells were further tested, and we found that the illuminated batch began to grow new cells while the

non-illuminated batch showed no signs of growth (Figure 1E-F). The illuminated batch also showed a rise in SPS and SS activities (Figure 8B) whilst the activities of the batch without illumination remained negligible. This suggests that illumination may have induced the SPS gene expression for the cells that turned brown and hence lead to sucrose synthesis. The induction of the SS gene expression then decomposed the sucrose and provided the substrates needed for further growth. Thus, the cells began to grow. This showed that the cells had gone brown but had not died.

Figure 8. The changes of SPS and SS enzyme activities of sweet potato tuberous calli under different treatments. The activity recorded every 7 days revealed that SPS and SS had reached the maximum activities during the second week as well. High osmotic stress analysis for SPS and SS activity (C) also revealed that activity was higher in batches under high osmotic stress than in those without illumination. A, Dark; B, Illumination; C, Osmotic stress.

Figure 9. The PAS staining patterns of SPS from sweet potato tuberous calli under different treatment (Bar=50 mm). Fewer starch granules were observed in cells without illumination. After high osmotic stress treatment, more starch granules were produced. A, The PAS staining patterns (Dark); B, The PAS staining patterns (Illumination); C, The PAS staining patterns (Osmotic stress). SG: starch granule.


Lee et al. — Regulation of sucrose phosphate synthase of sweet potato callus

PAS Staining

The presence of carbohydrates in cells was demonstrated using PAS staining (Figure 9). Fewer starch grains were observed in cells without illumination. Furthermore, the cell walls were stronger (Figure 9A). After high osmotic stress treatment, more starch grains were produced (Figure 9C). The higher the stress level, the more starch grains were produced, and plasmolysis was observed. The cells

may try to reduce the intra-extracellular pressure difference by allowing water to dissipate outwards, causing the protoplast to contract, thus separating the cell membrane from the cell wall. When the turgor pressure was reduced, and the strength of the cell wall was also reduced. In other words, the cells tried to maintain the balance in osmotic pressure by raising the intracellular concentration. To achieve this, the cells must synthesize large amounts of

Figure 10. In situ hybridization of SPS by antisense probe in sweet potato tuberous calli under different treatment (Bar=50 mm). A, Dark; B, Illumination; C, Osmotic stress. Light and osmotic stress treatments induced the accumulation of SPS mRNA; D, Using in vitro transcription to synthesis RNA probe of SPS. The plasmid DNA containing sense and antisense cDNA would be cut to line by restriction enzyme. After addition, RNA and NTP reacted an h under 37°C. Running 1% agarose gel. E, The optimal concentration of RNA probe in in situ hybridization. Different concentrations of in vitro transcription RNA were dropped on the nitrocellulose membrane and stained with NBT/BCIP.


Botanical Bulletin of Academia Sinica, Vol. 44, 2003

starch, activating the genes related to sucrose-starch transformation. SS activity increases immensely under high osmotic stress, but only for the first week. One possible hypothesis is that, when cells are placed under high osmotic stress, they store non-structural substances, such as sucrose.

The sucrose produced by SPS was then catalyzed by SS to get into the sugar nucleotides (UDPG and ADPG), which were used to synthesize starch, directly or indirectly. A large amount of starch occupied the intracellular space, thus, allowing the cells to raise the intracellular concentration with less solute. Most of the fructose and glucose, from sucrose decomposition, was used to synthesize starch, indirectly. This limited the cellular growth and metabolic rate and led to the synthesis of starch grains as in our results.

In Situ Hybridization Technology

We used the SPS sense and antisense cDNA as the probe (Figure 10D-E) for in situ hybridization (Figure 10). A great amount of the antisense hybridized with the sense mRNA under the conditions of illumination and high osmotic stress, and this accounts for the dark blue shades in the cytoplasm on Figures 10B and 10C. This means that the SPS gene became highly expressive under illumination and high osmotic stress. In contrast, subjects without illumination appeared as a much lighter color, which suggests that the light induced SPS gene expression.

Discussion

Through the research on sweet potato callus, it was noted that illumination and high osmotic stress enhanced SPS gene expression. This was mainly known through in situ hybridization using probes specialized for the SPS nucleic acid from tuberous root. The trend showed that the amount of SPS protein was proportional to the level of activity. This also showed that gene expression layers mainly regulated SPS from the callus. Then again, the genetic expression is a result of the induction of illumination and high osmotic stress. If purified proteins were used to determine biochemical properties, we would have noticed that stressed-induce SPS was not enhanced by Glc 6-P or inhibited by Pi. Many of the biochemical properties are similar to what was noted in previously conducted studies (Chen et al., 2001) in this laboratory. The main function of a tuberous root is to store starch. The callus from the tuberous root should at least partially maintain its original properties. Nevertheless, illuminated SPS was enhanced by Glc 6-P and inhibited by Pi. This may suggest the existence of an isoenzyme. From the tissue slides, it was noted that large quantities of starch grains were synthesized under illumination and high osmotic stress, and SPS activity increased. All evidence seems to suggest that the SPS from the callus was closely related to the cumulated starch. The finding that intracellular metabolism favored starch synthesis rather than starch decomposition remains a worthy basis for future exploration.

Acknowledgements. The authors would like to thank the National Science Council in Taiwan for financially supporting this research (under grant NSC No. 90-2313-B-002-282). We appreciate Dr. Zheng-Chia Tsai and Dr. Ai-Yu Wang for generously providing the SS antibody.

Literature Cited

Chen, W.L., D.J. Huang, P.H. Liu, H.L. Wang, J.C. Su, and P.D. Lee. 2001. Purification and characterization of sucrose phosphate synthase from sweet potato tuberous roots. Bot. Bull. Acad. Sin. 42: 123-129.

Dali, N., D. Michaud, and S. Yelle. 1992. Evidence for the involvement of sucrose-phosphate synthase in the pathway of sugar accumulation in sucrose-accumulating tomato fruits. Plant Physiol. 99: 434-438.

Douglas, C.D. and S.C. Huber. 1983. Regulation of spinach leaf sucrose phosphate synthase by glucose-6-phosphate, inorganic phosphate, and pH. Plant Physiol. l73: 989-994.

Gavis, E.R. and R. Lehmann. 1992. Localization of Nanos RNA controls embryonic polarity. Cell 71: 301-313.

Giaquinta, R.T. 1983. Phloem loading of sucrose. Annu. Rev. Plant Physiol. 34: 347-387.

Guy, C.L., J.L. Huber, and S.C. Huber. 1992. Sucrose-phosphate synthase and sucrose accumulation at low temperature. Plant Physiol. 100: 502-508.

Harn, C., E. Khayat, and J. Daie. 1993. Expression dynamics of genes encoding key carbon metabolism enzymes during sink to source transition of developing leaves. Plant Cell Physiol. 34: 1045-1053.

Hubbard, N.L., D.M. Pharr, and S.C. Huber. 1990. Role of sucrose phosphate synthase in `sucrose biosynthesis in ripening bananas and its relationship to the respiratory climateric. Plant Physiol. 94: 201-208.

Huber, J.L.A., S.C. Huber, and T.H. Nielsen. 1989. Protein phosphorylation as a mechanism for regulation of spinach leaf sucrose-phosphate synthase activity. Arch. Biochem. Biophy. 270: 681-690.

Huber, S.C. and J.L. Huber. 1991. In vitro phosphorylation and inactivation of spinach leaf sucrose-phosphate synthase by an endogenous protein kinase. Biochim. Biophts. Acta. 1091: 393-400.

Huber, S.C. and J.L.A. Huber. 1992. Role of sucrose-phosphate synthase in sucrose metabolism in leaves. Plant Physiol. 99: 1275-1278.

Huber, S.C. and J.L. Huber. 1996. Role and regulation of sucrose-phosphate synthase in higher plants. Annu. Rev. Plant Physiol. Plant Mol. Biol. 17: 431-444.

Klein, R.R., S.J. Crafts-Brandner, and M.E. Salvucci. 1993. Cloning and developmental expression of the sucrose phosphate synthase gene from spinach. Planta 190: 498-510.

Nelson, N. 1944. A photometric adaptation of the Somogyi method for the determination of glucose. J. Biol. Chem. 153: 379-380.

Prioul, J.L. and N. Schwebel-Dugue. 1990. Source-sink manipulations and carbohydrate metabolism in maize. Crop Sci. 32: 751-756.

Riesmeier, J.W., L. Willmitzer, and W.B. Frommer. 1994. Evidence for an essential role of the sucrose transporter in phloem loading and assimilate partitioning. EMBO J. 13: 1-7.


Lee et al. — Regulation of sucrose phosphate synthase of sweet potato callus

phate synthase in spinach leaves. Plant Physiol. 14: 947-955.

Urao, T., T. Katagiri, T. Mizoguchi, K. Yamaguchi-Shinozaki, N. Hayashida, and K. Shinozaki. 1994. An Arabidopsis thaliana cDNA encoding Ca2+-dependent protein kinase. Plant Physiol. 105: 1461-1462.

Wang, H.L., P.D. Lee, W.L. Chen, D.J. Huang, and J.C. Su. 2000. Osmotic stress-induced changes of sucrose metabolism in cultured sweet potato cells. J. Exp. Bot. 51: 1991-1999.

Segrest, J.P. and R.L. Jackson. 1972. Molecular weight determination of glycoproteins by polyacrylamide gel electrophoresis in sodium dodecyl sulfate. Methods Enzymol. 28: 54-63.

Stitt, M., I. Wilke, R. Feil, and H.W. Heldt. 1988. Coarse control of sucrose-phosphate synthase in leaves. Planta 174: 217-230.

Toroser, D. and S.C. Huber. 1997. Protein phosphorylation as a mechanism for osmotic-stress activation of sucrose phos