Bot. Bull. Acad. Sin. (2004) 45: 331-337

Chuang et al. — Genetic diversity of non-heading Chinese cabbage in Taiwan

Genetic diversity and relationship of non-heading Chinese cabbage in Taiwan

Hsue-Yu Chuang1,3, Shing-Jy Tsao1, Jaw-Neng Lin2, Kan-Shu Chen2, Tsung-Dao Liou2, Mei-Chu Chung3, and Yau-Wen Yang3,*

1Department of Horticulture, National Taiwan University, Taiwan 106

2Fengshan Tropical Horticultural Experiment Station, Taiwan Agricultural Research Institute, Council of Agriculture, FengShan, Kaohsiung, Taiwan 830

3Institute of Botany, Academia Sinica, Nankang, Taipei, Taiwan 115

(Received February 16, 2004; Accepted June 8, 2004)

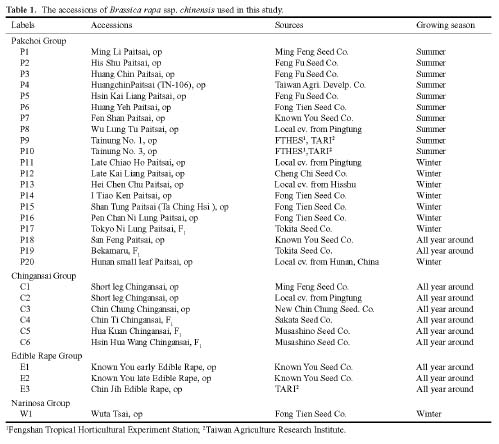
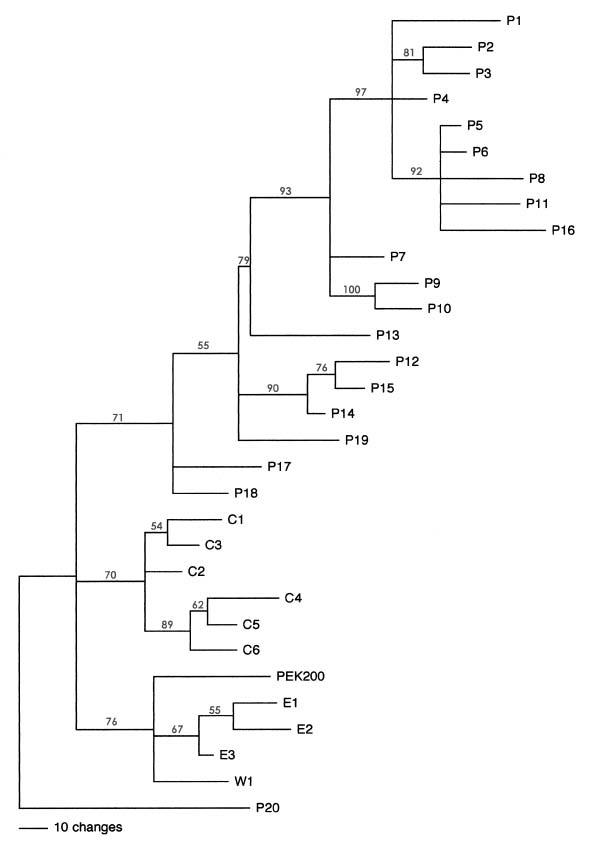
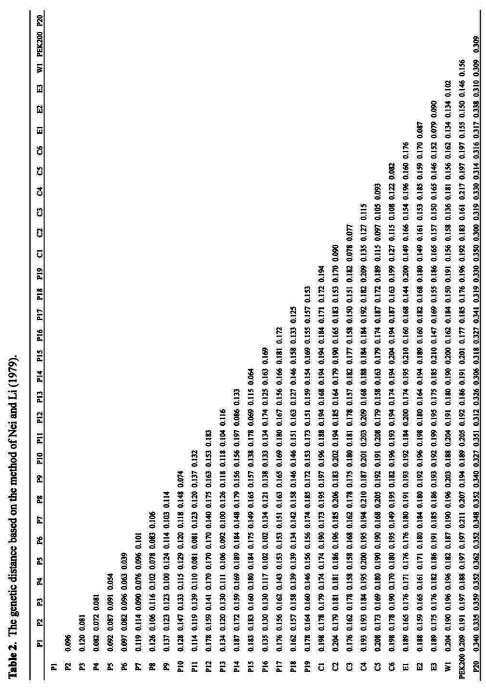
Abstract. DNA banding profiles generated by PCR reaction using different lengths of primers were used to study the genetic polymorphism and identities of 30 accessions from three major groups (pakchoi, chingansai, and edible rape) of Brassica rapa ssp. chinensis. Except for one accession later identified as B. juncea, all accessions can be separated into three major clades by applying maximum likelihood method as predicted by morphological taxonomy. Furthermore, the genetic relationships within different cultivar groups, and especially the pakchoi group, were also investigated based on their geography and growth habitat.

Keyword: Brassica rapa; Genetic diversity; Taiwan.

Introduction

Brassica rapa, one of the major economic Brassica crops, was probably introduced into China thousands of years ago and has since generated a rich morphological diversity in many subspecies and cultivar groups (Li, 1983; Opena et al., 1988). There are four major subspecies: chinensis, utilis, pekinensis, and rapifera (Ren et al., 1995). Of these, B. rapa ssp. chinensis (non-heading Chinese cabbage) is one of the most important vegetable crops in Taiwan. It accounts for 12% of total cultivated area for leaf vegetables (Taiwan Agriculture Yearly Report, 2001 in http: //www.coa.gov.tw/statistic/newyearbook/index.htm). The products of this subspecies translated into a market value of 2.7 billion NT dollars in 2001. Within chinensis, there are three major groups, pakchoi, chingansai, and edible rape, that account for many cultivars (including introductions) widely used in commercial year-round production in Taiwan. Although many cultivars were generated through intensive breeding in Taiwan, detailed documentation within this subspecies is often inadequate. In addition, some cultivars have lacked information about their genetic history since their introduction. Given the economic importance of these Brassica crops, improved methods are needed to appropriately identify the subspecies and group of each cultivar.

With the advent of recent methods in molecular biology, different molecular markers have been applied to the study

of phylogenetic relationships and identification among and within the Brassica species. These markers include restriction fragment length polymorphism (RFLP) (Song, 1988a, b; 1990; McGrath and Quiros, 1992), random amplified polymorphic DNA (RAPD) (Hu and Quiros, 1991; Quiros et al., 1991; Demeke et al., 1992; Kresovich et al., 1992; Mailer et al., 1994; Thormann et al., 1994; Ren et al., 1995; Lázaro and Aguinagalde, 1998; Divaret et al., 1999), and simple sequence repeat (SSR) (Kresovich et al., 1995; Charters et al., 1996; Szewc-McFadden et al., 1996; Westman and Kresovich, 1998; Plieske et al., 2001) among others. In this study, PCR analysis of DNA fingerprinting based on RAPD primers and simple sequence repeat (SSR) primers was used to generate molecular markers which were then used to study the genetic divergence and phylogenetic relationship among and within different cultivar groups in B. rapa ssp. chinensis. Based on these data, the corresponding relationships among geography, growing habit and known breeding history are discussed.

Materials and Methods

Plant Materials and DNA Extraction

In Brassica rapa ssp. chinensis, twenty accessions of the pakchoi group, six accessions of the chingansai group, three accessions of edible rape, and one accession of the narinosa group, collected by the Fengshan Tropical Horticultural Experimental Station, were used in this study (Table 1). An accession of Chinese cabbage (PEK 200) from Chinglong Seed Co. was used as a comparison. Leaves

*Corresponding author. E-mail: yauwen@sinica.edu.tw


Botanical Bulletin of Academia Sinica, Vol. 45, 2004

collected from a bulk of three plants of each accession grown under a controlled environment were used for DNA extraction according to methods described by Junghans and Metzlaff (1990) with a ratio of OD 260 to OD 280 between 1.7 and 2.0.

PCR Amplifications and Gel Electrophoresis

For RAPD analysis, eight decamer oligonucleotides, OPA 2, 15, 18, 20, OPB 10, 14, 15, and 18 selected from Operon kits A and B (Operon Technologies Inc. Alameda, CA, USA) were used for the amplification of extracted DNA after initial screening. PCR reaction was performed as described in Yang et al. (1998). RAPD bands from 400 bp to 2,500 bp were then scored as present in the 1.8% agarose containing 0.5% TBE with band density higher than 5 ng as compared with standard DNA markers. In the LP-PCR analysis, four 5'-anchored SSR primers (Charters et al., 1996), with ID numbers 888 (5'BDB-[CA]7-3'), 889 (5'DBD-

[AC]7-3'), 891 (5'HVH-[TG]7-3') and 1423 (5'HVH-[CA]7-3'), and a long primer, F13 (5'-AAGTGTTGGTTTTGGTTGTG-3') derived from the hypervariable sequences of rye (Diaz-Perales et al., 2001) were used where B is designated as C,G or T (not A); D is designated as not C; H is designated as not G, and V is designated as not T. PCR reaction mixtures (50 µl) contained 50 ng of genomic DNA, 0.2 mM dNTP, 0.8 µM primers, 1.5 mM MgCl2, and 1 unit of Taq DNA polymerase. PCR reactions were performed on a Robocycler gradient 96 (Stratagene Cloning system, CA, USA) for 1 cycle of 3 min at 94°C, 1.5 min at 55°C, 2.5 min at 72°C, 30 cycles of (2 min at 94°C, 1.5 min at 55°C, 2 min at 72°C) with a final cycle of 10 min at 72°C. Amplification products were then resolved onto 5.3% polyacrylamide gels containing 1´ TBE buffer (89 mM tris-borate, 2 mM EDTA, pH 8.0). Electrophoresis was applied at 200V for 5 h. The gels were then silverstained according to methods described by Rabilloud et al. (1988).


Chuang et al. — Genetic diversity of non-heading Chinese cabbage in Taiwan

Gel Scoring and Cluster Analysis

Bands were recorded as present or absent based on the banding profiles of RAPD markers, four 5'-anchored SSR primers (Charters et al., 1996) and an F13 primer (Diaz-Perles et al., 2001). The genetic distance was determined based on the method of Nei and Li (1979). Pairwise comparisons were performed using NTSYS 2.0 (Rohlf, 2000, Applied Biostatistics, Exeter Software, NY, USA). Tree reconstruction based on Bayesian analysis was performed using MrBayes, Version 3.0 (Huelsenbeck and Ronquist, 2001). The reliability of each clade was also calculated using MrBayes 3.0 as described by Hall (2001).

Results

Molecular Markers and Genetic Distance

In RAPD analysis, 132 bands were generated, including 10 monomorphic and 122 polymorphic bands. Among polymorphic markers, 31 were either cultivar or group-specific. Thirteen were specific for `HuNan pakchoi' (P20), thirteen for the pakchoi group (excluding P20), three for the chingansai group, and two for the edible rape group. In the LP-PCR analysis, using four 5'-anchored SSR primers and a long primer (F13) derived from the hypervariable sequences of rye, a total of 205 bands were generated in the polyacrylamide gels, including 60 monomorphic and 145 polymorphic bands. Twenty-one bands were cultivar or group specific, including nineteen for P20 and two polymorphic bands for the pakchoi group. Four polymorphic bands (F13-480, 500, p888-700, and 1250) were present in the pakchoi and edible rape group while two polymorphic bands (F13-1200 and p888-1450) were present in the pakchoi and changansai groups. (The above data is available upon request).

Genetic distance between each pair of cultivars was calculated based on the combined data from RAPD and LP-PCR analysis (Table 2). These results showed that P20, an introduction from Hu-Nan providence of Mainland China, was the most distant group in this study with an average distance of 0.330 ± 0.018 from the other accessions while PEK200 had an average distance of 0.188 ± 0.019 from the other accessions (excluding P20). The pairwise distances ranged from 0.039 to 0.197 with an average distance of 0.135 ± 0.033 among 19 accessions of the pakchoi group, from 0.077 to 0.135 with an average distance of 0.106 ± 0.019 among six accessions of the chingansai group, from 0.087 to 0.090 with an average distance of 0.085 ± 0.006 among three accessions of the edible rape group. The distance of Wuta Tsai (W1) to edible rape is shown to be closer than that of W1 to other cultivar groups (Table 2).

Phylogenetic Trees

In the maximum likelihood method, a 50% majority-rule consensus tree showing mean branch lengths from one-million generation MCMC analysis was performed using MrBayes 3.0 (Huelsenbeck and Ronquist, 2001). The reli

ability of each clade was also tested using the same software as described by Hall (2001). Phylogenetic trees were constructed based on the combined data of RAPD and LP-PCR shown in Figure 1. Again, P20 was shown to be the accession most distant from the other accessions in this study. The other accessions were clearly separated into three groups.

Based on MCMC analysis, three groups of Brassica rapa ssp. chinensis were separated with a high confidence level (Figure 1). Within the pakchoi group, ten summer accessions, P1 to P10, and two winter accessions, P11 and P16, were clustered together with a high confidence level (93%) while the remaining accessions showing more cold tolerance were located outside this composite clade. In the summer accessions of the pakchoi group, P2 and P3 were clustered, and P9 and P10 were clustered. Three summer accessions, P5, P6, and P8, were shown to be closely related with two winter accessions, P11 and P16. In the cold tolerant accessions (including winter and all year crops), P13, an OP originating from Tainan, was shown to be closely related to the clade of summer accessions with a

Figure 1. Phylogenetic tree generated by maximum likelihood method based on the data of 31 taxa in this study. The tree, which was generated by Bayesian analysis, shows mean branch lengths of 50% majority-rule consensus tree from one-million generation MCMC analysis. The numbers on the branches represent posterior probability values.


Botanical Bulletin of Academia Sinica, Vol. 45, 2004


Chuang et al. — Genetic diversity of non-heading Chinese cabbage in Taiwan

79% confidence level while P12, P15 and P14 were clustered with a 90% confidence level. P17 and P18 were located separately from the other accessions of the pakchoi group. In the chingansai group, C1 and C3 were clustered with a 54% confidence level, and C4, C5, and C6 were clustered with an 89% confidence level. In the edible rape group, E1 and E2 were clustered with a 55% confidence level before they joined E3 with a 67% confidence level. The only accession of the narinosa group (W1) was shown to be closely related to this group.

Discussion

This study showed the molecular markers generated by PCR reaction using eight decamer oligonucleotides, four 5'-anchored SSR primers and a long primer (F13) derived from the hypervariable sequences of rye can be used to distinguish the different accessions and cultivar groups within B. rapa ssp. chinensis. Although the use of molecular markers to study the relationship among the different subspecies within B. rapa has been previously reported (Ren et al., 1995) the relationships between and within cultivar groups in the same subspecies have not been reported. In this study, the accessions more heat-tolerant for their vegetative stage and grown from May to October were considered summer crops. The accessions more cold resistant for their vegetative growth and grown from November to April were considered winter crops, and the accessions that can be grown all year around were considered all year crops (Table 1).

The P20 accession has a plant type similar to the other accessions of the pakchoi group but is very distinct from the other accessions within this subspecies both in leaf morphology and DNA banding profiles. We further examined this accession by checking its karyogram using its root tip meristem cell, which identified it as an accession of B. juncea and not of B. rapa ssp. chinensis with n=18 (data not shown). Thus, this study confirms that P20 is a misidentified accession in the germplasm collections.

Although three phylogenetic trees were constructed based on UPGMA, NJ and ML methods, only the ML tree (Figure 1) was shown here for the following reasons. First, the reliability of each clade cannot be tested in UPGMA and NJ methods using the NTSYS software (Rohlf, 2000, Applied Biostatistics, Exeter software, NY, USA). Second, the UPGMA method is based on the assumption of a constant rate of evolution among different lineages. However, because of differences in the intensity of breeding programs (e.g. some cultivars were generated by crossing more generations than others), the rate of change in the molecular markers was often different for different lineages. Third, all three trees showed that pakchoi, chingansai, and edible rape can be separated into three groups with similar structures although there were some slight differences in the detailed relationships within each group. Fourth, the ML tree is more similar to the NJ tree than to the UPGMA tree. In addition, the ML tree can provide more information about the reliability of each clade using a 50% majority-rule consensus tree.

In the pakchoi group, two winter accessions (P11 and P16), all the summer accessions appear to be clustered in one group. Although P11 is a local winter accession, it originated from hybridization between two local accessions from which P8 (a summer accession) originated. So it is reasonable to conclude that P11 and P8 belong in the same clade. In the summer accessions of the pakchoi group, P2 and P3 were from the same company and with a similar morphology but different in color, so it was not surprising that these two accessions clustered together. Similar reasoning applies as well to P9 and P10. These two accessions are OP selected from the progeny of hybridization between two parental lines but differ in leaf color. P9 was shown to be greener than P10. P7 was one of the parental lines of P9 and P10 and was shown to be closely related to these two accessions in this study. Three summer accessions, P5, P6 and P8, were shown to belong in the same clade. These three accessions were from different sources but revealed a close genetic relationship although it is difficult to trace their breeding history. In the cold tolerant accessions (including winter and all year crops), P13, a local OP cultivar, was shown to be closely related to the clade of summer accessions. This accession was derived from progeny of the hybridization between two accessions in HisShu, Tainan. It is reasonable to assume that one of its parental lines may originate from a summer accession. Three accessions, P12, P15 and P14, were closely related, with P12 first clustering with P15 before they joined P14 in the ML tree (Figure 1). Since P14 and P15 are from the same seed company and have a genetic relationship with the cultivars from Japan, it is reasonable to assume that P12 has some genetic relationship with cultivars from Japan since most of them show cold tolerance and can maintain vegetative growth in the winter. Both P17 and P19 were from the Tokita Seed Company. P17, P18 and P19 were located outside the clade of P12, P14 and P15 and the clade of P1-P10, P11, P13 and P16 in the ML tree. In addition, P18, from Known You Co. in Taiwan, was shown to be closely related to P17 in the NJ tree (data not shown). This result may confirm that P18 was derived from the progeny of cultivars from Japan as its name suggests. Thus, this study confirms that cultivars with similar morphology and structures from the same company or the same origin are more likely to be clustered together as was previously shown for cauliflower and broccoli (Hu and Quiros, 1991).

Some of the relationships indicated by the markers were difficult to explain based on morphology or origin. In the chingansai group, three accessions, C4 (from Sakata Seed Co.) and C5 and C6 (both from Musashino Seed Co.) from Japan can be clearly separated from the three accessions, C1, C2 and C3 of Taiwan. However, in the ML tree, C4 and C5 were clustered first before they joined C6 while C1 and C3 were clustered first before they joined C2 (Figure 1). Conversely, in the NJ tree, C5 and C6 from the same seed company were clustered first before they joined C4, while C1 and C2 were clustered first before they joined C3 (data not shown). Resolving these differences based solely on the markers in this study is difficult. In the edible rape group, two accessions of edible rape from the Known You


Botanical Bulletin of Academia Sinica, Vol. 45, 2004

Seed Co. were closely related as compared to the one accession from the Taiwan Agricultural Experiment Station. The only accession of the narinosa group was shown to be closely related to the edible group as predicted by Li (1983). Although PEK200 was used as an outgroup, it was closely related to edible rape in this study. According to Li (1983), the pakchoi group was derived from the chingansai group by human selection. The edible rape and narinosa groups were more closely related to the pakchoi group. However, the relationships among these groups cannot be resolved based on these data.

In conclusion, these markers can help to establish the relationships among different accessions within different cultivar groups and are useful in finding the correspondence between similarity, geography, and growth habitat in different accessions of non-heading Chinese cabbage, especially in the pakchoi group as described by Charters (1996). The divergence shown in this group can provide us the needed information about the relationship among these accessions and help the breeder to generate new F1 hybrids.

Acknowledgments. We thank Dr. Chou Hung and an anonymous reviewer for their critical reading and suggestions for this manuscript. This work was partly supported by Council of Agriculture, Taiwan (S.-J. Tsao, Grant No. 92AS-1.1.2-FD-Z2(7)) and by Academia Sinica, Taiwan (Y.-W. Yang).

Literature Cited

Charters, Y.M., A. Roberson, and M.J. Wilkinson. 1996. PCR analysis of oilseed rape cultivars (Brassica napus L. ssp. oleifera) using 5'-anchored simple sequence repeat (SSR) primers. Theor. Appl. Genet. 92: 442-447.

Demeke, T., R. P. Adams, and R. Chibbar. 1992. Potential taxonomic use of random amplified polymorphic DNA (RAPD): a case study in Brassica. Theor. Appl. Genet. 84: 990-994.

Diaz-Perales, A., R. Linacero, and A.M. Vázquez. 2001. DNA amplification fingerprinting using two long primers. BioTechniques 30: 718-720.

Divaret I., E. Margalé, and G. Thomas. 1999. RAPD markers on seed bulks efficiently assess the genetic diversity of a Brassica oleracea L. collection. Theor. Appl. Genet. 98: 1029-1035.

Hall, B.G. 2001. Phylogenetic Trees Made Easy: A How to Manual for Molecular Biologists. Sinauer Assoc., Inc. MA, USA.

Huelsenbeck, J.P. and F. Ronquist. 2001. MRBAYES: Bayesian inference of phylogeny. Bioinformatics 17: 754-755.

Junghans, H. and M. Metzlaff. 1990. A simple and rapid method for the preparation of total plant DNA. BioTechniques 8: 176.

Hu, J. and C.F. Quiros. 1991. Identification of broccoli and cauliflower cultivars with RAPD markers. Plant Cell Rep. 10: 505-511.

Kresovich, S., A.K. Szewc-McFadden, S.M. Bliek, and J.R. McFerson. 1995. Abundance and characterization of simple-sequence repeats (SSRs) isolated from a size-fractionated genomic library of Brassica napus L. (rapeseed). Theor. Appl. Genet. 91: 206-211.

Kresovich, S., J.G.K. Williams, J.R. McFerson, E.J. Routman, and B.A. Schaal. 1992. Characterization of genetic identities and relationships of Brassica oleracea L. via a random amplified polymorphic DNA assay. Theor. Appl. Genet. 85: 190-196.

Lázaro, A. and I. Aguinagalde. 1998. Genetic Diversity in Brassica oleracea L. (Cruciferae) and wild relatives (2n=18) using RAPD markers. Ann. Bot. 82: 829-833.

Li, J. 1983. Chinese Bai Cai. Chinese Agriculture Publishing Co. (In Chinese).

Mailer, R.J., R. Scarth, and B. Fristensky. 1994. Discrimination among cultivars of rapeseed (Brassica napus L.) using DNA polymorphisms amplified from arbitrary primers. Theor. Appl. Genet. 87: 697-704.

McGrath, J.M. and C.F. Quiros. 1992. Genetic diversity at isozyme and RFLP loci in Brassica campestris as related to corp type and geographical origin. Theor. Appl. Genet. 83: 783-790.

Nei, M. and W.H. Li. 1979. Mathematical model for studying genetic variation in term of restriction endonucleases. Proc. Natl. Acad. Sci. USA 76: 5269-5273.

Opena, R.T., G.G. Kuo, and J.Y. Yoon. 1988. Breeding and Seed Production of Chinese Cabbage in the Tropics and Subtropics. Tech. Bul. 17. AVRDC, Taiwan.

Plieske, J. and D. Struss. 2001. Microsatellite markers for genome analysis in Brassica. I. Development in Brassica napus and abundance in Brassicaceae species. Theor. Appl. Genet. 102: 689-694.

Quiros, C.F., J. Hu, P. This, A.M. Chevre, and M. Delseny. 1991. Development and chromosomal location of genome-specific markers by polymerase chain reaction in Brassica. Theor. Appl. Genet. 82: 627-632.

Rabilloud, T., G. Carpentier, and P. Tarroux. 1988. Improvement and simplification of low-background silver staining of proteins by using sodium dithionite. Electrophoresis 9: 288-291.

Ren, J.P., J.R. McFerson, R.G. Li, S. Kresovich, and W.F. Lamboy. 1995. Identities and relationships among Chinese vegetable Brassicas as determined by Random amplified polymorphic DNA markers. Amer. J. Soc. Hort. Sci. 120: 548-555.

Rohlf, F.J. 2000. NTSYSpc—Numerical Taxonomy and Multivariate Analysis System, Version 2.01. Exeter software, NY, USA.

Song, K.M., T.C. Osborn, and P.H. Williams. 1988a. Brassica taxonomy based on nuclear restriction fragment length polymorphisms (RFLPs)—1. Genome evolution of diploid and amphidiploid species. Theor. Appl. Genet. 75: 784-794.

Song, K.M., T.C. Osborn, and P.H. Williams. 1988b. Brassica taxonomy based on nuclear restriction fragment length polymorphisms (RFLPs) __2. Preliminary analysis of subspecies within B. rapa (syn. campestris) and B. oleracea. Theor. Appl. Genet. 76: 593-600.

Song, K.M., T.C. Osborn, and P.H. Williams. 1990. Brassica taxonomy based on nuclear restriction fragment length polymorphisms (RFLPs) __3. Genome relationship in Brassica and related genera and the origin of B. oleracea and B. rapa (syn. campestris). Theor. Appl. Genet. 79: 497-506.

Szewc-McFadden, A.K., S. Kresovich, S.M. Bliek, S.E. Mitchell, and J.R. McFerson. 1996. Identification of polymorphic, conserved simple sequence repeats (SSRs) in cultivated


Chuang et al. — Genetic diversity of non-heading Chinese cabbage in Taiwan

Brassica species. Theor. Appl. Genet. 93: 534-538.

Thormann, C.E., M.E. Ferreira, L.E.A. Camargo, J.G. Tivang, T.C. Osborn. 1994. Comparison of RFLP and RAPD markers to estimating genetic relationships within and among cruciferous species. Theor. Appl. Genet. 88: 973-980.

Westman, A.L. and S. Kresovich. 1998. The potential for cross-

taxa simple sequence repeat (SSR) amplification between Arabidopsis thaliana L. and crop brassicas. Theor. Appl. Genet. 96: 272-281.

Yang, Y.W., W.H.J. Kuo, and T.H. Wong. 1998. Genetic polymorphism of seven populations of Capsella bursa-pastoris based on RAPD markers. Bot. Bull. Acad. Sin. 39: 17-21.