Bot. Bull. Acad. Sin. (2005) 46: 135-142

AHMAD et al. — Salt tolerance of green gram genotypes at various growth stages

Comparative morphological and physiological responses of green gram genotypes to salinity applied at different growth stages

Shakil AHMAD1, Abdul WAHID2,*, Ejaz RASUL2, and Abdul WAHID1

1Department of Botany, Government College University Lahore, Pakistan

2Department of Botany, University of Agriculture, Faisalabad-38040, Pakistan

(Received August 27, 2004; Accepted December 20, 2004)

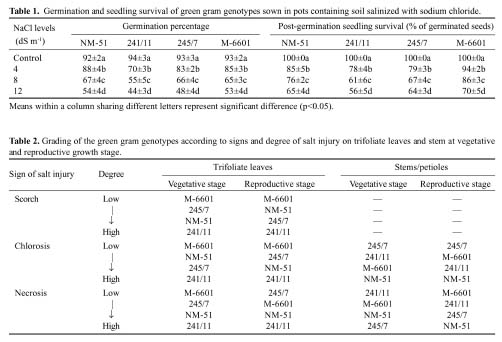
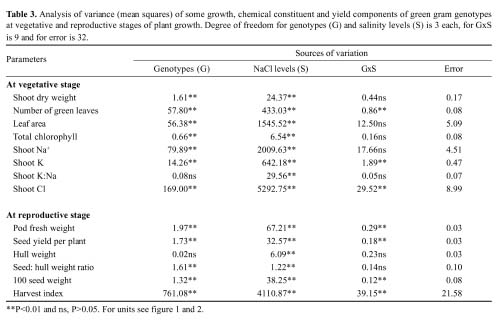
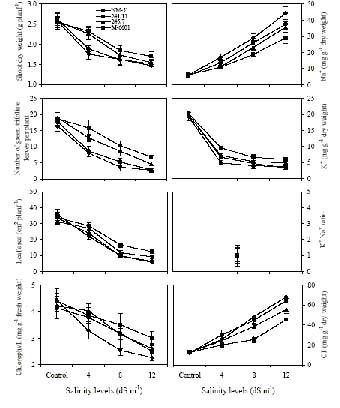
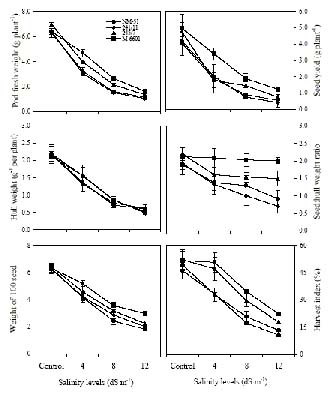
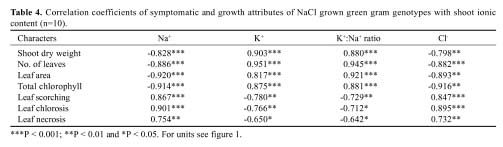
Abstract. Experiments were conducted to find the difference among green gram (Vigna radiata L. Wilczek) genotypes for salinity tolerance during germination and during vegetative and reproductive growth stages under NaCl treatment. Data revealed significant genotypic differences in germination percentage and post-germination survival of seedlings, symptoms of salt injury, changes in the levels of Na+, Cl- and K+ and total chlorophyll at the vegetative stage, and in pod development, seed yield, and yield components at the reproductive stage. Salinity tolerance in green gram was related to greater final germination and post-germination seedling survival, low scorching, chlorosis and necrosis of aerial parts, reduced Na+ and Cl-, slightly enhanced K+, and greater chlorophyll content. Appearance of increased symptoms on the aerial parts was positively related to increased Na+ and Cl- and negatively to increased K+. At maturity, pod weight, seed:hull weight ratio, 100-seed weight, seed yield and harvest index were also greater in M-6601. Maintenance of a steady seed:hull weight ratio in M-6601 indicated that a higher seed yield in this genotype is principally due to a greater partitioning of photoassimilates to seed rather than hull during pod development under saline conditions. Based on these criteria, M-6601 and 241/11 were declared salt tolerant and sensitive, respectively. Essentially then, ion-toxicity is the dominant factor modulating the salt tolerance of green gram during growth periods.

Keywords: Green gram; Harvest index; Ion-toxicity; Symptoms; Seed:hull weight ratio; Seedling survival.

Introduction

Rapidly increasing soil salinity has multifarious effects on plant growth and productivity. Salt-affected land comprises 19% of the 2.8 billion hectares of arable land on earth, and an increase in this menace is posing a serious threat to agriculture globally (Pessarakli and Szabolcs, 1999). Higher amounts of toxic ions in the root zone cause damage initially to roots and then to shoots after their transport. It is believed that greater ion injury at any stage of plant development is crucial for the maintenance of the active size of the canopy (Francois and Maas, 1999). Salt tolerance varies considerably with the developmental stages in a number of species (Wahid et al., 1997; Wilson et al., 2000). Tolerance at emergence followed by seedling survival and establishment are important in the maintenance of optimal crop stand in the field, and ultimately the economic yield (Wahid et al., 1999a; Raptan et al., 2001; Bayuelo-Jimenez et al., 2002).

The criteria used to appraise the salt tolerance potential of any plant species are morphological, physiological, and biochemical in nature (Rawson et al., 1988; Shannon, 1997; Flowers, 2004; Ashraf and Harris, 2004). The morphological criteria include stunted growth (Srivastava and Jana, 1984; Boyd and Rogers, 2004), leaf scorch (Barroso and Alvarez, 1997; Karakas et al., 2000), chlorosis of green parts (James, 1988; Pentalone et al., 1997; Husain et al., 2003),

and necrosis of leaves (Volkmar et al., 1998; Chen et al., 2003). Physiological criteria are tissue ionic contents and photosynthetic rate (Schachtman and Munns, 1992; Murillo-Amador et al., 2002; Morant-Manceau et al., 2004) while biochemical ones include qualitative and quantitative changes in proteins, fats, and carbohydrate patterns (Dubey, 1999; Khatkar and Kuhad, 2000; Bassil and Kaffka, 2002). Induced nutrient deficiency is one of the most important aspects of salinity, leading as it does to serious perturbation of normal cellular activities. The appearance of signs of salt damage is due to alterations in the nutrient status of tissues, which can be used to diagnose a stress response. For instance, deficiency of K+ leads to chlorosis followed by necrosis of leaves (James, 1988). Deficiency of N and Ca2+ leads to chlorosis (yellowing), and one of P results in necrotic spots on the leaf surface (Taiz and Zeiger, 2002). A majority of the criteria of salinity tolerance are physiological and biochemical (Ashraf and Harris, 2004), and only a few are concerned with the morphological changes at different stages (Wahid et al., 1999b; Husain et al., 2003; Boyd and Rogers, 2004). In addition, attributes like greater seed yield per plant and harvest index are adjudged as valid determinants of salinity response (Lawn and Rebetzke, 1991; Volkmar et al., 1998; Zeng et al., 2001; Bassil and Kuffka, 2002). Taken together, these factors can be used to predict the salinity response and to develop remedial strategies thereafter.

Green gram (Vigna radiata L. Wilczek) is an important traditional crop the world over. It is of short duration, re

*Corresponding author: E-mail: drawahid2001@yahoo.com


Botanical Bulletin of Academia Sinica, Vol. 46, 2005

the reproductive stage, pots were salinized at the 80th day after emergence (at the onset of flowering) and harvested at maturity to record pod and seed characteristics.

Symptomatic, Growth and Yield Determinations

Three upper fully expanded trifoliate leaves were visually recorded and graded on a numeric scale for the incidence of symptoms of salt injury such as scorch, chlorosis and necrosis at the vegetative and adult stages (Wahid et al., 1999b). For stems and branches, both chlorosis and necrosis were recorded, and for pods only browning (chlorosis) was noted. Leaf number on each plant was recorded, and their areas were determined using a leaf area meter (Model Li-3000, Licor, Lincoln, USA). To record dry weight, the plants were harvested at ground level, put in paper bags, and dried in an oven at 70°C for seven days. The fresh weight of pods and seeds was recorded, and 100-seed weight and seed yield per plant were taken after separating the seeds from hulls. Harvest index was computed as [(seed yield/straw yield) × 100].

Ion and Chlorophyll Content Determination

For the determination of Na+ and K+ contents from shoots, the dried powdered material (0.5 g) was digested in an HNO3:HClO4 mixture (3:1 v/v) at 280°C for 2 h, or until a sample had been digested, cooled, and made up to a volume of 50 ml using deionized water. Both Na+ and K+ were determined on flame-photometer (Sherwood Model 410, Cambridge, UK). For Cl- contents determination, the powdered material (0.5 g) was boiled in water in a screw capped test tube for 1 h, then cooled, filtered, and made up to a volume of 50 ml for analysis by chloride analyzer (Model-VC-HI Central Kagaku Corp., Japan). For chlorophyll determination, fresh leaves were enclosed in black plastic bags, put on ice in a bucket, brought to laboratory, extracted (0.5 g sample) in 80% acetone (100 ml) using a blender, and vacuum filtered. The filtrate was immediately determined for total chlorophyll at 652 nm (Yoshida et al., 1976).

Statistical Analysis

All the experiments were conducted in a completely randomized design with three replicates. Two season's data were pooled for statistical analysis. Analysis of variance (ANOVA) was performed to determine statistically significant differences among genotypes, salinity levels, and their interactions. Duncan's new multiple range test was applied to compare the treatment means. Simple linear correlation coefficients were computed to establish relationships between graded values of symptomatic and physiological attributes of genotypes under salinity.

Results

Germination and Seedling Survival

Although genotypes indicated a reduction in the final seed germination under increased salinity, a significant genotypic difference was evident. NM-51 and M-6601 un

quires low inputs, yields highly, and serves as an excellent source of protein as seed or sprout. The area under this crop continues to increase because it can be cultivated as a fallow or rotation crop after rice and groundnut in normal soils (Srinives, 1990). Major obstacles to the growth and productivity of green gram in arid and semiarid regions are the ever-increasing salinity and sodicity of soils and the scarcity of good quality irrigation water. Green gram has been categorized as salt-sensitive with a threshold of <2 dS m-1 (Minhas et al., 1990) albeit some varieties sustain and give acceptable yields under higher relative salinity levels (Misra and Dwivedi, 2004). Although quite a few studies are available on the ionic and physiological relations (Lawn and Rebetzke, 1991; Zayed and Zeid, 1997; Raptan et al., 2001), no systematic study documents the interrelationships of salt-induced symptomatic and physiological changes and their significance in the prediction of salinity response. The aim of this study was to seek suitable criteria and to decipher the physiological basis of salt tolerance by drawing parallels between various morphological, physiological, and yield attributing components.

Materials and Methods

Plant Material and General Experimental Details

The green gram genotypes used in this study included genetically distinct approved varieties and promising advanced lines obtained from the Ayub Agricultural Research Institute, Faisalabad (M-6601), the Nuclear Institute for Agriculture and Biology, Faisalabad (NM-51), and the University of Agriculture, Faisalabad, Pakistan (245/7 and 241/11). Germination test of the genotypes was performed in soil salinized with NaCl to accomplish 4, 8 and 12 dS m-1, and in a control. Selected healthy seeds were surface sterilized with 0.1% (w/v) HgCl2 for 3 min, washed repeatedly with sterilized distilled water, sown (50 seeds) directly in pans, and kept in a greenhouse. Data on germination percentages was recorded on alternate days, until no further germination was notable in control pans. The seedlings were allowed to grow for another five days to test their post-germination survival. For studies at vegetative and reproductive stages, ten surface sterilized seeds were directly sown in pots containing 10 kg of loam and lined with double layer of polyethylene sheets. After germination and thinning, four plants of uniform size were maintained in each pot. Salt solution was gradually added to the pots @ 20 mmol NaCl L-1 per day to achieve 4, 8, and 12 dS m-1 levels, based on full field capacity of soil. No salt was added to the control. The physico-chemical characteristics of the soil were: sand 39%, silt 32%, clay 28%, (textural class loam), organic matter 1.45%, pH 7.3, ECe 1.41 dS m-1, cation exchange capacity 14.2 meq 100 g-1 soil, sodium absorption ratio 0.11. Amounts of some ions were as follows (meq L-1): Na+ 3.39, Cl- 6.13, SO42- 1.43 and Ca+Mg 17.3. The plants were irrigated with tap water to maintain soil moisture at field capacity. At the vegetative stage, salinity was gradually applied 55 days after emergence of seedlings, and plants were harvested on the 70th day. At


AHMAD et al. — Salt tolerance of green gram genotypes at various growth stages

der non-saline or saline conditions exhibited similar germination. Post-germination survival of seedlings of all genotypes, however, decreased under salinity stress. M-6601, followed by NM-51, performed better in this regard (Table 1).

Salt Injury Symptoms

Symptoms of salt injury were recorded on leaves and stems at vegetative and reproductive stages (Table 2). Visual evaluation revealed that scorching of trifoliate leaves was lowest in M-6601, followed by 245/7 at vegetative, and in M-6601 followed by NM-51 at reproductive stages. Chlorosis of leaves, however, indicated a definitive pattern, being low in M-6601 and high in 241/11 at vegetative or reproductive stages. No definitive pattern was evident among the genotypes for stem chlorosis at the two stages. Likewise, trifoliate leaf necrosis was low in M-6601 and 245/7 at vegetative or adult stages, respectively, but 241/11 again showed the highest necrosis. No genotypic difference was noted for stem necrosis at any stage.

Growth Characteristics and Chlorophyll Content

Applied NaCl salinity significantly affected the shoot dry weight of all the genotypes, but there was no genotype or salinity interaction (Table 3). Shoot dry weight was the highest in M-6601 under control or high salinity conditions, but the difference among the genotypes was noted. The number of green trifoliate leaves, however, was

the measurement most affected in all the genotypes, with 241/11 and NM-51 incurring a significant loss (Figure 1). High magnitude changes among the green trifoliate leaf numbers revealed significant differences between the genotypes, salinity levels, and an interaction of these factors (Table 3). A significant reduction in number of green leaves resulted in severely curtailed photosynthetic area as was evident from a significant difference among the genotypes and salt levels (Table 3). Leaf area per plant was the highest under either condition in M-6601; this genotype incurred the lowest (63%) and 241/11 showed highest (82%) reduction in this parameter under NaCl (Figure 1). Although salinity reduced the total chlorophyll content of leaves, a significant difference among the genotypes and salt levels was noted (Table 3). However, at 12 dS m-1 maximum chlorophyll contents were noted in M-6601, followed by 245/7 (Figure 1).

Shoot Ionic Relations

Analysis of shoot ion content showed that all the genotypes had increased levels of Na+ and Cl- and concomitantly decreased K+ levels, with increased substrate salinity (Figure 1). The difference among the genotypes and salinity levels and their interaction was significant (Table 3). Genotype 241/11 indicated the highest while M-6601 showed the lowest Na+ and Cl- content in the shoot. Lowest K+ content was noted in NM-51, and the highest was in M-6601 under the highest salt condition (12 dS m-1). The


Botanical Bulletin of Academia Sinica, Vol. 46, 2005

K+:Na+ ratio, on the other hand, plunged with increased salinity, and a difference among the genotypes was not evident (Table 3). Nevertheless M-6601 manifested a minimum reduction in this ratio (Figure 1).

Pod and Seed Yield Attributes

Pod fresh weight recorded at maturity was the highest for 245/7 under control conditions; however, applied NaCl severely reduced this attribute in all genotypes. M-6601 had the highest pod weight (Figure 2). This resulted in significant difference among the genotypes, salinity levels and interaction of genotypes and salinity (Table 3). All genotypes showed a severe reduction in seed yield as the salinity levels increased; there was an interaction of genotypes and salinity levels (Table 3). Although the genotypes did not differ significantly for hull weight, salinity treatments reduced it significantly. Despite this, low hull weight was observed in M-6601 and high in 245/7 and NM-51 under saline conditions (Figure 2). The seed:hull weight ratio revealed significant difference among the genotypes and salt levels (Table 3). This ratio remained steady in M-6601, fell significantly in the others, and was the lowest in 241/11 (Figure 2). Applied salinity significantly reduced the seed yield per plant; M-6601 incurred the lowest and 241/11 the highest reduction in both these attributes (Figure 2). Likewise, the 100-seed weight of the genotypes also fell drastically with increased salinity, indicating a significant difference among genotypes and salinity levels (Table 3). NM-51 showed the highest (~71%) and M-6601 the low

Figure 1. Changes in some growth characteristics chlorophyll and ionic relations of mungbean genotypes under NaCl salinity at vegetative stage.


AHMAD et al. — Salt tolerance of green gram genotypes at various growth stages

est (~53%) reduction in this parameter (Figure 2). Harvest index indicated a significant reduction due to salinity in all the genotypes, with a significant genotype and salinity interaction (Table 3). The maximum reduction (77%) in this attribute was noted in 241/11, and the minimum (57%) occurred in M-6601 (Figure 2).

Correlation Studies

There was a strong negative association of all the growth parameters and chlorophyll content with the Na+ and Cl- content but a strong positive relationship with K+ and the K+:Na+ ratio (Table 4). Greater leaf scorching showed a strong positive relationship with Na+ and Cl- but a weak and negative one with K+ and the K+:Na+ ratio. Similarly, leaf chlorosis indicated a strong positive association with Na+ and Cl- but only a weak correlation with

K+ and the K+:Na+ ratio. Leaf necrosis, on the other hand, indicated a relatively weaker association with increased toxic ionic content or K+ and the K+:Na+ ratio (Table 4). Total chlorophyll showed a strong negative relationship with scorching (r=-0.843) and chlorosis (r=-0.811), but a weak correlation with necrosis (r=-0.624).

Discussion

Manifestation of stress tolerance by plant species at any growth stage is important because it has implications for economic yield. In view of the inter- and intra-specific differences (Wahid et al., 1997; Boyd and Rogers, 2004; Flowers, 2004), it is becoming increasingly important to explore this variation and select materials with desireable traits. The green gram genotypes in this study revealed significant difference for germinability and seedling survival under salinity (Table 1). A greater germination and post-emergence seedling survival, as shown by M-6601, carries significance in terms of accomplishment of appropriate crop stand in the field (Bani-Aameur and Sipple-Michmerhuizen, 2001; Misra and Dwivedi, 2004). These findings suggests that, albeit markedly affected with respect to germinability and post-germination survival of seedlings, green gram is capable of maintaining a requisite plant population in low to moderate saline soils.

Plant salt tolerance is modulated by the genetic potential and prevailing environmental conditions (Asch et al., 1999; Mauromicale and Licandro, 2002). Tissue ionic contents of salt grown plants depict the stand health, which can be noted from different morphological symptoms appearing on various parts (Barroso and Alvarez, 1997; Wahid et al., 1999b; Karakas et al., 2002). These symptoms are quite often observed due to ion-induced toxicity/injury and nutrient deficiency, as reported for various plant species including green gram (Wahid et al., 1999b; Fostad and Pederson, 2000; Chartzoulakis et al., 2002; Misra and Dwivedi, 2004). Symptoms of interest were scorching, chlorosis and necrosis of leaves, and chlorosis and necrosis of stems as noted visually or from the reductions in total leaf chlorophyll contents (Figure 1). These signs were intensified with increased salinity levels but with remarkable genotypic differences at both developmental stages (Table 2). Moreover, there were differences in reduction of the dry matter yield and photosynthetic area of the genotypes

Figure 2. Changes in pod and seed yield characteristics green gram genotypes under NaCl salinity at reproductive stage.


Botanical Bulletin of Academia Sinica, Vol. 46, 2005

(Figure 1). The genotypes showed an enhanced content of Na+ and Cl- in their shoots and a concomitant decrease in K+ content, as has been observed in green gram (Misra and Dwivedi, 2004; Wahid et al., 2004) and other crops (Shannon, 1997; Asch et al., 1999; Wahid, 2004). Increased tissue ionic contents indicated a negative association with the growth of salt-grown plants (Table 4). Increased shoot Na+ and Cl- revealed a strong positive correlation with increased scorch and with the chlorosis and necrosis of trifoliate leaves. The deficiency of K+ initially leads to chlorosis and then necrosis (Gopal and Dube, 2003). Excess Na+ and Cl- also leads to the appearance of symptoms like those in K+ deficiency. It is, however, noteworthy that M-6601 had the highest K+ and lowest Na+ and Cl- contents, together with increased chlorophyll content, of all the genotypes. It also manifested the fewest visual symptoms and possessed the greatest dry matter yield and photosynthetic area under salinity stress (Figure 2). From these associations, it is evident that chlorosis and the scorching of leaves, rather than necrosis, are the plausible reasons for the hampered growth of green gram genotypes (Table 4).

Salt tolerance at the reproductive stage is the most important in terms of economic yield. The development of reproductive organs, which is under the control of photoassimilate production and partitioning by the source tissues, is at this stage the most critical (Taiz and Zeiger, 2002; Wahid and Rasul, 2004). Increased salinity has a pronounced effect on this phenomenon, resulting in hampered fruit development and yield (Ho and Adams, 1994; Poljakoff-Mayber and Lerner, 1999; Araki et al., 2001). Many reports document the changes in seed yield and harvest index as reliable yardsticks to appraise salinity tolerance (Volkmar et al., 1998; Asch et al., 1999; Zeng et al., 2001). This study revealed a remarkable reduction in the pod weight, 100-seed weight, and seed yield per plant in green gram in response to NaCl. Genotype M-6601 displayed the greatest 100-seed weight, seed yield per plant, and harvest index. This indicates that salinity affected the seed filling and its yield by curtailing the supply of photosynthates to the developing pods. This is more assignable to the reduced photosynthetic efficiency of the leaves in a salt grown plant. Since the trifoliate leaves of a tolerant genotype indicated fewer symptoms of salt injury, it is likely that this genotype, by virtue of greater photosynthetic rates, directed the supply of available photosynthates to the developing pods, resulting in a comparatively greater seed yield. Another important factor may be the significant (up to 20%) contribution from the pod's own photosynthesis to the carbon budget while green (Wahid and Rasul, 2004). In the presence of genotypic difference, the pod chlorosis (data not shown) also appeared to partly affect the final seed yield.

There was a great difference among genotypes in the seed:hull weight ratio although not much difference in the hull weight (Figure 2). Pod hull as a protective sterile tissue has few implications for economic yield although it may have importance in the storage of toxic ions, minimizing their supply to the developing seed during filling

(Sharma and Gill, 1995; Araki et al., 2001). Although no difference existed for hull weight, substantial genotypic difference for the seed:hull weight ratio appeared (Figure 2), presumably as a function of assimilate partitioning. This implies that the pattern of partitioning of the available photoassimilates to seed rather than hull during pod development is one of the crucial factors in determining the seed yield and harvest index of green gram under saline conditions.

It emerges from this study that salinity tolerance in green gram is related to better seedling survival at the initial stage, low scorching, chlorosis and necrosis of leaves, reduced levels of shoot-Na+ and Cl-, and increased K+ levels during vegetative growth. More efficient photoassimilates partitioned to seed, rather than hull, during pod growth is important for accruing higher seed yield and yield components under saline conditions. These criteria may be used as yardsticks in selecting salt tolerant materials of green gram, in particular, and other crops in general.

Literature Cited

Araki, T., M. Kitano, K. Okano, S. Yoshida, and T. Eguchi. 2001. Environmental effects on dynamics of fruit growth and photoassimilate translocation in tomato plants (3): effect of salt stress. Environ. Cont. Biol. 39: 53-58.

Asch, F., M. Dingkuhn, C. Wittstock, and K. Doerffling. 1999. Sodium and potassium uptake by salinity and season in relation to yield and yield componenets. Plant Soil 207: 133-145.

Ashraf, M and P.J.C. Harris. 2004. Potential biochemical indicators of salinity tolerance in plants. Plant Sci. 166: 3-16.

Bani-Aameur, F. and J. Sipple-Michmerhuizen. 2001. Germination and seedling survival of Argan (Argania spinosa) under experimental saline conditions. J. Arid. Environ. 49: 533-540.

Barroso, M.C.M. and C.E. Alvarez. 1997. Toxicity symptoms and tolerance of strawberry to salinity in the irrigation water. Sci. Hort. 71: 177-188.

Bassil, E.S. and S.R. Kuffka. 2002. Response of safflower (Carthamus tinctorius L.) to saline soils and irrigation: II. Crop response to salinity. Agri. Water. Managmnt. 54: 81-92.

Bayuelo-Jimenez, J.S., R. Craig, and J.P. Lynch. 2002. Salinity tolerance of Phaseolus species during germination and early seedling growth. Crop Sci. 42: 584-1594.

Boyd, D.C. and M.E. Rogers. 2004. Effect of salinity on the growth of chicory (Cicorium intybus cv. Puna) _ a potential dairy forage species for irrigation areas. Aust. J. Expt. Agri. 44: 189-192.

Chartzoulakis, K., M. Loupassaki, M. Berkati, and I. Androulakis. 2002. Effect of NaCl salinity on growth, ion content and CO2 assimilation rate of six olive cultivars. Sci. Hort. 96: 235-247.

Chen, S., S. Wang, E. Fritz, A. Huttermann, and A. Altman. 2003. Effect of NaCl on shoot growth, transpiration, ion compartmentation, and transport in regenerated plants of Populus euphretica and Populus tomentosa. Can. J. For. Res. 33: 967-975.


AHMAD et al. — Salt tolerance of green gram genotypes at various growth stages

Dubey, R.S. 1999. Protein synthesis by plants under stressful conditions. In M. Pessarakli (ed.), Handbook of Plant and Crop Stress. Marcel Dekker Press Inc. New York, pp. 365-397.

Flowers, T.J. 2004. Improving crop salt tolerance. J. Exp. Bot. 55: 307-319.

Fostad, O. and P.A. Pedersen. 2000. Container-grown tree seedling responses to sodium chloride application in different substrates. Environ. Pollut. 109: 203-210.

Francois, L.E. and E.V. Maas. 1999. Crop response and management on salt affected soils. In M. Pessarakli (ed.), Handbook of Plant and Crop Stress. Marcel Dekker Press Inc. New York, pp. 169-201.

Gopal, R and B.K. Dube. 2003. Influence of variable potassium on barley metabolism. Ann. Agri. Res. 24: 73-77.

Ho, L.C. and P. Adams. 1994. Regulation of the partitioning of dry matter and calcium in cucumber in relation to fruit growth and salinity. Ann. Bot. 73: 539-545.

Husain, S., R. Munns, and A.G. Codon. 2003. Effect of sodium exclusion trait on chlorophyll retention and growth of durum wheat in saline soil. Aust. J. Agric. Res. 54: 589-597.

James, D. 1988. Salinity tolerance of blackgram and mungbean: II. Mineral ion accumulation in different plant parts. Soil Sci. 145: 53-58.

Karakas, B., R.L. Bianco, and M. Reiger. 2000. Association of marginal leaf scorch with sodium accumulation in salt stressed peach. HortSci. 35: 83-84.

Khatkar, D. and M.S. Kuhad. 2000. Short-term salinity induced changes in two wheat cultivars at dufferent growth stages. Biol. Plant. 43: 629-632.

Lawn, R.J. and G.J. Rebetzke. 1991. Indigenous Vigna spp. As a source of germplasm for mungbean improvement. In B.C. Imre and R.J. lawn (eds.), Mungbean: the Australian Experience. Proceedings of the First Australian Mungbean Workshop. Brisbane, pp. 21-29.

Mauromicale, G. and P. Licandro. 2002. Salinity and temperature on germination, emergence and seedling growth of globe artichoke. Agronomie 22: 443-450.

Minhas, P.S., D.R. Sharma, and B.K. Khosla. 1990. Mungbean response to irrigation with waters of different salinities. Irrig. Sci. 11: 57-62.

Misra, N. and U.N. Dwivedi. 2004. Genotypic differences in salinity tolerance of green gram cultivars. Plant Sci. 166: 1135-1142.

Morant-Manceau, A., E. Pradier, and G. Tremblin. 2004. Osmotic adjustment, gas exchange and chlorophyll fluorescence of a hexaploid triticale and its parental species under salt stress. J. Plant Physiol. 161: 25-33.

Murillo-Amador, B., E. Troyo-Dieguez, R. Lopez-Aguilar, A. Lopez-Cortes, C.L. Tinoco-Ojanguri, H.G. Jones, and C. Kaya. 2002. Matching physiological traits and ion concentrations associated with salt tolerance with cowpea genotypes. Aust. J. Agric. Res. 53: 1243-1255.

Pentalone, V.R., W.J. Kenworthy, L.H. Slaughter, and B.R. James. 1997. Chloride tolerance in soybean and perennial Glycine accessions. Euphytica 97: 235-239.

Pessarakli, M. and I. Szabolcs. 1999. Soil salinity and sodicity as particular plant/crop stress factor. In M. Pessarakli (ed.), Handbook of Plant and Crop Stress. Marcel Dekker Press Inc. New York, pp. 1-16.

Poljakoff-Mayber, A. and H.R. Lerner. 1999. Plants in saline environment. In M. Pessarakli (ed.), Handbook of Plant and Crop Stress. Marcel Dekker Press Inc. New York, pp. 125-152.

Raptan, P.K., A. Hamid, Q.A. Khaliq, A.R.M. Solaiman, J.U. Ahmed, and M.A. Karim. 2001. Salinity tolerance of blackgram and mungbean: II. Mineral ion accumulation in different plant parts. Kor. J. Crop Sci. 46: 387-394.

Rawson, H.M., R.A. Richards, and R. Munns. 1988. An examination of selection criteria for salt tolerance in wheat, barley and triticale genotypes. Aust. J. Agric. Res. 39: 759-772.

Schachtman, D.P. and R. Munns. 1992. Sodium accumulation in leaves of Triticum species that differ in salt tolerance. Aust. J. Plant Physiol. 19: 331-340.

Shannon, M.C. 1997. Adaptation of plants to salinity. Adv. Agron. 60: 76-199.

Sharma, P.C. and K.S. Gill. 1995. Performance and ionic accumulation in Brassica juncea and B. carinata genotypes under salinity. Plant Physiol. Biochem. 22: 154-158.

Srinives, P. 1990. Mungbean breeding and genetic resources in Thailand. In Report at the mungbean meeting 90 Kamphaeng Saen Campus in Nakhon Pathom, Thailand: Department of Agronomy, Kasetsart University, pp. 1-10.

Srivastava, J.P. and S. Jana. 1984. Screening wheat and barley germplasm for salt tolerance. In R.C. Staples and G.H. Toeniessen (eds.), Salinity Tolerance in Plants: Strategies for Crop Improvement. John-Wiley New York, pp. 223-284.

Taiz, L. and E. Zeiger. 2002. Plant Physiology, 3rd ed. Sinauer Associates Inc Publishers Massachusetts.

Volkmar, K.M., Y. Hu, and H. Steppuhn. 1998. Physiological responses of plants to salinity: a review. Can. J. Plant Sci. 78: 19-27.

Wahid, A. 2004. Analysis of toxic and osmotic effects of sodium chloride on leaf growth and economic yield of sugarcane. Bot. Bull. Acad. Sin. 45: 133-141.

Wahid, A. and E. Rasul. 2004. Photosynthesis in leaf, stem, flower and fruit. In M. Pessarakli (ed.), Handbook of Photosynthesis, 2nd Ed. CRC Press Florida, pp. 479-497.

Wahid, A., M. Hameed, and E. Rasul. 2004. Salt-induced injury symptoms, changes in nutrient and pigment composition, and yield characteristics of mungbean. Int. J. Agri. Biol. 6: 1143-1152.

Wahid, A., A.R. Rao, and E. Rasul. 1997. Identification of salt tolerance traits in sugarcane lines. Field Crop. Res. 54: 9-17.

Wahid, A., E. Rasul, and A.R. Rao. 1999a. Germineration of seeds and propagules under salt stress. In M. Pessarakli (ed.), Handbook of Plant and Crop Stress. Marcel Dekker Press Inc. New York, pp. 153-167.

Wahid, A., I. Masood, I-ul-H Javed, and E. Rasul. 1999b. Phenotypic flexibility as marker of sodium chloride tolerance in sunflower genotypes. Environ. Exp. Bot. 42: 85-94.

Wilson, C., S.M. Lesch, and C.M. Grieve. 2000. Growth Stage Modulates Salinity Tolerance of New Zealand Spinach (Tetragonia tetragonioides, Pall.) and Red Orach (Atriplex hortensis L.). Ann. Bot. 85: 501-509.

Yoshida, S., D.A. Forno, J.H. Coch, and K.A. Gomez. 1976. Laboratory Manual for Physiological Studies of Rice. IRRI Los Banos.


Botanical Bulletin of Academia Sinica, Vol. 46, 2005

Zayed, M.A. and I.M. Zeid. 1997. Effect of water and salt stresses on growth, chlorophyll, mineral ions and organic solute content, and enzyme activity in mung bean seedlings. Biol. Plant. 40: 351-356.

Zeng, L., M.C. Shannon, and S.M. Lesch. 2001. Timing of salinity stress affects rice growth and yield components. Agric. Water. Managmt. 48: 191-206.