Botanical Studies (2010) 51: 377-386.

ECOLOGY
Distribution pattern and conservation priorities for
vascular plants in Southern China: Guangxi Province as
a case study
Man-Fu HOU1,2,3, Jordi LOPEZ-PUJOL4, Hai-Ning QIN1*, Li-Song WANG1, and Yan LIU5
1State Key Laboratory of Systematic and Evolutionary Botany, Institute of Botany, the Chinese Academy of Sciences, Beijing 100093, PR. China
2 Graduate University of Chinese Academy of Sciences, Beijimg 100049, P.R. China
3Sources and Environment College, Guangxi Teacher's University, Nanning 530001, PR. China
4Botanic Institute of Barcelona (CSIC-ICUB), Passeig del Migdia s/n, E-08038 Barcelona, Spain
5 Guangxi Institute of Botany, Guangxi Zhuang Autonomous Region and the Chinese Academy of Sciences, Guilin 541006, P.R. China
(Received November 4, 2009; Accepted December 2, 2009)
ABSTRACT. The area encompassing Southern China and North Vietnam is highlighted by very high levels of biodiversity but also exceptional threats. Guangxi Province was selected as one of the most representative regions within this area to detect biodiversity hotspots for conservation and to evaluate protection effectiveness of present reserve network using herbarium records. Collection data from 6,506 vascular plant species occurring in the province (548 of these are endemic to the province) were used to explore patterns of biodiversity at 10-minute grid resolution, with the main goal of identifying the occurrence of centers of species richness and endemism. Up to eight distinct hotspots, mainly in mountain areas, were recognized, six based on the combination of species richness and endemism, one on richness only and one on endemics only. Of these, three are specific to limestone areas while the remaining five are located in acid soil regions. Most of centers of species richness and endemism are protected by the current reserve network, although several gaps can be recognized. This research can provide an overview of approaches to setting biodiversity conservation priorities and of strategies for filling up gaps in the reserve network of similar regions.
Keywords: Biodiversity hotspot; Conservation priority; Distribution pattern; Endemism; Species richness; Southern China.
introduction
Globally biodiversity is in the process of rapid decline under the impact of humans and climate change (Pimm et al., 1995; Thomas et al., 2004). How to effectively protect extant species has became a great challenge for conservationists. As it is impossible, in practical terms, to protect all the species of the world, hotspots theory was developed to guide conservation priority planning with the basic goal of protecting as many species as possible with limited funds (Myers, 1988; Myers et al., 2000). Many attempts have been made to identify these areas containing high levels of biodiversity as priority regions for conservation (Medail and Quezel, 1999; Mittermeier et al., 2005; Samways and Grant, 2007), and methods such as species richness, endemism, threatened species,
*Corresponding author: E-mail: hainingqin@ibcas.ac.cn; Tel: +86-010-62836023; Fax: +86-010-62836023.
representative ecosystem, or a combination of these factors have been developed (Davis et al., 1995; Olson and
Dinerstein, 1998; Reid, 1998; Myers et al., 2000). Prior to
designing adequate conservation strategies, comprehensive and high-resolution distribution patterns of biodiversity should be obtained. Data resources such as flora checklists and natural history collections have been increasingly used for this purpose (e.g. Myers et al., 2000; Linder, 2001; Lei et al., 2003; Morawetz and Raedig, 2007) on the Internet (in open databases) because of the great amount of information they can offer (Cotterill, 1997; Crisp et al., 2001; Ponder et al., 2001; Raxworthy et al., 2003; Willis et al., 2003; Graham et al., 2004; Beck and Kitching, 2007; Pearson et al., 2007; Tobler et al., 2007). Identifying biodiversity hotspots on a global scale (Myers et al., 2000; Mittermeier et al., 2005) provides useful directions for conservation practice; however, different hotspots encounter different pressures and experience different processes of biodiversity loss (Brooks et al., 2002). Moreover, the nature and the impact of pressures
378
Botanical Studies, Vol. 51, 2010

may vary greatly among several areas of a given hotspot. For example, in the Mediterranean Basin hotspot, the population and livestock growth represents the main threat to the plant biodiversity on the southern shores whereas the northern part of the basin is affected by the expansion of woodlands (dominated by competitive species) in the inland areas and the habitat fragmentation in costal areas (Medail and Quezel, 1999). Thus, studies at a finer scale of resolution (i.e. defining hotspots within hotspots) are needed in order to design suitable conservation strategies at a more local level.
It is well-known that the tropics harbor a high proportion of global biodiversity (Pimm and Brown, 2004). The area from South China to North Vietnam harbors very high levels of biological diversity, but, at the same time, faces exceptional threats (Sodhi et al., 2004). Whereas the tropical areas of this region are included in one of the 25 global biodiversity hotspots (Indo-Burma; Myers et al., 2000) some of the northern parts (belonging to the southern subtropics) are recognized as world centers of plant diversity (CPDs; Davis et al., 1995). Furthermore, some of the major plant glacial refugia of China are included here (Wang and Liu, 1994; Lopez-Pujol, 2008), and the largest limestone areas in the world, together with their irreplaceable vegetation and flora, are also located in this Asian region (De Laubenfels, 1975; Yuang, 1993; Xu, 1995). However, the inventorying of the biological diversity in this region is largely insufficient. Hundreds of new taxa, including some new genera, have been described from there in recent years, especially from the limestone areas (e.g. Li and Wang, 2004; Tillich, 2005; Tillich et al., 2007; Peng et al., 2008). Meanwhile, neither the biodiversity distribution patterns nor its protection status within the area have been thoroughly evaluated. To address all these issues, the Guangxi Zhuang Autonomous Region (hereafter referred to as Guangxi Province), a region encompassing both tropical and subtropical areas, has been selected as a study case.
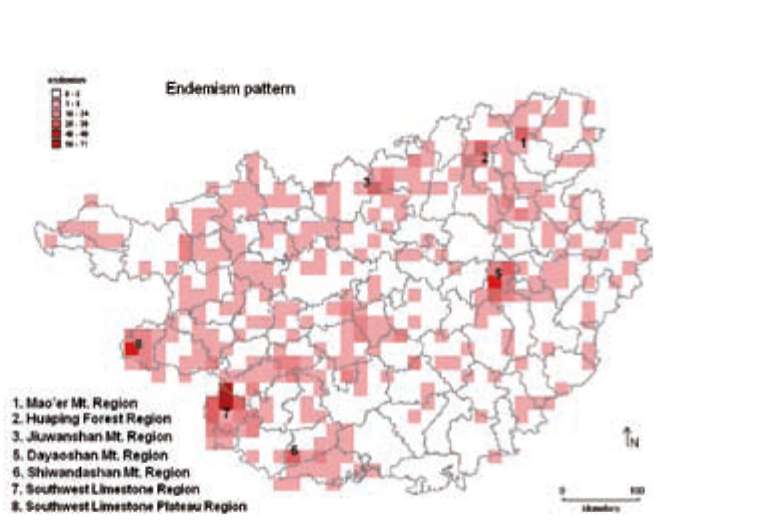
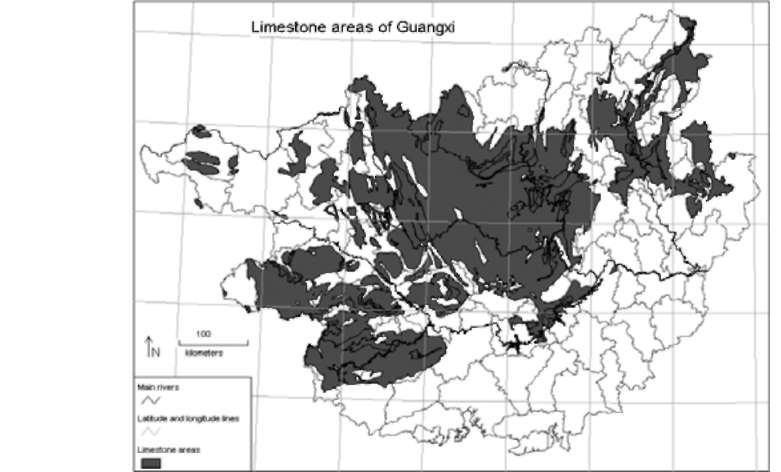
Guangxi Province lies between 20°54' to 26°23' N and 104°28' to 112°04' E in Southern China. It covers an area of ca. 236,000 km2, which is larger than many Mesoamerican and European countries. It stretches from the margin of the Karst Plateau in Southwest China in the west to seashore in the east with elevation decreasing from above 2,000 m to zero, and shares ca. 600km boundary with Vietnam (Figure 1). Limestone areas cover up to 40% areas of the province (Zhou et al., 2004; Figure 5), thus comprising it one of the largest limestone areas of the world when joined with limestone areas of neighboring provinces (mainly Guizhou and Yunnan provinces) and North Vietnam. A diverse flora (over 8,000 vascular plants) and very high levels of endemism (10 genera and 744 species of vascular plants endemic to the area) have been reported (Lu et al., 1989; Xu, 1995; Wu and Chen, 2004). Three regions of Guangxi, namely Nanling Mountain Ranges, Southern Guangxi Province, and the Limestone Region have been listed as world centers of plant diversity
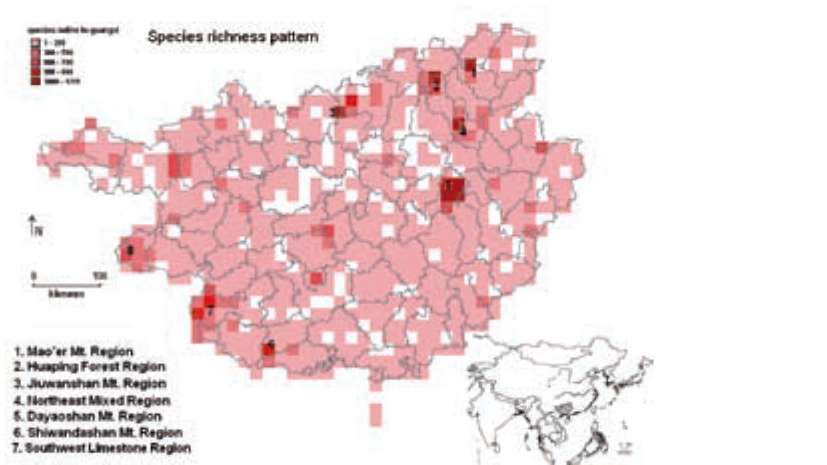
Figure 1. Species richness mapped in 10'x10' grid cells. Numbers in the map correspond to the centers of species richness. The letter 'c' indicates the location of Cenwanglaoshan Mountain.
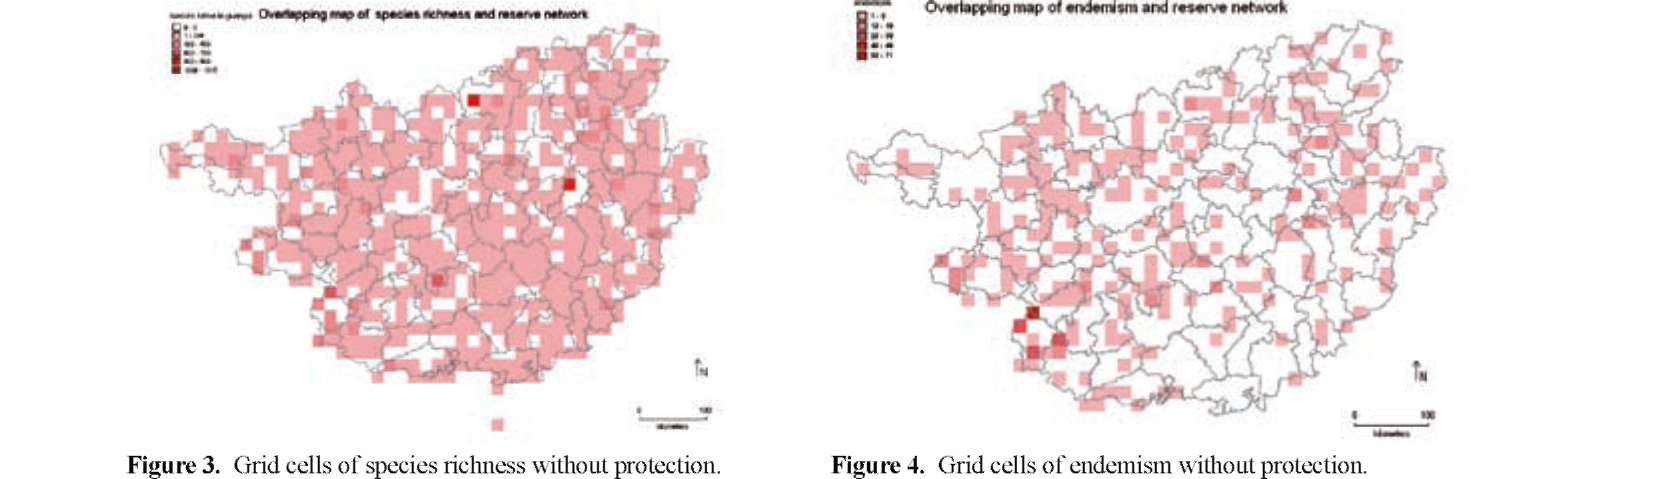
(CPDs) (Davis et al., 1995), and two more, Central Guangxi Mountains and West Guangxi Region have been identified as distribution centers by local botanists (Lu and Liang, 1983; Lu et al., 1989). The limestone region of the southwestern section of the province was recognized as one of the 11 "critical regions for biodiversity conservation in terrestrial China" (SEPA, 1998), and was included in the Indo-Burma world biodiversity hotspot (Myers et al., 2000), which is, in turn, one of the most threatened (Brooks et al., 2002; Sodhi et al., 2004). To protect the rich biodiversity, a nature reserve network including 72 reserves (which represents ca. 6% of the total land area) has been gradually established since 1961 (SEPA, 2007). However, no evaluation on their protecting efficiency has been done.
The main aim of this study is to identify plant diversity hotspots and to check their protection status in Guangxi, a region which represents the large conservation challenges to which the southern subtropical and northern tropical East Asia is currently facing. Herbarium collection records gathered from the region were used to map the distribution patterns of species richness and endemism. In addition, by comparing the obtained maps of plant biodiversity and the distribution of nature reserves, the protection efficiency of present reserve network can be envisaged.
materials and methods
Data collection and treatment
A database was compiled using collection records gathered from Guangxi Province. Thirteen main Chinese herbaria [CDBI, GXMI, HIB, HITBC, HNWP, IBK, IBSC, IFP, KUN, LBG, NAS, PE, WUK (the acronyms follow Fu, 1993)] were checked throughout from the Chinese Virtual Herbarium, a specimen information sharing platform in China (www.cvh.org.cn). The geographical
HOU et al. — Plant distribution and conservation in Guangxi
379
location of the herbarium specimens was verified using maps and gazetteers, and records with vague or incomplete locations were excluded. Species identified new to the region were excluded because it was beyond the scope of this study. The nomenclature followed an updated Guangxi checklist (Qin et al., 2010), and subspecies were merged into species to keep all data at species level.
Biodiversity mapping
We chose a 10-minute latitude/longitude grid size for mapping species richness and endemism. The province was divided into a grid of 801 cells, with each cell covering approximately 300 km2. A larger scale would be too coarse for such an area while a smaller scale may amplify the effect of sampling artifacts, such as the occurrence of artificially empty grid squares and mapping errors (Crisp et al., 2001; Linder, 2001). Although the area of the cells decreases from south to north in Guangxi (which results from the poleward convergence of the meridians) these differences are very small given the limited latitudinal range of this Chinese province (less than 6°). In order to detect the provincial biodiversity hotspots, species richness and endemism were measured by the total count of species and endemic species, respectively, within each grid cell. Because cells overlapping the coast and provincial boundaries have only a small proportion of land, these may appear artificially poorer for any of the two variables than the regular cells. However, this bias seems preferable to omitting these cells from the analysis (cf. Morawetz and Raedig, 2007). The concept of endemism here followed Anderson (1994) referring to species restricted to the region. We used software DIVA-GIS 5.0 to visualize the species' distribution patterns (Hijmans et al., 2005), which has been successfully used for analogous analysis (e.g., Hijmans and Spooner, 2001; Ganeshaiah et al., 2003; Miller and Knouft, 2006; Parthasarathy et al.,2006). The patterns obtained for both parameters were examined to detect aggregates of cells with high amounts of species and endemics (i.e. centers of distribution), as commonly done in biodiversity distribution surveys (Crisp et al., 2001; Linder, 2001; Morawetz and Raedig, 2007).
Evaluating the effectiveness of nature
reserve protection
To know if the identified plant biodiversity hotspots are effectively protected in Guangxi, all extant nature reserves in the province were compiled according to the latest reports (SEPA, 2007) and mapped in grid cells of the same size as those for species (10' x 10'). These were then superimposed onto maps of both species richness and endemism. Grid cells with an occurrence of species which overlapped with those covered by nature reserves turned white. Thus, we can consider species occurring in these cells to be effectively protected. In contrast, the cells still colored after superimposition of maps lack protection, and the darkest cells represent major conservation gaps in the nature reserve network.
results
Centers of species richness
In total, 676 grid cells were sampled, which included 178,875 occurrence records for 6,506 species-level taxa. Around 15% of the grid cells showed a total absence of species while more than 75% scored below 300 species (see Table 1). From the observation of Figure 1, up to seven distinct richness centers were identified in Guangxi, namely Mao'er Mountain Region (number 1 in Figure 1), Huaping Forest Region (2), Jiuwanshan Mountain Region (3), Northeast Limestone Region (4), and Dayaoshan Mountain Region (5), all located in the NE part of the province, and Shiwandashan Mountain Region (6) and Southwestern Limestone Region (7), in the SW corner. The most significant one was Dayaoshan Mountain Region, which harbored three of the seven cells richest in species. The other four cells with more than 1,000 plant taxa were located in the other NE richness centers (Tables 1 and 2). Regarding the nature of the soils, five centers were in acid soil areas (1, 2, 3, 5, and 6), and the remaining two corresponded to limestone areas (4 and 7). Only two of the richest 1.5% cells (those harboring more than 800 species; Table 1) fell into limestone areas.
Endemism concentration
Up to 4,117 occurrence records corresponding to 548 species endemic to Guangxi were distributed among 317 grid cells. Although endemism is mostly concentrated into the same centers as species richness, and both parameters showed some degree of correlation (R2=0.55; p=0.000),
Table 1. Species richness frequency distributions in Guangxi.
Species
0
1-299
300-599 600-799 800-999 1000-1315
Cells
125
610
45 9 5 7
%
15.61
76.15
5.62 1.12 0.62 0.87
Figure 2. Endemism mapped in 10'x10' grid cells. Numbers in the map correspond to the centers of endemism. The letter 'c' indicates the location of Cenwanglaoshan Mountain.
380
Botanical Studies, Vol. 51, 2010

Table 2. Top scoring cells for species richness and endemism in Guangxi Province.
Grid cell and its location
Species richness
Endemics
Species richness order
Endemics order
C Dayaoshan Mountain (5)
1315
44
1
3
NE Dayaoshan Mountain (5)
1141
33
3
8
E Dayaoshan Mountain (5)
1018
10
7
42
W Dayaoshan Mountain (5)
908
18
9
21
S Dayaoshan Mountain (5)
787
35
13
6
Mao'er Mountain (1)
1265
25
2
11
Northeast Limestone Region (4)
1054
18
4
20
Huaping Forest Region (2)
1052
31
5
9
Jiuwanshan Mountain (3)
1044
34
6
7
NE Jiuwanshan Mountain (3)
850
15
11
28
Shiwandashan Mountain (6)
862
27
10
10
SW Southwest Limestone Region (7)
933
25
8
11
Southwest Limestone Region (7)
845
51
12
2
S Southwest Limestone Region (7)
427
39
38
5
N Southwest Limestone Region (7)
662
71
21
1
W Southwest Limestone Region (7)
392
25
43
11
Southwest Limestone Plateau Region (8)
769
40
14
4
Cenwanglaoshan Mountain (C)
741
15
15
28
S Cenwanglaoshan Mountain (C)
675
12
19
35
several differences could be appreciated. The richness center detected in the Northeast Limestone Region was not a significant area for endemism while a cell located in the Southwest Limestone Plateau Region (number 8 in Figure 2) emerged as a center of endemism. Moreover, the order of the top scoring cells was considerably different between species richness and endemism (Table 2): for example, the cell scoring first for species richness is located in Dayaoshan Mountain Region (with 1,315 species), followed by a cell from Mao'er Mountain Region (with 1,265 species); in contrast, the two cells richest in endemics are those in the Southwest Limestone Region (71 and 51 endemics). Since the Southwest Limestone Plateau
Region scored fourth for endemism, it is evident that an exceptional concentration of endemics is in the southwest limestone areas of Guangxi.
Protection effectiveness of the Guangxi reserve network
Most centers of species richness and endemism are covered by the present nature reserves network (Figure 3 and Figure 4). However, four cells with over 600 species (two of which exceed 800 species), and two cells with > 25 endemics (both in the Southwest Limestone Region) are still not protected in Guangxi. The most alarming case corresponds to the cell richest in endemics (with
HOU et al. — Plant distribution and conservation in Guangxi
381
71), which is also rich in species (with 662), located in the Southwest Limestone Region. Moreover, three other cells in the same region have 15-24 endemics. Thus, a significant fraction of the endemic plant species from the limestone areas of SW Guangxi is still not effectively protected. Although the most significant cells in species richness and endemism are covered by reserves, the pair comparisons Figure 1-Figure 3 and Figure 2-Figure 4 show us that this protection is usually restricted to the cores of species richness and endemism centers, thus ignoring the surrounding areas which are also rich in species and endemics.
discussion
Plant biodiversity hotspots in Guangxi
Recognition of centers of species richness and ende-mism is strongly dependent on scale (Crisp et al., 2001). For instance, if the Mediterranean Basin, a global hotspot, is observed in detail, then ten smaller distribution cent­ers or mini-hotspots are revealed (Medail and Quezel, 1999). Moreover, given the fact that conservation and management decisions are made on small geographical scales (countries or even smaller local administrations) and very rarely at a global level, delimitation of biodi­versity hotspots at finer scales is highly recommended. Thus, former attempts to identify the distribution centers of Guangxi, which resulted in the coarse identification of a few poorly-delimited centers (e.g. Lu and Liang, 1983; Wang et al., 1995) have given place to the eight well-defined plant hotspots for conservation presented in this study. Among these, six (number 1, 2, 3, 5, 6 and 7 in Figure 1 and Figure 2) were based both on species rich­ness and endemism, one on richness only (number 4 in Figure 1), and one on endemism only (number 8 in Figure 2). Compared to the former, above-mentioned studies, two new plant distribution centers located in the limestone area of Guangxi, namely the Northeast Limestone Region (no.
4) and Southwest Limestone Plateau Region, have been revealed. These two regions have been largely ignored as centers of species richness or endemism, a mistake which may be attributed to bias caused by experiential methods based on insufficient data (Lu and Liang, 1983; Lu et al.,
1989).
Ideally, hotspots should also represent different ecosystem or floristic regions in addition to harboring as many species as possible, as pointed out by Reid (1998). The eight identified hotspots in Guangxi represent up to three major distinct vegetation groups belonging to three different floristic regions (Takhtajan, 1986; Fang et al., 1995; Wu and Wu, 1996; Su, 1998). The addition to the Cenwanglaoshan Mountain Region (letter 'c' in Figures 1 and 2), itself a moderately rich area in species richness and endemism, enables the conservation of a fourth vegetation type, the southern subtropical sub-humid monsoon broad-leaved evergreen forests (Table 3).
It should be noted that almost all the species richness centers (with the relative exception of the Northeast Limestone Region; see below) and all the endemism centers are located in predominantly mountainous areas. The high levels of both species richness and endemism in mountain ranges can be attributed to their intrinsic topographical and ecological variability (which promotes ecological and allopatric speciation) and/or to the existence of putative glacial refugia (Richardson et al., 2001; Tzedakis et al., 2002; Orme et al., 2005). Mountains have been widely related to refugia because these provided long-term stable habitats through varied topography and local buffering of the extreme Pleistocene climatic conditions, which allowed both the species survival and the emergence of new lineages (Hewitt, 2000; Tzedakis et al., 2002). Furthermore, the large population density in Guangxi (over 200 per km2 in average) has deeply changed the natural vegetation in lowland areas (by far the most populated regions), and the remote mountains have forcibly become the 'refugia of the present day'.
Table 3. Plant biodiversity hotspots, their vegetation types, floristic regions to which they belong, and their soil type.
Hotspot no.
Vegetation typea
Floristic regionb
Soil type
1
Broad-leaved evergreen forest
South China mountain region (D11)
Acid
2
Broad-leaved evergreen forest
South China mountain region (D11)
Acid
3
Broad-leaved evergreen forest
Yunnan, Guizhou & Guangxi limestone mountain & hill region (D12)
Acid
4
Broad-leaved evergreen forest
South China mountain region (D11)
Limestone
5
Southern subtropical monsoon broad-leaved evergreen forest
South China mountain region (D11)
Acid
6
North tropical monsoon rainforest
Tonkin Bay region (G22)
Acid
7
North tropical monsoon rainforest
Tonkin Bay region (G22)
Limestone
8
North tropical monsoon rainforest (in limestone Plateau)
Transition form between D12 and G22
Limestone
C
Southern subtropical subhumid monsoon broad-leaved evergreen forest
Yunnan, Guizhou & Guangxi limestone mountain & hill region (D12)
Mostly acid
aTerminology according to Su (1998).
bTerminology according to Fang et al. (1995) and Wu and Wu (1996).

382
Botanical Studies, Vol. 51, 2010

Richness and endemism, limestone areas vs. acid soil areas
The unique flora of limestone regions has been repeatedly emphasized (Lu et al., 1989; Xu, 1995;
Vermeulen and Whitten, 1999; Clements et al., 2006),
but whether it keeps balance with that growing in acid soil areas or not is yet unresolved. A regional study has reported that flora growing in limestone areas constitute ca. 40% of the total flora in three taxonomic ranks (species, genus and family) in Guangxi (Ou et al., 2004). Our study indicated that acid soil areas have more richness centers (five) than limestone ones (only two), supporting a slight predominance of acid-soil flora in the province. However, considering that limestone areas cover only about 40% of the surface of the province (and that the rest can be roughly classified as acid soils; see Figure 5; Zhou et al., 2004), the plant richness of the two soil typologies would be at approximately the same level were their areas equal. The fact that the species richness of limestone areas is no less than that of acid soil areas has been confirmed by studies both flora (Xu, 1995) and community ecology (Hou and Jiang, 2006).
Compared with species richness, the levels of endemism in the limestone areas of Guangxi are more remarkable, as often reported in other latitudes. For example, the endemics are overrepresented in most families in the limestone flora in the Cape Floristic Region (Willis et al., 1996), and in the Mediterranean Basin limestone outcrops are usually colonized by a very rich endemic flora, a fact attributed in part to the role played by these kind of habitats as refugia during the Quaternary (Thompson, 2005; Lopez-Pujol et al., 2009). This link is also obvious in Guangxi, where ca. 80% of the endemic genera are only distributed in its limestone areas (Lu et al., 1989), and, as revealed here, the most significant endemism centers are those situated in the limestone region of southwestern Guangxi (Table 1 and Figure 2). Based on the data reported by several authors (e.g. Xu, 1995; Li and
Wang, 2004) but also in the findings of the present study, families such as Gesneriaceae, Begoniaceae, Liliaceae, and Rubiaceae comprise a large proportion of endemics in the limestone areas of Guangxi.
Clements et al. (2006) ascribed the high level of richness and endemism in the biological diversity of Southeast Asian karsts (including those of Guangxi) to their high diversity of microhabitats and climatic conditions. The separate peaks, which are the most common topographic features in limestone areas, may act as "islands" in evolutionary processes, and complicated erosion forms in the surface (e. g. fissures and caves) may afford relatively isolated environments for plants, especially small herbs. These conditions might have speeded up speciation processes. Moreover, these same habitat features probably made limestone outcrops to act as suitable refugia for plants during the glacial periods of the Pleistocene, enabling the conservation of many paleoendemic lineages, and thus contributing to the high amounts of endemic taxa presently inhabiting the carbonate substrates in these regions.
Conservation planning
Given the current rates of biodiversity endangerment and extinction, knowing where and how the biodiversity is distributed is urgently needed in conservation plan­ning policies (Morawetz and Raedig, 2007). However, as adequate data on biodiversity distribution are generally lacking, reserve networks are set up based largely on ex­perience. When available data is sufficient, biodiversity can be mapped, and this could be used to evaluate the effi­ciency of current reserve networks and to assist the design of new protected areas (and/or the enlargement of existing ones), with the ultimate objective of producing better plan­ning in a conservation setting (Urmi, 1992; Ferrier, 2002; Muller et al., 2003).
Several studies have found that important hotspots of­ten lie out of protected areas when mapping biodiversity at a fine scale resolution (Araujo, 1999; Burgess et al., 2005; Tang, 2005; Morawetz and Raedig, 2007). In our study, several cells with exceptional concentrations of species and endemics (highlighting the richest cell in endemic plant species of the province) are not included in the pro­tected areas system, and thus urgent measures aimed at preserving this biodiversity should be implemented. Ac­cording to the gap found between distribution patterns of biodiversity and the present reserve network, two areas should receive more attention in conservation planning: the surrounding parts of the different identified hotspots (only the core areas are effectively protected; see Results) and the limestone region of SW Guangxi. The outer part of centers or their neighborhood areas have been largely ignored by conservation planners for a series of reasons, among them fragmentation and isolation, their disconnec­tion from the core areas, or, simply, because their biodi­versity value is underappreciated. However, these areas are comparatively rich in species and endemism, and their
Figure 5. Limestone area of Guangxi (modified from Zhou et al., 2004).
HOU et al. — Plant distribution and conservation in Guangxi
383
preservation is highly desirable to avoid their excessive atomization and isolation from the hotspots' core areas. The preservation of limestone areas also faces great chal­lenges, because the geomorphology of limestone areas is fragmentary, and species are often concentrated in peaks or little hills separated by populated areas; thus, reserve establishment is more difficult in limestone areas than in acid soil regions. As a result, reserves in limestone areas are often fewer, and a strategy of setting a high number of small reserves seems more suitable than fewer but larger reserves.
As a concluding remark, it should be noted that the gathering of enough collection records throughout China's herbaria have enabled us to identify and delimit in detail the areas highlighted for their species richness and en-demism, that is, the biodiversity hotspots. These results provide valuable guidelines for the conservation of plant diversity for the region studied, such as the ranking of the areas to be protected and the identification of the present protection gaps. The approach used here (mapping the bio­diversity at regional, fine-scale level) might help to avoid the rapid endangerment and extinction of plant species in many other east and southeast Asian regions, areas which exhibit a very rich but poorly known biodiversity.
Acknowledgements. We thank the numerous persons who have computerized the collection records used in this paper. We thank Xue Li-Ping, Ye Jian-Fei for their assistance in georeferencing. We thank Qin Xiao-Qun for her assistance on the map of limestone areas in Guangxi. Thanks also to Dr. Yang Yong, Dr. Gao Tian Gang, and Dr. Jin Xiao-Hua for their comments on the manuscript. This work was supported by funds from the National Basic Research Program of China (2006CB403207-2b).
literature cited
Anderson, S. 1994. Area and endemism. Q. Rev. Biol. 69: 451-471.
Araujo, M.B. 1999. Distribution patterns of biodiversity and the design of a representative reserve network in Portugal.
Divers. Distrib. 5: 151-163.
Beck, J. and I.J. Kitching. 2007. Estimating regional species richness of tropical insects from museum data: a comparison of a geography-based and sample-based methods. J. Appl. Ecol. 44: 672-681.
Brooks, T.M., R.A. Mittermeier, C.G. Mittermeier, G.A.B. Da Fonseca, A.B. Rylands, W.R. Konstant, P. Flick, J. Pilgrim, S. Oldfield, G. Magin, and C. Hilton-Tayloor. 2002. Habitat loss and extinction in the hotspots of biodiversity. Conserv.
Biol. 16: 909-923.
Burgess, N., W. Kuper, J. Mutke, J. Brown, S. Westaway. S. Turpie, C. Meshack, J. Taplin, C. McClean, and J.C. Lovett. 2005. Major gaps in the distribution of protected areas for threatened and narrow range Afrotropical plants. Biodivers.
Conserv. 14: 1877-1894.
Clements, R., N.S. Sodhi, M. Schilthuizen, and P.K.L. Ng.
2006. Limestone karsts of southeast Asia: Imperiled arks of biodiversity. Bioscience 56: 733-742.
Cotterill, F.P.D. 1997. The second Alexandrian tragedy, and the fundamental relationship between biological collections and scientific knowledge. In J.R. Nudds and C.W. Pettitt (eds.), The value and valuation of natural science collections. Proceedings of the International Conference, Manchester, 1995. The Geological Society, London, pp. 227-241.
Crisp, M.D., S. Laffan, H.P. Linder, and A. Monro. 2001.
Endemism in the Australian flora. J. Biogeogr. 28: 183-198.
Davis, S.D., V.H. Heywood and A.C. Hamilton. 1995. Centers of Plant Diversity: A guide strategy for their conservation, Vol. 2. Australia Asia and the Pacific. IUCN Publications Unit, Cambridge.
De Laubenfels, D.J. (ed.). 1975. Mapping the World's vegetation. Syracuse University Press, New York.
Fang, R.Z., P.Y. Bai, G.B. Huang and Y.G. Wei. 1995. A floristic study on the seed plants from tropics and subtropics of
Dian-Qian-Gui. Acta Bot. Yunn. Suppl. VII: 111-150.
Ferrier, S. 2002. Mapping spatial pattern in biodiversity for regional conservation planning: Where to from here? Syst.
Biol. 51: 331-363.
Fu, L.G. (ed.). 1993. Index Herbariorum Sinicorum. China Science and Technology Press, Beijing.
Ganeshaiah, K.N., N. Barve, N. Nath, K. Chandrashekara, M. Swamy, and R.U. Shaanker. 2003. Predicting the potential geographical distribution of the sugarcane woolly aphid using GARP and DIVA-GIS. Curr. Sci. 85: 1526-1528.
Graham, C.H., S. Ferrier, F. Huettman, C. Moritz, and A.T. Peterson. 2004. New developments in museum-based informatics and applications in biodiversity analysis. Trends Ecol. Evol. 19: 497-503.
Hewitt, G. 2000. The genetic legacy of the Quaternary ice ages. Nature 405: 907-913.
Hijmans, R.J. and D.M. Spooner. 2001. Geographic distribution of wild potato species. Am. J. Bot. 88: 2101-2112.
Hijmans, R.J., L. Guarino, A. Jarvis, R. O'Brien, P. Mathur, C. Bussink, M. Cruz, I. Barrantes, and E. Rojas. 2005. DIVA-GIS, Version 5.2. A Geographic information system for the analysis of biodiversity data (http://www.diva-gis.org/).
Hou, M.F. and Z.C. Jiang. 2006. Species diversity of Karst original forest in different geochemical environments in Maolan. Ecol. Environ. 15: 572-576.
Lei, F.M., Y.H. Qu, Q.Q. Tang, and S.C. An. 2003. Priorities for the conservation of avian biodiversity in China based on the distribution patterns of endemic bird genera. Biodivers.
Conserv. 12: 2487-2501.
Li, Z.Y. and Y.Z. Wang. 2004. Gesneriaceae of China. Henan Scientific and Technical Publishing House, Zhengzhou.
Linder, H.P. 2001. Plant diversity and endemism in sub-Saharan tropical Africa. J. Biogeogr. 28: 169-182.
Lopez-Pujol, J. 2008. Identification of glacial refugia in China through areas of plant endemism. Post-doctoral Thesis.
384
Botanical Studies, Vol. 51, 2010

Institute of Botany, Chinese Academy of Sciences, Beijing, China.
Lopez-Pujol, J., M. Bosch, J. Simon, and C. Blanche. 2009. Patterns of genetic diversity in the highly threatened vascular flora of the Mediterranean Basin. In A. M. Columbus and L. Kuznetsov (eds.), Endangered Species: New Research. Nova Science Publishers, Hauppauge, NY, USA, pp. 45-79.
Lu, Y.X. and C.F. Liang. 1983. General information and fundamental features of plant geography of Guangxi.
Guihaia 3: 153-165. Lu, Y.X., G.B. Huang, and C.F. Liang. 1989. Study on the
endemic plants from Guangxi. Guihaia 9: 37-58.
Medail, F. and P. Quezel. 1999. Biodiversity hotspots in the Mediterranean basin: Setting global conservation priorities.
Conserv. Biol. 13: 1510-1513.
Miller, A.J. and J.H. Knouft. 2006. GIS-based characterization of the geographic distributions of wild and cultivated populations of the Mesoamerican fruit tree Spondias purpurea (Anacardiaceae). Am. J. Bot. 93: 1757-1767.
Mittermeier, R.A., P.R. Gil, M. Hoffman, J. Pilgrim, T. Brook,
C. G. Mittermeier, J. Lamoreux, and G. A.B. da Fonseca. 2005. Hotspots revisited: Earth's biologically richest and most endangered ecoregions. Conservation International, Washington D.C.
Morawetz, W. and C. Raedig. 2007. Angiosperm biodiversity, endemism and conservation in the Neotropics. Taxon 56:
1245-1254.
Muller, R., C. Nowicki, W. Barthlott, and P.L. Ibisch. 2003.
Biodiversity and endemism mapping as a tool for regional conservation planning - case study of the Pleurothallidinae (Orchidaceae) of the Andean rain forests in Bolivia.
Biodivers. Conserv. 12: 2005-2024.
Myers, N. 1988. Threatened biotas: "Hot spots" in tropical forests. The Environmentalist 8: 187-208.
Myers, N., R.A. Mittermeier, C.G. Mittermeier, G.A.B. da Fonseca, and J. Kent. 2000. Biodiversity hotspots for conservation priorities. Nature 403: 853-858.
Olson, D.M. and E. Dinerstein. 1998. The global 200: A
representation approach to conserving the Earth's most biologically valuable ecoregions. Conserv. Biol. 12: 502­515.
Orme, C.D.L., R.G. Davies, M. Burgess, F. Eigenbrod,
N. Pickup, V.A. Olson, A.J. Webster, T.S. Ding, P.C.
Rasmussen, R.S. Ridgely, A.J. Stattersfield, P.M. Bennett,
T.M. Blackburn, K.J. Gaston, and I.P.E. Owens. 2005.
Global hotspots of species richness are not congruent with endemism or threat. Nature 436: 1016-1019.
Ou, Z.L., Z.M. Su, and X.K. Li. 2004. Flora of Karst vegetation in Guangxi. Guihaia 24: 302-310.
Parthasarathy, U., K.V. Saji, K. Jayarajan, and V.A. Parthasarathy. 2006. Biodiversity of Piper in South lndia-application of GIS and cluster analysis. Curr. Sci. 91: 652­658.
Pearson, R.G., C.J. Raxworthy, M. Nakamura, and A.T. Peterson. 2007. Predicting species distributions from small numbers of occurrence records: a test case using cryptic geckos in Madagascar. J. Biogeogr. 34: 102-117.
Peng, C.I., Y. Liu, and S.M. Ku. 2008. Begonia aurantiflora (Sect. Coelocentrum, Begoniaceae), a new species from limestone areas in Guangxi, China. Bot. Stud. 49: 83-92.
Pimm, S.L. and J.H. Brown. 2004. Domains of biodiversity.
Science 304: 831-833.
Pimm, S.L., G.J. Russell, J.L. Gittleman, and T.M. Brooks. 1995. The future of biodiversity. Science 269: 347-350.
Ponder, W.F., G.A. Carter, P. Flemons, and R.R. Chapman. 2001.
Evaluation of museum collection data for use in biodiversity assessment. Conserv. Biol. 15: 648-657.
Qin, H.N., Y. Liu, S.X. Yu, W.B. Xu, and M.F. Hou. 2010. A
Checklist of Vascular Plants of Guangxi. In H.N. Tan and Y. Liu (eds.), Science Press, Beijing.
Raxworthy, C.J., E. Martinez-Meyer, N. Horning, R.A. Nussbaum, G.E. Schneider, M.A. Ortega-Huerta, and A.T. Peterson. 2003. Predicting distributions of known and unknown reptile species in Madagascar. Nature 426: 837­841.
Reid, W.V. 1998. Biodiversity hotspots. Trends. Ecol. Evol. 13:
275-280.
Richardson, J.E., R.T. Pennington, T.D. Pennington, and P.M. Hollingsworth. 2001. Rapid diversification of a species-rich genus of neotropical rain forest trees. Science 293: 2242­2245.
Samways, M.J. and P.B.C. Grant. 2007. Honing Red List
assessments of lesser-known taxa in biodiversity hotspots. Biodivers. Conserv. 16: 2575-2586.
SEPA (State Environmental Protection Administration). 1998. China's biodiversity: A country study. China Environment Science Press, Beijing.
SEPA (State Environmental Protection Administration). 2007. Report on the state of the environment in China 2006. Available at: http://english.mep.gov.cn/standards_reports/ soe/SOE2006/200711/t20071106_112569.htm
Sodhi, N.S., L.P. Koh, B.W. Brook, and P.K.L. Ng. 2004. Southeast Asian biodiversity: an impending disaster. Trends
Ecol. Evol. 19: 654-660.
Su, Z.M. 1998. The classified system of natural vegetation in
Guangxi. Guihaia 18: 237-246.
Takhtajan, A. 1986. Floristic regions of the World. University of California Press, Berkeley.
Tang, X.P. 2005. Analysis of the current situation of China's nature reserve network and a draft plan for its optimization.
Biodivers. Sci. 13: 81-88.
Thomas, C.D., A. Cameron, R.E. Green, M. Bakkenes, L.J. Beaumont, Y.C. Collingham, B.F. Erasmus, M.F. de Siqueira, A. Grainger, L. Hannah, L. Hughes, B. Huntley, A.S. Van Jaarsveld, G.F. Midgley, L. Miles, M.A. Ortega-Huerta, A.T. Peterson, O.L. Phillips, and S.E. Williams. 2004. Extinction risk from climate change. Nature 427:

HOU et al. — Plant distribution and conservation in Guangxi
385
145-148.
Thompson, J.D. 2005. Plant Evolution in the Mediterranean. Oxford University Press, Oxford.
Tillich, H.J. 2005. A key for Aspidistra (Ruscaceae), including fifteen new species from Vietnam. Feddes Repert. 116: 313­338.
Tillich, H.J., L.V. Averyanov, and N.V. Dzu. 2007. Six new
species of Aspidistra (Ruscaceae) from northern Vietnam.
Blumea 52: 335-344.
Tobler, M., E. Honorio, J. Janovec, and C. Reynel. 2007. Implications of collection patterns of botanical specimens on their usefulness for conservation planning: an example of two neotropical plant families (Moraceae and Myristicaceae) in Peru. Biodivers. Conserv. 16: 659-677.
Tzedakis, P.C., I.T. Lawson, M.R. Frogley, G.M. Hewitt, and
R.C. Preece. 2002. Buffered tree population changes in a quaternary refugium: Evolutionary implications. Science
297: 2044-2047.
Urmi, E. 1992. Floristic mapping as a base for the conservation of Bryophyte species. Biol. Conserv. 59: 185-190.
Vermeulen, J. and Y. Whitten (eds.) 1999. Biodiversity and cultural property in the management of limestone resources - Lesson from East Asia. The International Bank for Conservation, Washington D.C.
Wang, X.P. and Y.K. Liu (eds.). 1994. Theory and practice of biodiversity in China. China Environment Science Press, Beijing.
Wang, X.P., Z.H. Yang, J.S. Hong, I. Kunio, Y.S. Kim, A.C. Hamilton, and S. D. Davis. 1995. Regional overview: China and East Asia. In S.D. Davis, V.H. Heywood and A.C. Hamilton (eds.), Centers of Plant Diversity: a guide and strategy for their conservation. Vol. 2. Asia, Australia and the Pacific. World Wide Fund for Nature and IUCN,
Cambridge, pp. 145-200. Willis, C.K., R M. Cowling, and A.T. Lombard. 1996. Patterns
of endemism in the limestone flora of South African lowland fynbos. Biodivers. Conserv. 5: 55-73.
Willis, F., J. Moat, and A. Paton. 2003. Defining a role for herbarium data in Red List assessments: a case study of Plectranthus from eastern and southern tropical Africa. Biodivers. Conserv 12: 1537-1552.
Wu, Z.Y. and S.G. Wu. 1996. A proposal for a new floristic kingdom (realm) - the E. Asistic kingdom, its delineation and characteristics. In A.L. Zhang and S.K. Wu (eds.), Floristic characteristics and diversity of East Asian plants. China Higher Education Press, Beijing and Springer-Verlag, Berlin, pp. 3-42.
Wu, Z.Y. and X.Q. Chen. 2004. Flora Reipublicae Popularis Sinicae. Science Press, Beijing.
Xu, Z.R. 1995. A study of the vegetation and floristic affinity of the limestone forests in Southern and Southwestern China.
Ann. Missouri Bot. Gard. 82: 570-570.
Yuang, D.X. 1993. The karst of China. Geological Publishing House, Beijing.
Zhou, Y.Y., X.Q. Qin, Z.C. Jiang, and F.C. Wei. 2004. Karst
ecosystem and its environment construction in Southwest China. Guangxi Normal University Press, Guilin (China).
386
Botanical Studies, Vol. 51, 2010

維管束植物的分佈格局與優先保護地:以中國南方廣西省為例
侯滿福1,2,3 Jordi LOPEZ-PUJOL4 覃海寧1 王立松1 劉演5
1中國北京中國科學院植物研究所系統與進化重點實驗室
2中國北京中國科學院研究生院
3中國南寧廣西師範學院資源與環境科學學院
4西班牙巴賽隆納植物研究所
5中國桂林廣西壯族自治區、中國科學院廣西植物研究所
中國西南和越南北部是具有世界意義的生物多樣性關鍵地區,但該區豐富生物同時也面臨著嚴重的
威脅。本文選擇其中的典型代表廣西省,利用標本記錄來確定生物多樣性熱點,並與現有保護區網路比
對以評價其保護狀態。通過構建10'×10'的網格系統把全省分成801個經緯度跨度相等的網格,使用了
包括PE、IBK、GXIU等13家主要標本館170,000多條館藏標本資料'涵蓋了 6,506種分佈于該區的野
生維管植物(其中548種屬該省區特有)進行統計分析。研究共確認了 8個生物多樣性熱點地區,其中
一個基於物種豐富度分佈格局,一個基於特有種分佈格局,其餘六個則同時綜合了二者的分佈格局。8
個生物多樣性熱點中,有三個分佈于石灰岩區,5個分佈于酸性土區。絕大多數確認的生物多樣性熱點
都已被現有保護區網路有效覆蓋,但仍有一些特有種特別豐富的區域沒有得到保護,顯示現有保護區網
路存在的不足。本研究可為類似尺度區域生物多樣性熱點的確認、優先保護順序的評定,以及現有保護
區網路的設置策略等方面提供參考。
關鍵詞:生物多樣性熱點;優先保護;分佈格局;特有種;物種豐富度;中南南部。