Botanical Studies (2010) 51: 511-520.
Reexamination of the pattern of geographical disjunction
of
Chamaecyparis (Cupressaceae) in North America and
East Asia
Pei-Chun LIAO1,2, Tsan-Piao LIN3, and Shih-Ying HWANG1*
1 Department of Life Science, National Taiwan Normal University, 88 Ting-Chow Road, Section 4, Taipei 11677, Taiwan
2Department of Life Science, National Pingtung University of Science and Technology, 1 Shuefu Road, Neipu, Pingtung 912, Taiiwan
3Institute of Plant Biology, National Taiwan University, 1 Roosevelt Road, Section 4, Taipei 10617, Taiwan
(Received November 24, 2008; Accepted March 17, 2010)
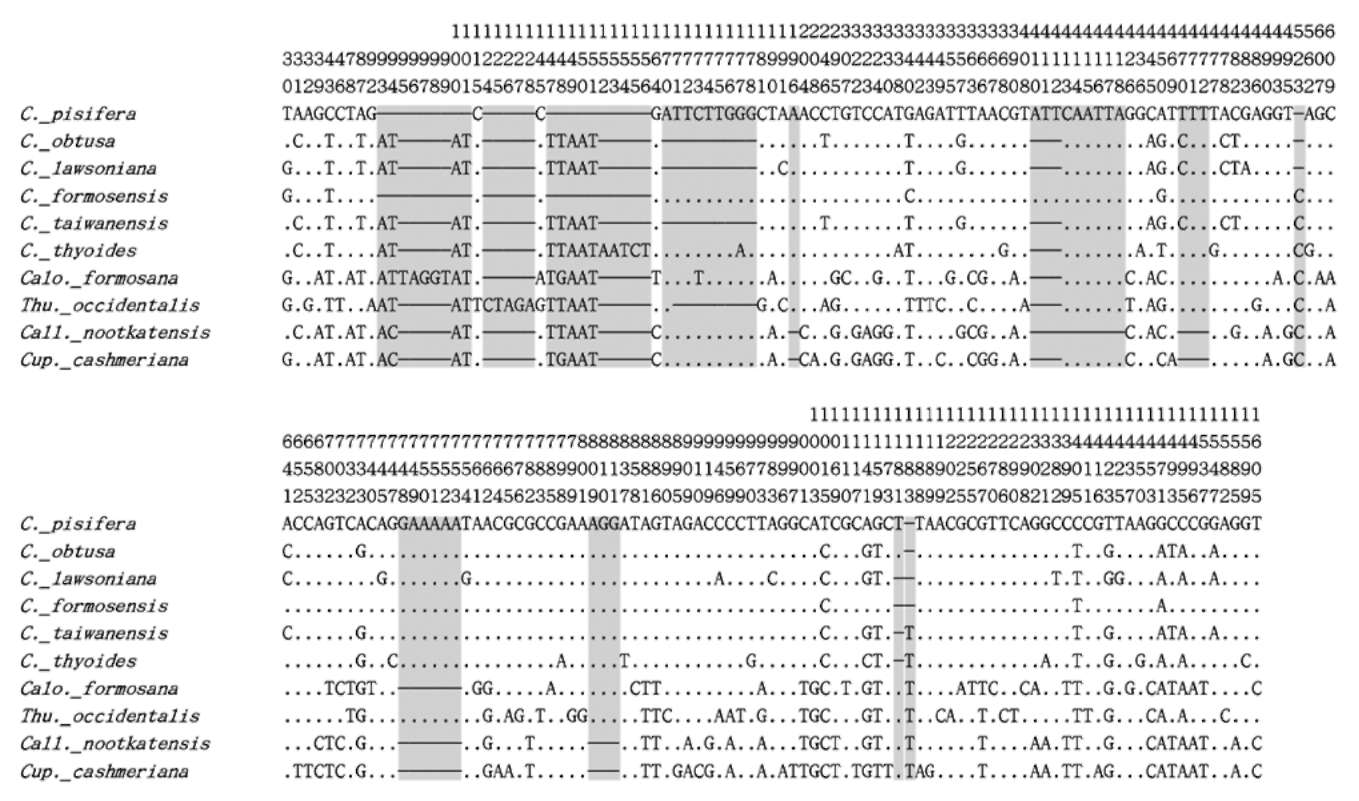
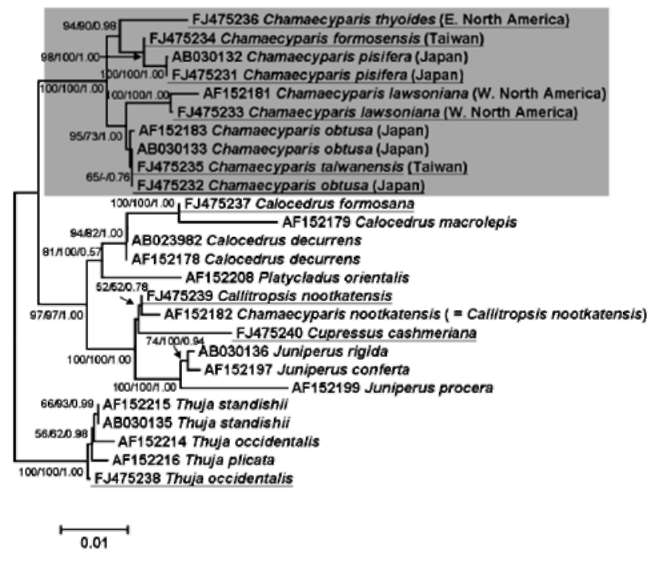
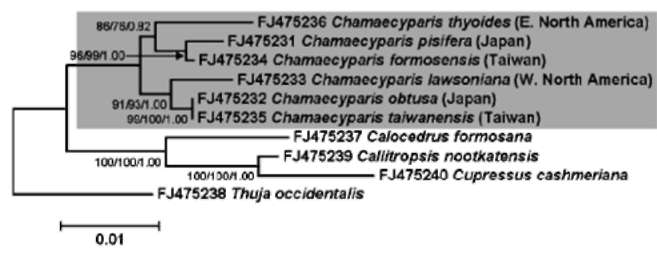
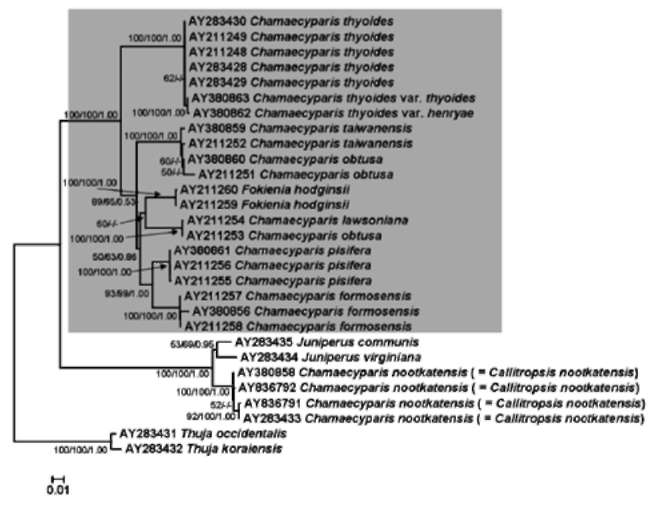
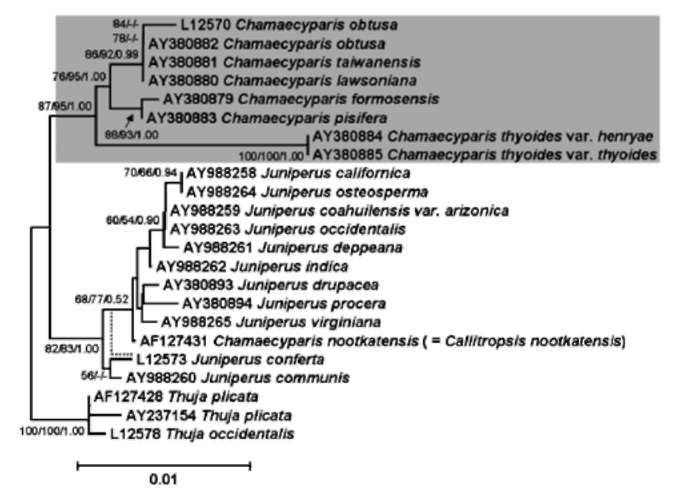
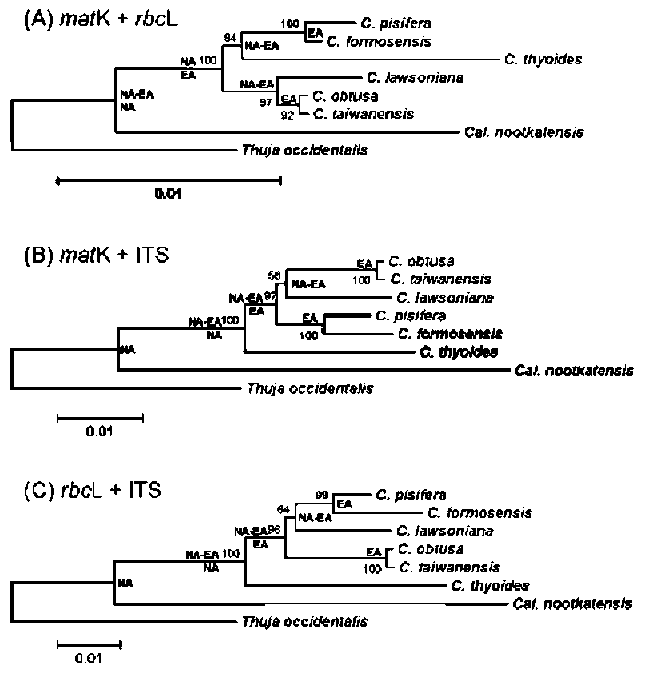
ABSTRACT. The genus Chamaecyparis (Cupressaceae) is comprised of six taxa native to East Asia and North America. Two independent lineages from eastern North America to East Asia and from western North America to East Asia have been identified from phylogenetic analyses based on variation in plastid DNA (ptDNA). However, the trees inferred from a nuclear ribosomal internal transcribed spacer (nrITS), the NEEDLY intron 2, and combined data from genetic and morphological characters of other studies are incongruent with the tree inferred from ptDNA. In this study, we sequenced the plastid matK gene as well as other sequences acquired from GenBank including the matK, rbcL, and nrlTS sequences to reconstruct the phylogenetic trees of Chamaecyparis. The phylogenetic topology inferred from matK was congruent with the previous inference obtained using other ptDNA markers while the rbcL and ITS trees were congruent with previously inferred trees using the combined data and ITS sequences, respectively. Relatively less- (rbcL) and more-informative sites (ITS) may lead to different lineage sorting and incongruent phylogenetic topologies, which were evidenced by rejection of evolutionary homogeneity between ptDNA and ITS sequences in the partition homogeneity test. The phylogenetic tree reconstructed using matK and other ptDNA strongly supports the geographically disjunct distribution of Chamaecyparis in North America and East Asia. A dispersal-vicariance analysis, and geologic and fossil evidence indicated that at least two independent dispersal events occurred from North America to East Asia, which support the previous biogeographic inference by ptDNA. The use of biparental inherited markers for biogeographic inferences should be done with caution.
Keywords: Chamaecyparis; Geographical disjunction; Phylogenetic relationships; matK.
INTRODUCTION
Chamaecyparis is a genus with a fragmented distribution in East Asia and North America. The genus Chamaecyparis is comprised of six taxa: the Japanese endemic species C. obtusa (Siebold & Zucc.) Endl. and C. pisifera (Siebold & Zucc.) Endl., the Taiwanese endemic species C. taiwanensis (C. obtusa Siebold & Zucc. var. formosana (Hayata) Hayata) and C. formosensis Matsum., the eastern North America endemic species C. thyoides (L.) Britten, Stern & Poggenb., and the western North America endemic species C. lawsoniana (A. Murray bis) Pari. Chamaecyparis nootkatensis (D. Don) Spach, formerly classified as a species of Chamaecyparis, was suggested to be removed from Chamaecyparis and

*Corresponding author: E-mail: hsy9347@ntnu.edu.tw; Tel: +886-2-29326234 ext. 221; Fax: +886-2-29312904.
recognized as belonging to the genus Cupressus by Welch (1991) and Frankis (1993), but it is now named Callitropsis nootkatensis (D. Don) Orest. (Little et al., 2004).
Previous phylogenetic inferences based on plastid DNA (ptDNA) segments [i.e. petG-trnP intergenic spacer and trnV intron (Wang et al., 2003) and matK, trnL, and rbcL sequences (Little, 2006)] supported two monophyletic groups of Chamaecyparis consisting of 1) C. lawsoniana, C. obtusa, and C. taiwanensis, and 2) C. thyoides, C. pisifera, and C. formosensis. According to these inferred phylogenetic relationships, there is a biogeographic pattern of two long-distance dispersals from eastern and western North America to East Asia (Japan and Taiwan). These events were proposed to have occurred from the middle to late Miocene (14 and 5.5 million years ago (mya), respectively; (Wang et al., 2003). However, incongruent phylogenetic relationships were inferred using the nuclear
512
Botanical Studies, Vol. 51, 2010
ribosomal internal transcribed spacer (nrITS) (Li et al., 2003), the combined characters of nrITS and ptDNA genes (matK and rbcL), morphological characters (Little et al., 2004), and nuclear genes, i.e. nrlTS and NEEDLY (Little, 2006). Wang et al. (2003) and Li et al. (2003), respectively, inferred different biogeographic patterns according to the ptDNA and nrITS sequences. Differences in speculations about ancestral areas and dispersal or vicariance were mostly due to incongruent phylogenetic inferences resulting from different gene trees. Hence, a reexamination of these gene trees may help in assessing the most appropriate pattern of biogeographic inference.
In the present study, we sequenced the plastid gene, matK, of the six Chamaecyparis species as well as other sequences (matK, trnL, and nrITS) acquired from GenBank. Based on these data, the phylogenetic topology of the genus Chamaecyparis was compared to trees inferred using ptDNA (Wang et al., 2003; Little, 2006), nrITS (Li et al., 2003; Little et al., 2004; Little, 2006), NEEDLY (Little, 2006), and combined datasets of ptDNA, nrITS, and morphological characters (Little et al., 2004). The accuracy of the phylogenetic tree reconstructed using the combined datasets from different genomic sources was also examined and discussed. Our aims were twofold: (1) to examine and reevaluate the phylogenetic inferences of extant Chamaecyparis species by different genes, and (2) to reexamine the biogeographic patterns of the disjunct distribution of Chamaecyparis species.
(IF3: GTCTCATTTTAACATGCATAAA and IR3: TCAATTAGTTTATTGGGGAA). All molecular
techniques were performed as described by Wang et al. (2003), except for the annealing temperature for PCR reactions, which was set to 51C. We used the same primers for sequencing as we used for amplification. PCR products were purified and sequenced in both directions using an ABI BigDye3.1 Terminator Cycle Sequencing Kit by the ABI PRISM®3700 DNA Sequencer (Applied Biosystems, Foster City, CA, USA). Sequences obtained in this study were deposited in GenBank under accession numbers FJ475231~FJ475240.
Sequence analyses and phylogenetic inferences
The obtained plastid matK sequences were aligned using the Clustal_X program (Thompson et al., 1997) with the penalty settings of 2 for gap opening and 30 for gap extension. Indels were treated as missing data in the phylogenetic analysis. The alignment of variable sites of matK sequences in this study is shown in Figure 1. A Neighbor-joining (NJ) analysis, maximum-likelihood (ML) analysis, and Bayesian inference (BI) were used to reconstruct phylogenetic relationships. Model selection by ModelGenerator (Keane et al., 2006), performed by TOPALi vers. 2.5, (Milne et al., 2004) was used to construct the ML and BI trees, based on maximum scores of the Akaike information criterion (AIC). The PhyML algorithm (Guindon et al., 2005) performed using the TOPALi program was used for the ML tree; MrBayes (Huelsenbeck and Ronquist, 2003), implemented in the TOPALi program, was used to construct the BI tree. The PhyML algorithm uses a heuristic search based on the "nearest neighbor interchange" branch swapping operation (Guindon et al., 2005). The amount of support for monophyly was evaluated with 1000 and 100 replicates in the NJ and ML analyses, respectively. Ten million generations of Markov chains were sampled every 100 generations with the first 25% discarded as burn-in for the BI. The model for among-site variation was a gamma-shaped rate variation with a proportion of invariable sites and molecular partitions were allowed to evolve at different rates. Numbers of chains and chain mixing were set as defaults. In order to explore differences with previous phylogenetic inferences from Little et al. (2004), the plastid rbcL, nuclear ribosomal ITS, and other matK sequences in GenBank (http://www.ncbi.nlm.nih.gov/) were downloaded to construct phylogenetic trees using the same strategies described above. The matK sequences obtained from the GenBank have different sequence lengths which resulted in large amounts of missing data. Hence the 5' and 3' terminal regions comprising most of the missing data were eliminated to increase the consistency index of the tree. Detailed models for constructing the trees are listed in Table 1. Combining data to infer the phylogeny can generally improve the phylogenetic accuracy while combining highly incongruent datasets may not (Cunningham, 1997; Barker and Lutzoni, 2002). In order to evaluate the efficacy of
MATERIALS AND METHODS
Plant materials and DNA amplification
Six Chamaecyparis species, including C. obtusa, C. taiwanensis, C. pisifera, C. formosensis, C. thyoides, and C. lawsoniana, and four outgroup species [Cupressus cashmeriana Royle ex Carriere, Calocedrus formosana (Calocedrus macrolepis Kurz var. formosana (Florin) Cheng & L. K. Fu), Thuja occidentalis L., and Call. nootkatensis] were used in this study. Young leaf tissue of C. formosensis and C. taiwanensis were collected from a natural forest at Chilan Mt., Taiwan. Seeds of Callitropsis nootkatensis, C. lawsoniana, C. pisifera, and C. obtusa, obtained from the Seed Bank of the Tree Seed Laboratory, Taiwan Forest Research Institute (TFRI, Taipei, Taiwan), were germinated, and young leaf tissues were collected. Young leaf tissue of Cup. cashmeriana and T. occidentalis were obtained from the TFRI.
    DNA extraction was based on a modified CTAB procedure (Doyle and Doyle, 1987). The DNA concentration was determined for each sample using a GeneQuant II RNA/DNA Calculator (Amersham Pharmacia Biotech Taiwan Branch, Taipei, Taiwan). Double-stranded templates for direct sequencing were amplified by a polymerase chain reaction (PCR). The matK gene was amplified and sequenced using three primer pairs designed by Kusumi et al. (2000) together with another pair of newly designed primers
LIAO et al. ― Geographical disjunction of Chamaecyparis in North America and East Asia                                                         513
Figure 1. Sequence alignment of the matK gene used in this study. Only the variable regions are shown. The shaded areas are fragments of indels.
combining the three gene regions or each pair of genes for constructing a phylogenetic tree, partition homogeneity tests (PHTs) (Farris et al., 1995) were performed using PAUP* 4.0 (Swofford, 2002) for each pair of genes and all three genes simultaneously using 1000 replicates for each test. The PHT was used to evaluate the null hypothesis that characters of two or more datasets reflect a single evolutionary process (Farris et al., 1995; Hipp et al., 2004), and this is useful for distinguishing between the degrees of incongruence between genes (Cunningham, 1997). To perform the PHTs, a gap was treated as a fifth character, and tree-bisection-reconnection (TBR) was used for the branch-swapping algorithm. According to the PHT results, three pairs of sequences (matK + ITS, matK + rbcL, and rbcL + ITS) were separately combined to reconstruct
the NJ tree with Call. nootkatensis and T. occidentalis as outgroups in order to evaluate the most appropriate phylogenetic tree of Chamaecyparis.
Biogeographic analysis of Chamaecyparis was performed with dispersal-vicariance analysis (DIVA) 1.12 (Ronquist, 1997). The ancestral state was retraced by dispersal-event minimization under the assumption of the species distribution as the result of dispersal or vicariance events. Two geographic areas (East Asia and North America) were defined to cover the distribution of Chamaecyparis when reconstructing ancestral areas. Callitropsis nootkatensis was chosen as the outgroup. The phylogenetic relationships used for the DIVA were based on the topology of the NJ tree reconstructed using the matK gene of this study.
Table 1. Models and parameters used for constructing the phylogenetic trees. The models were selected according to the maximum scores of the Akaike information criterion (AIC).

Dataset

Ts/Tva

Alpha shape parametera

Kappa parametera

NJ

ML

BI

matK from this study

0.94

0.12

2.11

F84+G

TVM+G

HKY+G
matK from this study and GenBank (NCBI)"
1.25
1.71
2.84
F84+G
HKY+G
GTR+G
rbcL
1.37
0.11
2.83
F84+G
TIM+I+G
GTR+I+G
Internal transcribed spacer
2.07
0.6
4.28
F84+G
GTR+G
GTR+G

aParameters used for the model (F84+G) for the neighbor-joining (NJ) analysis. ML, maximum likelihood; BI, Bayesian inference; Ts, transition; Tv, transversion.
514
Botanical Studies, Vol. 51, 2010
RESULTS
matK (Figures 2, 3), rbcL (Figure 4), and ITS fragments (Figure 5) all differed. The topology of the matK tree was identical to those constructed by the trnV intron and petG-trnP intergenic spacer (Wang et al., 2003) and the matK, rbcL, and trnL sequences (Little, 2006). In this case, two strongly supported clades of Chamaecyparis indicated two independent evolutionary histories for Chamaecyparis. The two American Chamaecyparis species were at the basal position of the two respective clades. In the ptDNA rbcL and nrDNA ITS trees, C. thyoides was at the basal position of the Chamaecyparis clade, and the other species were separated into two subclades: a subclade containing C. pisifera and C. formosensis and a subclade containing C. lawsoniana, C. obtusa, and C. taiwanensis. The ptDNA evidence from Wang et al. (2003) and this study support the grouping of the North American species C. lawsoniana with the Asian species C. obtusa and C.
Nucleotide diversity
Aligned length of matK sequences obtained in this study and matK, rbcL, and ITS data obtained from the NCBI were 1608, 1178, 1083, and 914 bp, with G/C contents of 32.63%, 31.88%, 42.92%, and 55.25% (Table 2) and total indel numbers of 58, 366 (includes 359 missing data), 43, and 65 (includes 22 missing data), respectively. Among the four datasets, the ITS had relatively higher rates of variable and informative sites, followed by the matK and rbcL genes, which had the lowest (Table 2). The average pairwise distance also revealed low variation in rbcL. Compared to this gene, there was 3-fold more variation in the matK gene and 17-fold more variation in the ITS
(Table 2).
Phylogenetic signals
The null hypothesis of homogeneity of the phylogenetic signals among the three genes was not rejected for the gene pairs matK vs. rbcL (p = 1.000), matK vs. the ITS (p = 0.143), and rbcL vs. the ITS (p = 0.334), but was rejected when combining matK+rbcL vs. the ITS (p = 0.034). Based on the PHT, combining plastid and nuclear markers to infer the phylogeny of Chamaecyparis is inappropriate.
      The phylogenetic relationships deduced from the
Figure 3. Phylogenetic tree reconstructed with matK sequences obtained from the NCBI. The clade of Chamaecyparis is marked with gray. Species that are underlined are sequences obtained in this study. Numbers besides the branches respectively indicate the bootstrap support for the neighbor-joining and maximum-likelihood (ML) analyses and likelihood ratio for the Bayesian inference (BI). Likelihood scores for the ML and BI trees were -2935.89 and -2949.02, respectively.
Figure 2. Phylogenetic tree reconstructed with matK sequences obtained in this study. The clade of Chamaecyparis is marked with gray. Numbers besides the branches respectively indicate the bootstrap support for the Neighbor-joining and maximum-likelihood (ML) analyses and likelihood ratio for the Bayesian inference (BI). Likelihood scores for the ML and BI trees were -3202.86 and -3469.71, respectively.
Table 2. Sequence variation of plastid genes (matK and rbcL) and the nuclear ribosomal internal transcribed spacer (ITS) fragment of the examined species. The maximum composite likelihood model with heterogeneous lineages and uniform rates among sites was used to calculate the average pairwise distance by MEGA 4.0 (Tamura et al., 2007).

Dataset

No. of

Length

G/C

No. of phylogenetically

No. of

No. of

Average pairwise
sequences
(bp)
content
informative sites
variable sites
singletons
distance

matK from this study

11

1608

32.63%

68 (4.22%)

170 (10.57%)

102 (6.34%)

0.0354
matK from this study and
GenBank (NCBI)
27
1178
31.88%
88 (7.47%)
171 (14.52%)
83 (7.05%)
0.0325
rbcL
23
1083
42.92%
32 (2.95%)
40 (3.69%)
8 (0.74%)
0.0104
ITS
29
914
55.25%
143 (15.65%)
181 (19.80%)
38 (4.16%)
0.1812


LIAO et al. ― Geographical disjunction of Chamaecyparis in North America and East Asia
515
taiwanensis. In addition, C. lawsoniana, C. obtusa, and C. taiwanensis were not well resolved because of the low bootstrap values in the rbcL and ITS trees (Figures 4, 5). Furthermore, Fokienia hodginsii, the phylogenetic placement of which was analyzed only with ITS data, was located within the Chamaecyparis clade, and formed a sister group to C. lawsoniana and C. obtusa in the NJ algorithm or was unresolved with C. lawsoniana, C. obtusa, C. pisifera, and C. formosensis in both the ML and Bayesian algorithms of the ITS tree. The placement of Fokienia within the genus Chamaecyparis is consistent with Little's (2006) inferences but slightly differed in grouping with C. formosensis and C. lawsoniana in the ITS tree or grouping with C. formosensis and C. pisifera in the tree using the NEEDLY intron 2 (Little, 2006). Phylogenetic relationships constructed using rbcL were mostly congruent with the inferences of the combined data by Little et al. (2004) that C. thyoides is at the most-basal position. The ITS tree here had a topology congruent with that inferred by the ITS of Little et al. (2004), but it differed from those of Li et al. (2003) and Little (2006).
When combining sequences of matK, rbcL, and ITS according to the PHT results, the combination of two ptDNA fragments (matK + rbcL) had a topology of a phylogenetic tree congruent with the matK tree (named the matK type, Figure 6A); the topology of the phylogenetic tree of matK + ITS was congruent with the rbcL tree (named the rbcL type, Figure 6B); the third combination (rbcL + ITS) had the hierarchical phylogenetic relationships of C. pisifera and C. formosensis being grouped with C. lawsoniana, with these three species being sister to the group of C. obtusa, C taiwanensis,
Figure 5. Phylogenetic tree reconstructed with internal transcribed spacer (ITS) sequences obtained from the NCBI. The clade of Chamaecyparis is marked with gray. Numbers beside the branches respectively indicate the bootstrap support for the neighbor-joining (NJ) and maximum-likelihood (ML) analyses and the likelihood ratio for the Bayesian inference (BI). Likelihood scores for the ML and BI trees were -3869.35 and -3902.37, respectively.
and C. thyoides, which was located at the basal position of Chamaecyparis, and which had a topology similar to that of the ITS tree (named the ITS type, Figure 6C). Although combinations of these fragments of sequences were not rejected by the PHT, the incongruent topologies of the tree indicated that one or more data partitions rendered an incorrect phylogeny (Cunningham, 1997). The incongruence of the gene trees using either a single gene or combined sequences also revealed a complex evolutionary history for Chamaecyparis.
Biogeographic pattern of Chamaecyparis
Analysis by the DIVA program suggested that Chamaecyparis was distributed by processes conforming to both vicariance and dispersal events from North America to East Asia in three types of phylogenetic inferences. Two probable biogeographic patterns were inferred according to the three types of phylogenetic trees. First, two independent dispersal events were inferred from the matK-type tree, similar to what was inferred by Wang et al. (2003), but the ancestral areas could not be determined. Second, both the rbcL-type and ITS-type phylogenetic trees had congruent biogeographic inferences because the lineages (C. lawsoniana and C. thyoides), which were located at different phylogenetic positions, were distributed in the same geographic area (North America). Vicariance probably occurred at the beginning of the divergence of Chamaecyparis species that separated the eastern North American C. thyoides, following the second vicariance event, which separated the East Asian lineage (C. obtusa-C. taiwanensis in the ITS-type inference or C. pisifera-C. formosensis in the rbcL-
Figure 4. Phylogenetic tree reconstructed with rbcL sequences obtained from the NCBI. The clade of Chamaecyparis is marked with gray. The dashed line indicates the alternative grouping by the Bayesian inference (BI), and the italicized number is the likelihood ratio for the alternative grouping. Numbers besides the branches respectively indicate the bootstrap support for the neighbor-joining (NJ) and maximum-likelihood (ML) analyses and likelihood ratio for the Bayesian analysis. Likelihood scores for the ML and BI trees were -1845.56 and -1906.04, respectively.
516
Botanical Studies, Vol. 51, 2010
this previous inference. However, Li et al.'s (2003) ITS tree, Little et al.'s (2004) phylogenetic inference according to the combination of the ITS (nrDNA), matK, rbcL, and morphological characters, and Little's (2006) ITS and NEEDLY trees are not consistent with the tree inferred from ptDNA markers (Wang et al., 2003; Little, 2006; and this study). Such incongruence in gene trees indicates that the evolution and geographic history of Chamaecyparis has been complex. Hence, we reexamined the phylogenetic relationships respectively reconstructed by the three genetic markers (matK, rbcL, and ITS) and the combined datasets.
Compared to phylogenies inferred only from ptDNA sequences (Wang et al., 2003; Little, 2006; and this study), the incongruent placement of Chamaecyparis species inferred from the nrITS and other nuclear genes indicates that different sources of characters for constructing phylogenetic trees may result in different phylogenetic inferences. PtDNA showed a consistent phylogeny except for the tree reconstructed using rbcL, which indicated that ptDNA may have experienced the same or a similar evolutionary history. In contrast to the consistency of ptDNA, the nuclear DNA (including the nrITS) showed incongruent phylogenetic topologies, which may indicate that nuclear genes experienced different evolutionary forces, e.g., selection, recombination, and/or introgression. Hence, combining data from different sources can lead to incongruent groupings and may confuse the true relationships because each marker might not reflect the same evolutionary patterns (Neves et al., 2005; Peng and Wang, 2008). This was evidenced by the relatively smaller support values (bootstrap values for the NJ and ML analyses and posterior probability for the BI) of the combined-data tree inferred by Little et al. (2004) and the unresolved relationships of the combined-data tree inferred by Little (2006) compared to the single-gene tree (Figures 2-5) and by the rejection of the homogeneity of matK + rbcL sequences against nrITS sequences (p = 0.034 in the PHT). Trees reconstructed using matK + rbcL are mostly consistent with the inferences of Wang et al. (2003). Despite the tree reconstructed by rbcL differing from those of other ptDNA fragments, the ptDNA phylogeny of Chamaecyparis in this study displayed a general topological pattern similar to that reported by Wang et al. (2003). However, the rbcL gene was recently reported to be under positive selection in some plant species, and this could have caused the phylogenetic topology to lack support in some clades (Christin et al., 2008). A different lineage-sorting rate is also commonly used to explain incongruent phylogenetic relationships constructed using different genetic markers (Degnan and Rosenberg, 2009). Despite rbcL and matK both being located on the plastid genome, different phylogenetic inferences may indicate different rates of lineage sorting for the two fragments. The fewer informative sites of rbcL genes (Table 2) could lead to inappropriate resolution of phylogenetic relationships due to incomplete lineage sorting.
Figure 6. Neighbor-joining (NJ) tree reconstructed by the combined sequences: (A) matK + rbcL (= matK-type tree); (B) matK + internal transcribed spacer (ITS) (= rbcL-type tree); and (C) rbcL + ITS (=ITS-type tree). Numbers besides the branches are bootstrap values. The results of the dispersal-vicariance analysis (DIVA) are indicated at the nodes. EA, East Asia; NA, North America.
type tree), and the last vicariant event, which separated C. lawsoniana from the remnant East Asian species. Li et al. (2003) inferred two biogeographic patterns according to the ITS tree: (1) Chamaecyparis is distributed in North America and East Asia, and a vicariance event separated C. formosensis and C. pisifera from other species, following a dispersal event from North America to East Asia; and (2) two independent dispersal events from the ancestral area of East Asia to North America.
DISCUSSION
Phylogenetic inferences
Although phylogenetic relationships among species of the genus Chamaecyparis were previously resolved based on ptDNA (Wang et al., 2003; Little, 2006), different inferences of phylogenetic relationships were addressed according to various nuclear markers used (Li et al., 2003; Little et al., 2004; Little, 2006). According to Wang et al.'s (2003) and Little's (2006) inference using ptDNA, Chamaecyparis can be separated into two phylogroups: a clade containing C. lawsoniana, C. obtusa, and C. taiwanensis and a clade containing C. thyoides, C. pisifera, and C. formosensis. In these two phylogroups, both North American species (C. lawsoniana and C. thyoides) are respectively located at the basal positions of each lineage (Wang et al., 2003). Here, the phylogenetic relationships reconstructed with the plastid matK support
LIAO et al. ― Geographical disjunction of Chamaecyparis in North America and East Asia
517
In contrast to ptDNA, the phylogenetic tree of the nrITS sequence had a slightly different topology in the position of C. lawsoniana and C. thyoides which differed from that of the ptDNA tree. We cannot completely reject the inferences of the ITS tree; however, the ITS fragment seems to have experienced rapid evolution and possessed more homoplasies, which could potentially lead to incorrect inferences of phylogenetic relationships (Buckler et al., 1997; Alvarez and Wendel, 2003). Heterologous characters from paralogous sequences usually result in the phenomenon of high homoplasy (Buckler et al., 1997). Multiple copies of ITSs in the nuclear genome (Mayer
and Soltis, 1999; Manen, 2004; Church and Taylor, 2005; Denduangboripant et al., 2007; Kan et al., 2007) can be a serious problem during phylogenetic construction. These interferences could be the reason for the incongruence of the ITS trees inferred by Li et al. (2003), Little (2006), Little et al. (2004), and this study. Moreover, phylogenetic trees inferred from nuclear markers greatly differed from each other in contrast to the consistency observed for ptDNA. This may have been due to the influence of recombination and gene introgression from the closely related species of biparentally inherited genes. The incongruence of nrDNA and ptDNA phylogenetic relationships may be evidence of introgression (Van Raamsdonk et al., 1997; Kyndt et al., 2005) or hybridization (Soltis and Kuzoff, 1995; Ackerfield and Wen, 2003; Nishimoto et al., 2003; Peng and Wang, 2008). Hybridization among C. pisifera, C. obtusa, C. thyodes, and C. lawsoniana was reported (Chiaki, 1981). Moreover, artificial hybridization of C. pisifera and C. obtusa is common in Japan (Maruyama et al., 2005).
Although the PHT did not reject the combination of the matK, rbcL, and ITS datasets, the incongruent topologies indicate that the trees were influenced by the independent evolution of the respective markers, i.e., different evolutionary processes (Hipp et al., 2004). The PHT is a test to detect the congruence of datasets but cannot judge the accuracy of a phylogeny: if one part of the partitions is upweighted, the homoplasy will be swamped, and the significance of this test will be reduced (Hipp et al., 2004). Hence, the combination of different genetic markers which have highly variable and more-informative sites, e.g., the ITS sequences, in this case, would influence the phylogenetic inference. This could be why the three types of trees reconstructed by the combined datasets differ in topology (Figure 6). In general, three types of phylogenetic trees were assessed in this study: the matK type (Figures 2, 3, 6A), rbcL type (Figures 4, 6B), and ITS type (Figure 5, 6C). Although none of these three hypothetical phylogenies can be completely excluded, the low number of informative sites of rbcL and the biparental inheritance and multiple copies of the nrITS render those trees less reliable. In contrast, the matK type was most consistent with other ptDNA inferences (Wang et al., 2003; Little, 2006) and most probably reflects the biogeographic pattern.
Biogeographic inferences
The DIVA does not consider anything about the shape or existence of general biogeographic patterns and only depends on the parsimony algorithm (Ronquist, 1997). Therefore inferences by DIVA should be part of the evidence but still needs other fossil or geologic evidence. According to the matK-type trees, at least two independent dispersal events with undetermined ancestral areas were inferred. The biogeographic inference proposed by Li et al. (2003) was that Chamaecyparis underwent two independent migrations from East Asia to North America, and this differs from what Wang et al. (2003) proposed. Li et al.'s (2003) hypothesis was based on the phylogeny constructed using ITS sequences, in which C. pisifera and C. formosensis were at the basal position rooted by the Asian species Fokienia hodginsii. Hence, the most parsimonious inference, which is the basic assumption of the DIVA (Ronquist, 1997), would place the ancestral area in East Asia. Although two independent migrations were both inferred by Li et al.'s (2003) ITS tree and the matK-type tree of this study, they have different biogeographic meanings: North America was sequentially colonized in Li et al.'s (2003) hypothesis while C. lawsoniana-C. obtusa-C. taiwanensis and C. thyoides-C. pisifera-C. formosensis are two independent evolutionary lineages and independently migrated between the two continents.
Although we cannot completely reject the hypothesis of vicariance inferred by the rbcL-type or ITS-type trees, this biogeographic inference is less supported because these two types of trees might not truly reflect biogeographic patterns (see discussion above). In addition, we assumed that Chamaecyparis should be widespread in the continents of Eurasia and North America before they separated if the vicariance hypothesis was correct, and therefore, there should be some fossil records in Europe or Central Asia. Despite the discovery of large amounts of fossils of Cupressaceae in Europe, fossils of Chamaecyparis seem to be absent (Ferguson, 1967). No fossils of Chamaecyparis have been discovered in Europe or Central Asia.
If the vicariance hypothesis is excluded, the direction of dispersal will be of concern. Under the matK-type tree, directions of the dispersal cannot be determined. Based on the ptDNA phylogenetic inference and numerous references of geologic and fossil evidence, Wang et al. (2003) suggested the long-distance dispersal mode between North America and East Asia occurred across the Bering land bridge. The biogeographic inference of the Chamaecyparis phylogeny consists of the hypothesis of two independent "out of North America" scenarios (Wang et al., 2003). According to Wang et al. (2003),
these two long-distance dispersal events occurred across the North Pacific via the ancient Bering land bridge approximately 14 (for C. thyoids and C. pisifera) and 5.5 Mya (for C. lawsoniana and C. obtusa). The fossil record supports Chamaecyparis having existed in western North America (Vancouver Island, British Columbia) in the
518
Botanical Studies, Vol. 51, 2010
Upper Cretaceous (Mclver, 1994) and in the Canadian High Arctic (Axel Heiberg Island, Baffin, Baffin Region, Kotyk et al., 2003). In contrast to earlier fossil records in North America, late Pliocene fossil records in central Japan of East Asia (Yamakawa et al., 2008) indicated that Asian Chamaecyparis species may have colonized later. Times to the divergent events of the Asian Chamaecyparis species (2.9 Mya between C. pisifera and C. formosensis and 1.3 Mya between C. obtusa and C. taiwanensis) were estimated by Wang et al. (2003). Wang et al. (2003) suggested migration through the Bering Bridge occurred during the time frame from the middle to late Miocene, which falls in the range of the divergence times of most Asian and North American disjunct taxa as reported by Xiang et al. (2000). Although the rbcL-type and ITS-type trees may be inappropriate to infer the biogeographic pattern by DIVA due to the selection, less-informative sites, recombination, or biparental inheritance, the phylogenies indicated that C. thyoides of North America is the most ancient extant species. The coniferous biogeographic inference of long-distance dispersal by the carriage of ptDNA was also reported in the gymnosperm genera Picea (Ran et al., 2006), Cedrus (Qiao et al., 2007), and Thuja (Peng and Wang, 2008).
that a migration from North America to East Asia is the most likely direction.
Acknowledgements. Financial support provided by the Council of Agriculture, Executive Yuan, TAIWAN to SY Hwang is gratefully acknowledged. Thanks also go to the TFRI for providing plant materials.
LITERATURTE CITED
Ackerfield, J. and J. Wen. 2003. Evolution of Hedera (the ivy genus, Araliaceae): insights from chloroplast DNA data. Int.
J. Plant Sci. 164: 593-602.
Alvarez, I. and J.F. Wendel. 2003. Ribosomal ITS sequences and plant phylogenetic inference. Mol. Phylogenet. Evol. 29:
417-434.
Barker, F.K. and F.M. Lutzoni. 2002. The utility of the incon-gruence length difference test. Syst. Biol. 51: 625-637.
Besnard, G., R.R. de Casas, and P. Vargas. 2007. Plastid and nuclear DNA polymorphism reveals historical processes of isolation and reticulation in the olive tree complex (plea europaea). J. Biogeogr. 34: 736-752.
Buckler, IV, E.S., A. Ippolito, and T.P. Holtsford. 1997. The
evolution of ribosomal DNA: divergent paralogues and phylogenetic implications. Genetics 145: 821-832.
Chiaki, Y. 1981. Possibilities of interspecific hybridization between Chamaecyparis lawsoniana and some other Chamaecyparis species. J. Jap. For. Soc. 63: 311-319.
Christin, P.A., N. Salamin, A.M. Muasya, F. Russier, E.H. Roal-son, and G. Besnard. 2008. Evolutionary switch and genetic convergence on rbcL following the evolution of C4 photo­synthesis. Mol. Biol. Evol. 25: 2361-2368.
Church, S.A. and D.R. Taylor. 2005. Speciation and hybridiza­tion among Houstonia (Rubiaceae) species: the influence of polyploidy on reticulate evolution. Am. J. Bot. 92:
1372-1380.
Cronn, R.C., R.L. Small, T. Haselkorn, and J.F. Wendel. 2002.
Rapid diversification of the cotton genus (Gossypium: Mal­vaceae) revealed by analysis of sixteen nuclear and chloro-plast genes. Am. J. Bot. 89: 707-725.
Cunningham, C.W. 1997. Can three incongruence tests predict when data should be combined? Mol. Biol. Evol. 14: 733­740.
Degnan, J.H. and N.A. Rosenberg. 2009. Gene tree discordance, phylogenetic inference and the multispecies coalescent.
Trends Ecol. Evol. 24: 332-340.
Denduangboripant, J., Q.C.B. Cronk, G. Kokubugata, and M. Moller. 2007. Variation and inheritance of nuclear ribosom-al DNA clusters in Streptocarpus (Gesneriaceae) and their biological and phylogenetic implications. Int. J. Plant Sci.
168: 455-467.
Doyle, J.J. and J.L. Doyle. 1987. A rapid DNA isolation proce­dure for small quantities of fresh leaf tissue. Phytochem.
Bull. 19: 11-15.
CONCLUSIONS
The incongruence of phylogenetic relationships inferred from different genetic markers has been frequently reported (Cronn et al., 2002; Nishimoto et al., 2003; Neves et al., 2005; Ji et al., 2006; Besnard et al., 2007; Havill et al., 2008; Peng and Wang, 2008). Such patterns were commonly explained as resulting from hybridization or introgression due to characteristics of respective bi- and uni-parental inheritance by nuclear and plastid genomes. Other explanations like incomplete ancestral lineage sorting (Degnan and Rosenberg, 2009) or some technical problems linked to the use of different ribosomal DNA paralogs have also been invoked. In Chamaecyparis, a conflict between plastid- and nuclear-genome evolution was found, which indicates that inappropriately combining different genetic markers in a single analysis can cause problems in inferring phylogenetic relationships. In this paper, we addressed three possible phylogenetic relationships according to three respective sequences as well as different combinations of datasets, and also compared them with previous phylogenetic hypotheses (Wang et al., 2003; Li et al., 2003; Little et al., 2004; Little, 2006). Although we cannot exactly determine the accurate species tree from the separated gene trees, the congruency of the different markers in the ptDNA trees indicated that ptDNA may have experienced less interference and may be better for drawing biogeographic inferences. Although species extinctions may have caused difficulty in determining ancestral areas from extant species, the phylogeny inferred by ptDNA reveals at least two independent migrations between North America and East Asia, and fossil and geographic evidence indicates
LIAO et al. ― Geographical disjunction of Chamaecyparis in North America and East Asia
519
Farris, J.S., M. Kallersjo, A.G. Kluge, and C. Bult. 1995. Testing significance of incongruence. Cladistics 10: 315-319.
Ferguson, D.K. 1967. On the phytogeography of Coniferales in the European Cenozoic. Palaeogeogr. Palaeoclimatol. Pal-aeoecol. 3: 73-110.
Frankis, M.P. 1993. Nootka cypress: Chamaecyparis or Cupres­sus? Conif. Soc. Aust. Newslett. 12: 9-10.
Guindon, S., F. Lethiec, P. Duroux, and O. Gascuel. 2005. PHYML Online-- a web server for fast maximum likeli­hood-based phylogenetic inference. Nucleic Acids Res. 33:
W557-W559.
Havill, N.P., C.S. Campbell, T.F. Vining, B. LePage, R.J. Bayer,
and M.J. Donoghue. 2008. Phylogeny and biogeography of Tsuga (Pinaceae) inferred from nuclear ribosomal ITS and chloroplast DNA sequence data. Syst. Bot. 33: 478-489.
Hipp, A.L., J.C. Hall, and K.J. Sytsma. 2004. Congruence versus phylogenetic accuracy: revisiting the incongruence length
difference test. Syst. Biol. 53: 81-89.
Huelsenbeck, J.P. and F. Ronquist. 2003. MrBayes3: Bayesian phylogenetic inference under mixed models. Bioinformatics
19: 1572-1574.
Ji, Y.H., P.W. Fritsch, H. Li, T.J. Xiao, and Z.K. Zhou. 2006. Phylogeny and classification of Paris (Melanthiaceae) in­ferred from DNA sequence data. Ann. Bot. 98: 245-256.
Kan, X.Z., S.S. Wang, X. Ding, and X.Q. Wang. 2007. Structur­al evolution of nrDNA ITS in Pinaceae and its phylogenetic implications. Mol. Phylogenet. Evol. 44: 765-777.
Keane, T.M., C.J. Creevey, M.M. Pentony, T.J. Naughton, and J.O. Mclnerney. 2006. Assessment of methods for amino acid matrix selection and their use on empirical data shows that ad hoc assumptions for choice of matrix are not justi­fied. BMC Evol. Biol. 6: 29.
Kotyk, M.E.A., J.F. Basinger, and E.E. McIver. 2003. Early
tertiary Chamaecyparis Spach from Axel Heiberg Island,
Canadian High Arctic. Can. J. Bot. 81: 113-130.
Kusumi, J., T. Tsumura, H. Yoshimaru, and H. Tachida. 2000. Phylogenetic relationships in Taxodiaceae and Cupres-saceae sensu stricto based on matK gene, chlL gene, trnL-trnF IGS region, and trnL intron sequences. Am. J. Bot. 87:
1480-1488.
Kyndt, T., B. Van Droogenbroeck, E. Romeijn-Peeters, J.P. Romero-Motochi, X. Scheldeman, P. Goetghebeur, P. Van Damme, and G. Gheysen. 2005. Molecular phylogeny and evolution of Caricaceae based on rDNA internal transcribed spacers and chloroplast sequence data. Mol. Phylogenet.
Evol. 37: 442-459.
Li, J., D. Zhang, and M.J. Donoghue. 2003. Phylogeny and biogeography of Chamaecyparis (Cupressaceae) inferred from DNA sequences of the nuclear ribosomal ITS region.
Rhodora 105: 106-117.
Little, D.P. 2006. Evolution and circumscription of the true cy­presses (Cupressaceae: Cupressus). Syst. Bot. 31: 461-480.
Little, D.P., A.E. Schwarzbach, R.P. Adams, and C.F. Hsieh.
2004. The circumscription and phylogenetic relationships of
Callitropsis and the newly described genus Xanthocyparis
(Cupressaceae). Am. J. Bot. 91: 1872-1881.
Manen, J.F. 2004. Are both sympatric species Ilex perado and Ilex canariensis secretly hybridizing? Indication from nu­clear markers collected in Tenerife. BMC Evol. Biol. 4: 46.
Maruyama, T.E., Y. Hosoi, and K. Ishii. 2005. Sawara cypress Chamaecyparis pisifera Sieb. et Zucc. In S.M. Jain and P.K. Gupta (eds.), Protocol for Somatic Embryogenesis in Woody Plants, Vol. 77. Springer, the Netherlands, pp.
459-468.
Mayer, M.S. and P.S. Soltis. 1999. Intraspecific phylogeny analysis using ITS sequences: insights from studies of the Streptanthus glandulosus complex (Cruciferae). Syst. Bot.
24: 47-61.
Mclver, E.E. 1994. An early Chamaecyparis (Cupressaceae) from the Late Cretaceous of Vancouver Island, British Co­lumbia, Canada. Can. J. Bot. 72: 1787-1796.
Milne, I., F. Wright, G. Rowe, D.F. Marshall, D. Husmeier, and G. McGuire. 2004. TOPALi: software for automatic iden­tification of recombinant sequences within DNA multiple alignments. Bioinformatics 20: 1806-1807.
Neves, S.S., G. Swire-Clark, K.W. Hilu, and W.V. Baird. 2005.
Phylogeny of Eleusine (Poaceae: Chloridoideae) based on nuclear ITS and plastid trnT-trnF sequences. Mol. Phylo-
genet. Evol. 35: 395-419.
Nishimoto, Y., O. Ohnishi, and M. Hasegawa. 2003. Topologi-cal incongruence between nuclear and chloroplast DNA trees suggesting hybridization in the urophyllum group of the genus Fagopyrum (Polygonaceae). Genes Genet. Syst.
78: 139-153.
Peng, D. and X.Q. Wang. 2008. Reticulate evolution in Thuja inferred from multiple gene sequences: implications for the study of biogeographic disjunction between eastern Asia
and North America. Mol. Phylogenet. Evol. 47: 1190-1202. Qiao, C.Y., J.H. Ran, Y. Li, and X.Q. Wang. 2007. Phylogeny
and biogeography of Cedrus (Pinaceae) inferred from se­quences of seven paternal chloroplast and maternal mito-
chondrial DNA regions. Ann. Bot. 100: 573-580. Ran, J.H., X.X. Wei, and X.Q. Wang. 2006. Molecular phylog-
eny and biogeography of Picea (Pinaceae): implications for phylogeographical studies using cytoplasmic haplotypes.
Mol. Phylogenet. Evol. 41: 405-419.
Ronquist, F. 1997. Dispersal-vicariance analysis: a new ap­proach to the quantification of historical biogeography.
Syst. Biol. 46: 195-203.
Soltis, D.E. and R.K. Kuzoff. 1995. Discordance between nuclear and chloroplast phylogenies in the Heuchera Group (Saxifragaceae). Evolution 49: 727-742.
Swofford, D.L. 2002. PAUP*: Phylogenetic Analysis Using
Parsimony (* and other methods). Version 4.0b8. Sinauer Associates, Sunderland, MA.
Tamura, K., J. Dudley, M. Nei, S. Kumar. 2007. MEGA4: Mo­lecular Evolutionary Genetics Analysis (MEGA) software
version 4.0. Mol. Biol. Evol. 24: 596-1599
520
Botanical Studies, Vol. 51, 2010
Thompson, J.D., T.J. Gibson, F. Plewniak, F. Jeanmougin, and D.G. Higgins. 1997. The CLUSTAL—X windows interface: flexible strategies for multiple sequence alignment aided by quality analysis tools. Nucleic Acids Res. 25: 4876-82.
Van Raamsdonk, L.W.D., M.P. Smiech, and J.M. Sandbrink. 1997. Introgression explains incongruence between nuclear and chloroplast DNA-based phytogenies in Allium section Cepa. Bot. J. Linn. Soc. 123: 91-108.
Wang, W.P., C.Y. Hwang, T.P. Lin, and S.Y. Hwang. 2003. His­torical biogeography and phylogenetic relationships of the genus Chamaecyparis (Cupressaceae) inferred from chloro-plast DNA polymorphism. Plant Syst. Evol. 241: 13-28.
Welch, H.J. 1991. The Conifer Manual. Kluwer Academic Publishers, Dordrecht, the Netherlands.
Xiang, Q.Y., D.E. Soltis, P.S. Soltis, S.R. Manchester, and D.J. Crawford. 2000. Timing the eastern Asian-eastern North American floristic disjunction: molecular clock corroborates paleontological estimates. Mol. Phylogenet. Evol. 15:
462-472.
Yamakawa, C., A. Momohara, T. Nunotani, M. Matsumoto, and Y. Watano. 2008. Paleovegetation reconstruction of fossil forests dominated by Metasequoia and Glyptostrobus from the late Pliocene Kobiwako Group, central Japan. Paleontol. Res. 12: 167-180.
重新審視扁柏屬植物北美與東亞之間斷分布
廖培鈞1,2 林讚標3 黃士穎1
1國立臺灣師範大學生命科學系
2國立屏東科技大學生命科學系
3國立臺灣大學植物科學研究所
全世界的扁柏屬植物共有六個分類群,分布在北美及東亞地區。根據以往以葉綠體DNA進行的
親緣關係研究指出現存的扁柏屬植物經歷過兩次的獨立起源,並分別從北美遷移至東亞。然而藉由形
態及核DNA建構的親緣樹卻呈現不一致的結果。本研究中,我們重新定序了葉綠體matK基因序列,
並從基因資料庫(NCBI)下載其他序列重新建構扁柏屬的親緣關係,並擬重新確認扁柏屬植物的生物地
理模式。以matK重建之基因樹與先前依據葉綠體DNA所得結果一致,但不同於以rbcLITS重建之
基因樹。rbcL基因缺乏足夠的變異資訊位點,故可能造成譜系檢選與其他葉綠體DNA不一致;而ITS
的結果與前人研究相悖,顯示ITS可能受到多重拷貝造成的非同源性及網狀演化(基因重組或漸滲雜
交)影響,而降低親緣關係推論之可信度。同質化分檢測(PHT)亦證實葉綠體DNA與核DNA可能經
歷不一致的演化歷程,故不建議將序列合併分析。根據葉綠體DNA序列所得之親緣假說(matK型基因
樹),以DIVA進行之儉約法分析併以化石紀錄及地質證據,推論現存的扁柏屬植物經歷過兩次獨立的
遷移事件,最有可能的起源地位於北美洲,經由白令陸橋抵達東亞的日本及台灣。此推論支持前人以葉
綠體DNA為基礎所作之生物地理推論。而以核DNA建構之基因樹則可能受雙親遺傳等交錯的演化關
係影響,故以核DNA進行生物地理探討時需格外謹慎。
關鍵詞:扁柏屬;間斷分布;親緣關係;matK