Botanical Studies (2011) 52: 295-303.
PHYSIOLOGY
Effects of nitrogen status on leaf anatomy, chlorophyll content and canopy reflectance of paddy rice
Yuh-Jyuan LEE1, Chwen-Ming YANG1, Kuo-Wei CHANG2, and Yuan SHEN3 *
1Division of Crop Science, Taiwan Agricultural Research Institute, Wufeng, Taichung Hsien 41301, Taiwan
2Department of Leisure and Recreation Studies, Aletheia University, Tainan Hsien 72147, Taiwan
3Department of Soil & Environmental Sciences, National Chung-Hsing University, Taichung 40227, Taiwan
(Received April 27, 2010; Accepted March 23, 2011)
ABSTRACT. Precision agriculture can reduce the environmental pollution that results from over applica­tion of nitrogen (N) fertilizers by acquiring timely N status assessments of field plants through remote sensing techniques. To establish effective remote sensing models for plant N assessment, we carried out experiments using different rates of N fertilizer and examined changes in leaf anatomical characteristics, chlorophyll con­tent and canopy reflectance behavior at the panicle initiation stage of paddy rice (Oryza sativa L. cv. Tainung 67). Results showed that plants with higher N content not only had higher chlorophyll content but also had thicker, flatter and more turgid leaves, which enhances visible light absorption while stimulating near-infrared reflection. Derivative type predictors, using the transition region from red and near-infrared wavebands, not only accounted for the changes in leaf chlorophyll content and structures induced by varied N content, but helped eliminate background soil interferences. Therefore, derivative type predictors may be more appropriate than reflectance values at specific band(s) and band ratios in establishing a robust model for plant N status as­sessment.
Keywords: Chlorophyll content; Leaf micrographic structure; Nitrogen; Paddy rice; Remote sensing.
INTRODUCTION
or 400 nm, 620 nm and 880 nm (regression with three variables) correlated well with leaf N concentration. They found a linear relationship between the measured and the predicted values for various types and cultivars of rice. Takebe et al. (1990) stated that green color intensity values and total N content of the second leaf from the top of rice plants were highly correlated. Inoue et al. (1998) reported a close relationship between the normalized difference vegetation index (NDVI) of R1100 and R660 [(R1100-R660)/ (R1100+R660)] and leaf N accumulation per unit ground area (LNA) in rice when LNA was lower than 3 g m-2. Xue et al. (2004) suggested that the reflectance ratio of 810 nm to 560 nm (R810/R560) was linearly related to total leaf N ac­cumulation, independent of N level and growth stage. Lee et al. (2008) showed that the first derivative of the canopy reflectance spectrum at 735 nm (dR/dX^) was linearly related to plant N concentrations measured at the panicle formation stage, and remained valid over season, year and location changes.
Thus, practical and usable remote sensing techniques for tissue monitoring and precision management of N nu­trition seem to be promising for rice crops. In-depth stud­ies on changes in internal leaf structure, morphological characteristics and optical properties in response to plant N status could provide physiological and anatomical ex­planations for the observed reflectance spectral response to N application. The correlation between leaf anatomy and
Rice yields are closely related to the nitrogen (N) status of plants prior to their heading stage (Cui and Lee, 2002; Ntanos and Koutroubas, 2002). However, over applica­tion of N fertilizers has caused many environmental pol­lution problems. Site-specific soil and crop management (SSCM), also known as precision agriculture, is a farming system that considers the spatial and temporal variability in soil properties and crop productivity (Mulla and Schep-er, 1997). This farming system is expected to improve the efficiency and efficacy of fertilization, particularly in re­ducing the environmental pollution that results from over application of N fertilizers (Cassman et al., 2002; Raun et al., 2002; Hong et al., 2006).
Remote sensing plays a valuable role in providing spa­tial and time-critical information for precision agriculture, due to its potential capabilities in measuring biophysical indicators and detecting spatial variability (Guyot, 1990). Many researchers have tried to utilize visible and near-infrared spectral responses to assess rice plant N status. Shibayama and Akiyama (1986) found that reflectance val­ues at 620 nm and 760 nm (regression with two variables)

*Corresponding author: E-mail: yshen@nchu.edu.tw; Tel: +886-4-22872619; Fax: +886-4-22862043.
296
Botanical Studies, Vol. 52, 2011
canopy reflectance, however, along with other informa­tion, is not yet clear for rice. The amount of N absorbed during the early phase of panicle formation (from panicle primordial initiation to spikelet initiation) contributes to the differentiation of branches and spikelets (Mae, 1997). The nitrogen absorbed during the late phase of panicle formation increases the hull size and percentage of filled grains by decreasing the number of degenerated spikelets, and contributes to grain filling by increasing specific leaf weight and N content in leaves. Therefore, assessing the N status of rice plants at the panicle initiation/formation stage is critical when determining the potential yield. The objectives of this research were to investigate changes in internal leaf structure, total chlorophyll content and canopy reflectance of rice plants as a function of N status measured at the stage of panicle initiation/formation. Such results may serve as the theoretical basis of reflectance be­havior and provide valuable information in selecting more proper predictors for better assessment of plant N status.
during rice growth as needed.
Additional information regarding the changes from leaf chlorophyll content to plant N content was attained during Experiment II, conducted at TARI's Chiayi Experimental Station farm in Shiko (23o34' N, 120o24' E). The trans­planting occurred on 1 March 2003 for the first crop and on 5 August 2003 for the second crop. Plot designs and cultivation practices were applied as in the previous ex­periment, except that ammonium sulfate was applied at the rates of 0, 45, 90 and 180 kg N ha-1
.
Canopy reflectance spectra measurements
A field-portable spectroradiometer (LI-1800, LI-COR, Inc., Lincoln, Nebraska, USA) connected with a quartz fiber-optic probe (LI-1800-10) and a remote cosine recep­tor (LI-1800-11) was used to measure canopy reflectance spectrum near the ground. The handheld receptor was pointed downward in a nadir-viewing 1.5 m above the canopy surface to scan the upward reflected radiation. To correct for temporal variation in solar radiation and to reduce sunlight interference, the irradiance spectra of incident sunlight was taken before and after each replicate measurement using the average as the basis for reflectance calculation. Individual waveband reflectance at 2 nm in­tervals was calculated by dividing the reflected vegetation radiance measurements with the corresponding incident solar radiation measurements.
Measurements were made in targeted regions of each block between 10:00-12:00 a.m. local standard time on days with no overhead cloud cover to avoid the solar angle effects and diffuse light contributions (Lord et al., 1985). Data obtained from each block were averaged and the mean of three replicates that underwent the same treat­ment was computed. The canopy reflectance data were further aggregated into 10-nm interval wavebands in the 350-1,100 nm range, and the mean reflectance of the rice canopy in waveband regions of blue (425-490 nm, BLUE), green (490-560 nm, GREEN), red (640-740 nm, RED)
and near-infrared (740-1,100 nm, NIR) was calculated for analyzing reflectance characteristics in relation to plant N status.
MATERIALS AND METHODS
Two experiments were conducted to examine leaf ana­tomical characteristics, total chlorophyll content, and can­opy reflectance behavior as a function of N status on rice (Oryza sativa L.) grown in fields. The cultivar chosen for the experiments was Tainung 67, a semi-dwarf japonica variety used in more than 70% of paddy fields across Tai­wan and whose growth and yield production are known to be susceptible to N application rates (Juang and Huang, 1984).
Changes in canopy reflectance spectra (330-1,100 nm), internal leaf structure and anatomical characteristics, as affected by plant N status, were determined in Experi­ment I, conducted at the Taiwan Agricultural Research Institute (TARI) experimental farm in Wufeng (2330: N, 120o42' E) during both 2001 cropping seasons. Three field plots (replicates), each 0.5-ha in size and divided into four equal-area blocks (25 m wide and 50 m long) laid out side-by-side, were set up. Seedlings at the three- to four-leaf stage were machine-transplanted, 3-5 plants per hill, at row spacing of 0.3 m and hill distance of 0.18 m. The transplanting date was 6 March 2001 for the first season crop, with a lifespan about 120 days, and on 12 August 2001 for the second season crop, with a lifespan about 110 days. Four different application rates (0, 60, 120, 180 kg N ha-1) of N fertilizer, in the form of ammonium sulfate, were assigned to each of these four blocks. N fertilizer was split into four doses; 25% of each amount distributed as pre-planting basal five days before transplanting; 20% as the first top dressing applied one week (second crop) or two weeks (first crop) after transplanting (WAT); 30% as the second top dressing added three WAT (second crop) or four WAT (first crop); and the remaining 25% was used 20 days before heading (ca. 6-8 WAT). For all N treatments, adequate phosphate (70 kg P2O5 ha-1) and potassium (70 kg K2O ha-1) fertilizers were also applied based on local recommendation; herbicides and pesticides were sprayed
Leaf anatomical characteristic and chlorophyll content measurements
After obtaining canopy spectral measurements, tagged plants at the stage of panicle initiation were sampled from targeted regions of different N-treated blocks in Experi­ment I, on April 20, 2001 for the first cropping season, and on September 24, 2001 for the second cropping sea­son, Rice from six different mounds was sampled. Fresh weights of the aerial parts (leaf blades and culms) were taken immediately after sampling. Dry weights were mea­sured after oven-drying at 80°C for 72 hours before mill­ing. The powdered samples were passed through a 0.1 mm mesh to determine the total N content of the aerial plant portions using the modified Kjeldahl method (Bremner, 1996) as modified by Lee et al. (2002). Leaf water content
LEE et al. ― Rice canopy reflectance and nitrogen status
297
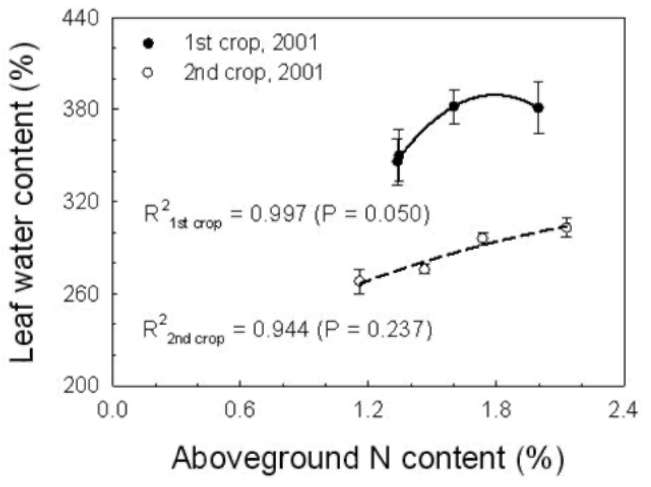
(LWC; %) was calculated as:
LWC = [(FW - DW)/DW] x 100 (1)
where FW and DW were fresh weight and dry weight of the sampled leaves, respectively.
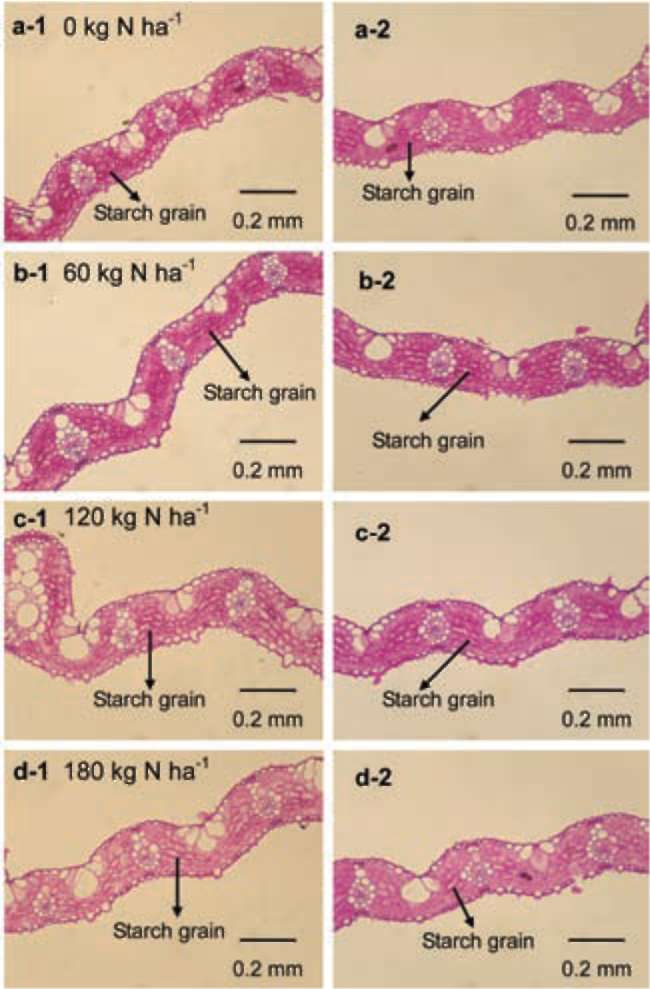
Another three mounds of each treatment were sampled at the same targeted regions the following morning, to minimize dehydration of the dissected tissue and the di­urnal swelling/shrinkage cycle (McBurney, 1992). For determining leaf anatomical characteristics, six 10 mm long segments were cut consecutively 100 mm away from the apex of the upper-most fully expanded leaf blades on the main culms, were immediately fixed in FAA solution (formaldehyde: acetic acid:70% ethanol = 5:5:90, v/v/v) (Sass, 1958), then dehydrated in a TBA (tertiary butyl al­cohol) series. The completely-dehydrated segments were immersed into paraffin in a 60-62°C oven. The process of paraffin infiltration was done three to four times before embedding samples with a paraffin dispenser (Lecia EG 1120, Leica Microsystems Nussloch GmbH, Germany). Cross-sections of 10 [im thick prepared from a rotary mi­crotome (Leica RM 2135) were stained with 1% safranin-fast green, for discriminating internal leaf structure. For differentiating starch granules, PAS (periodic acid-Schiff's reaction for carbohydrates) (Jensen, 1962) was also ap­plied. The slides were mounted in balsamo resin (ASSIS-TENT-Histokitt, Hecht Assistant Company, Germany).
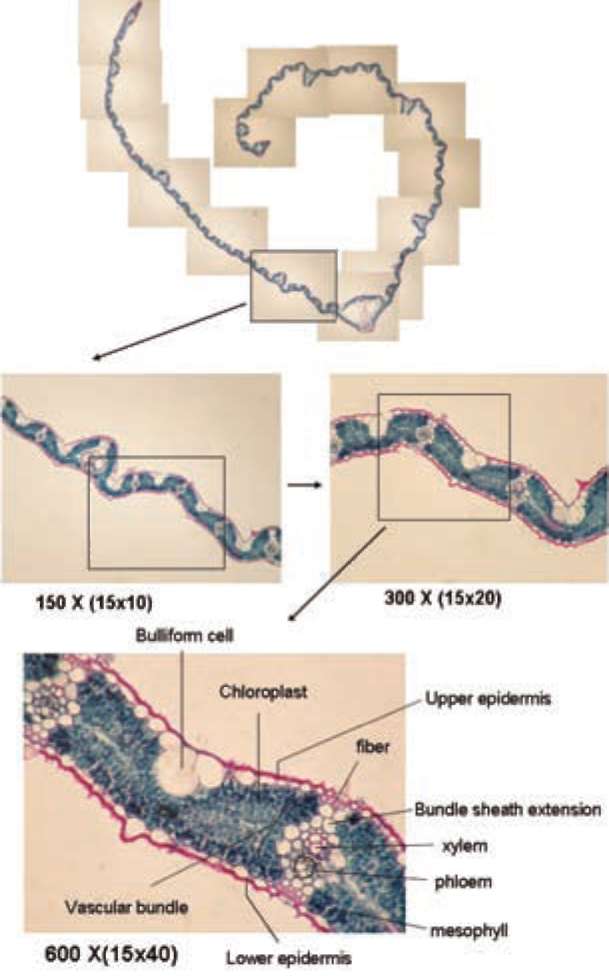
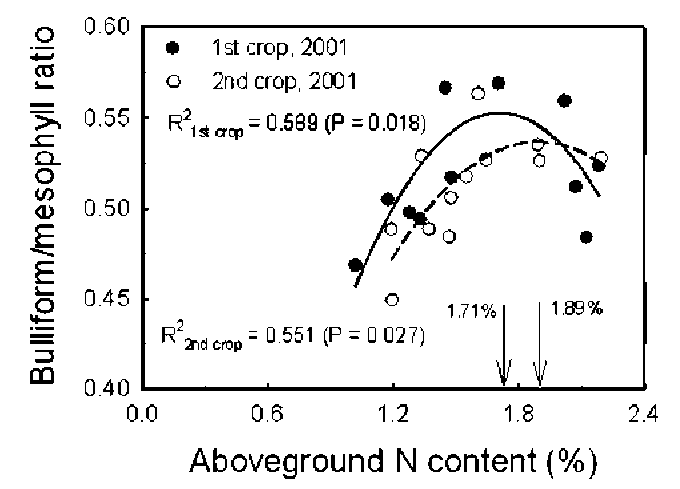
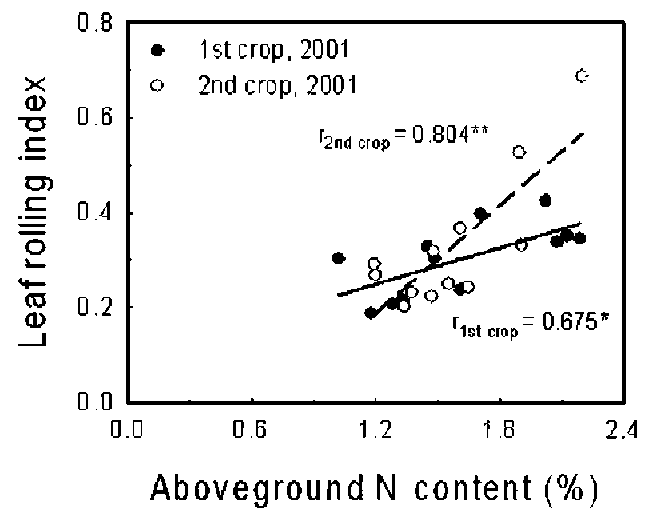
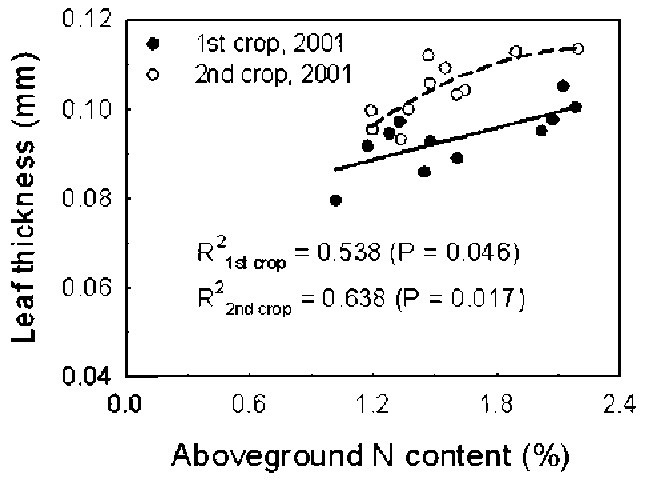
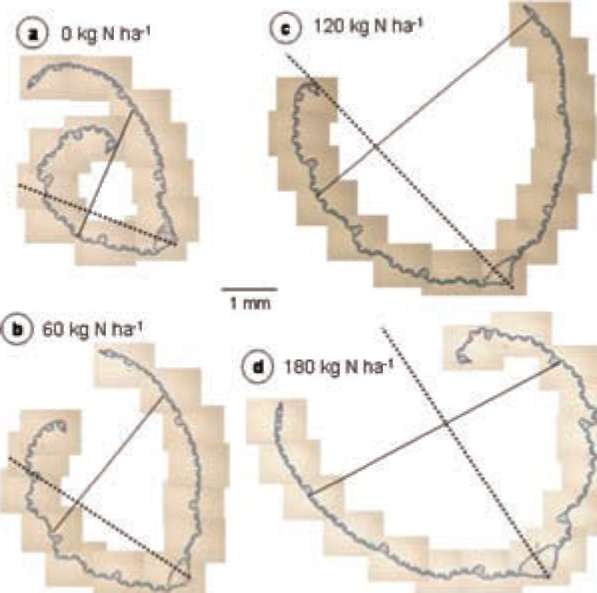
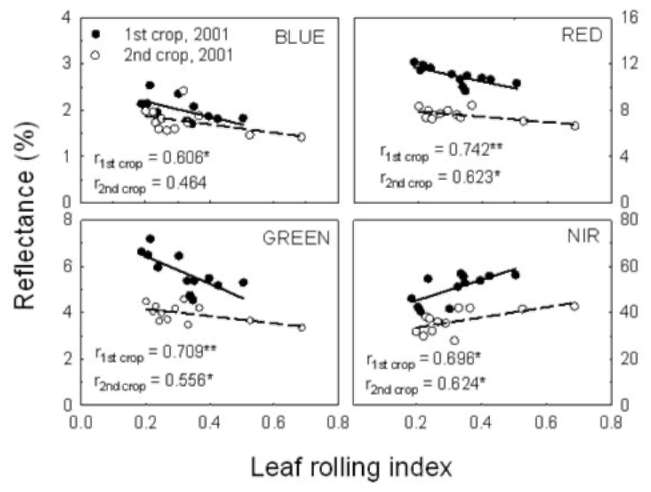
Photographs of the tissue samples were taken under a light microscope (New Vanox-S AH-2, Olympus Corp., Japan) operated at magnifications of 150, 300, and 600 X using a digital camera (E5400, Nikon Corp., Japan). Mi­crographs were analyzed with the image analysis software SimplePCI (Compix Inc., Imaging Systems, USA) and the desired anatomical leaf characteristics, including leaf width, leaf thickness, bulliform cells and the mesophyll layer, were identified and quantified for comparison with aerial N content and canopy reflectance. Leaf thickness was measured from the traversed distance across the leaf blade mesophyll, and values from more than twelve loca­tions along the mesophyll layer of each segment were averaged, using the mean of three replicates as represen­tative. The leaf rolling index (LRI) was determined by dividing the distance of the cross axis perpendicular to the axis of the rolling leaf midrib to the width of leaf sec­tion, where 0 < LRI < 1 (1 = flat leaf), and was used as an indicator of the magnitude of leaf rolling after dissection. The size of bulliform cells was determined by first hand drawing boundaries around each cell then computed us­ing the SimplePCI "Area" function. The size ratio of bul-liform cells to mesophyll (bulliform/mesophyll ratio) was computed for plants treated with different N rates, and was used to represent leaf movement strength (Buleon et al., 1998); a large ratio represents stronger leaf movement.
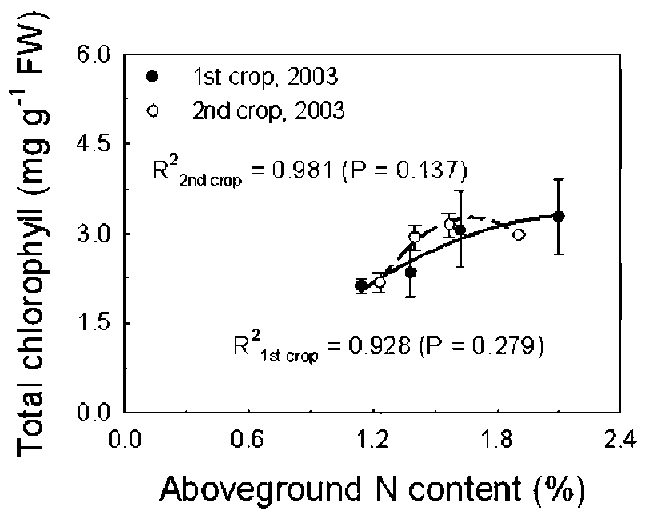
In Experiment II, rice from four mounds was sampled at the panicle initiation stage from each of three targeted treatment regions. This occurred on 2 May 2003 for the first cropping season and on 25 September 2003 for the second cropping season. The leaf chlorophyll content
was then determined by the modified method of Lee et al.
(2002).
Statistical analyses
The graphs were plotted using SigmaPlot 8.0.2 (SPSS ASC BV, The Netherlands). All variables were determined and averaged in each replicate. The mean and standard error of three replicates were calculated. The correlation coefficient (r) between the measured aerial N content and the amount of N fertilizer applied was computed. In cor­relation analysis for N effect evaluation, coefficient of determination (R2) between the measured anatomical leaf characteristics and band reflectance to aerial N or chloro­phyll content was calculated.
RESULTS
Nitrogen content of aerial plant portions at the panicle initiation stage increased linearly with increasing N appli­cation rates (Figure 1). The values increased more rapidly in plants grown during the second cropping season than in those grown during the first cropping season.
Anatomical characteristics of leaf blade cross-sections are shown (Figure 2). The mesophyll layer of leaf blades from the upper-most fully expanded leaves were primarily composed of folded parenchyma cells, which were densely packed with chloroplasts giving the dark blue appear­ance when stained with 1% safranin-fast green. Vascular bundles were arranged parallel to each other throughout the leaf, where the xylem, phloem and bundle sheath of the vascular system were recognized. Bulliform cells, also called motor cells, were located between vascular bundles and at the bottom of the furrows of the upper epidermal surface. Starch granules were more loosely distributed and packed in the parenchyma cells in plants with higher N content (Figure 3).
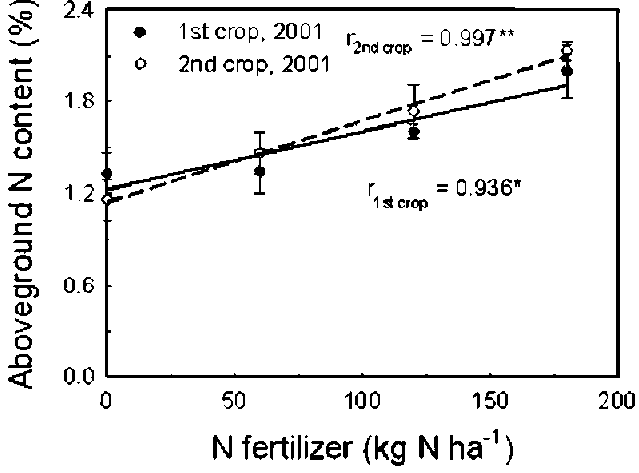
Figure 1. Changes in aerial nitrogen content to the application rates of nitrogen fertilizer for rice plants (Oryza sativa L. cv. Tainung 67) grown in the first and the second cropping seasons of2001.
298
Botanical Studies, Vol. 52, 2011
The size ratio of bulliform to mesophyll cells and the aerial N content was best fitted by quadratic functions for both the first and second season crops (Figure 4). The ratio decreased after reaching the maximum value, 1.71% for the first season crop and 1.89% for the second season crop. The mean leaf blade thickness altered significantly in plants having different N status (Figure 5). Leaf thickness increased progressively with increasing aerial N content in a curvilinear fashion. At the same N level, rice plants grown during the second cropping season tended to have thicker leaf blades than those grown during the first crop­ping season.
Rice leaves appeared to roll up both visually and ana­tomically when excised from intact plants (Figure 6), but did so to a lesser extent when treated with amounts of N fertilizer. The values of leaf rolling index (LRI) against those of the aerial N content showed a positive linear relationship for both cropping seasons (Figure 7). Plants with higher aerial N content had higher LRI values, i.e. more flattened leaves. The leaf water content (LWC) changed in a curvilinear trend in the measured range of aerial N content, and leaves of plants grown during the
first cropping season had higher LWC levels than those grown with the same N amount during the second crop­ping season (Figure 8).
Figure 3. Epidermal cell segment differences in starch granule packing observed in leaf cross-sections from the upper-most fully expanded leaves of rice plants (Oryza sativa L. cv. Tainung 67) grown with different rates of N application. x300.
Figure 2. Internal leaf structure and anatomical characteristics observed in rice plants (Oryza sativa L. cv. TNG 67) cross-sections at the panicle initiation stage.
Figure 4. Changes in bulliform/mesophyll ratio to aerial N con­tent for rice plants (Oryza sativa L. cv. Tainung 67) grown dur­ing the first and the second cropping seasons of 2001.
LEE et al. ― Rice canopy reflectance and nitrogen status
299
Although not statistically significant due to the limited sample size, plants with elevated N contents tended to have higher total leaf chlorophyll measurements at the panicle initiation stage during both cropping seasons (Figure 9). Reflectance values of the visible wavebands (BLUE, GREEN and RED) decreased with increasing N content in leaves, but reflectance in the NIR band increased with increasing N content (Figure 10). Negative correlations were observed in reflectance at BLUE, GREEN and RED wavebands with LRI while a positive correlation existed
for the NIR band (Figure 11).
Figure 7. Changes in leaf rolling index (LRI) to aerial N content for rice plants (Oryza sativa L. cv. Tainung 67) grown during the first and the second cropping seasons of 2001.
Figure 5. Changes in thickness of leaf blades to aerial N content for rice plants (Oryza sativa L. cv. Tainung 67) grown during the first and the second cropping seasons of 2001.
Figure 8. Changes in leaf water content (LWC) to aerial N con­tent for rice plants (Oryza sativa L. cv. Tainung 67) grown dur­ing the first and the second cropping seasons of 2001.
Figure 6. Features of leaf rolling observed in leaf cross-sections from the upper-most fully expanded leaves of rice plants (Oryza sativa L. cv. Tainung 67) grown with different rates of N appli­cation. x150.
Figure 9. Changes in total leaf chlorophyll content to aerial N content for rice plants (Oryza sativa L. cv. Tainung 67) grown during the first and the second cropping seasons of 2003.
300
Botanical Studies, Vol. 52, 2011
Figure 10. Changes of canopy reflectance in spectral regions of blue (425-490 nm, BLUE), green (490-560 nm, GREEN), red
(640-740 nm, RED), and near-infrared (740-1,100 nm, NIR) to
aerial N content for rice plants (Oryza sativa L. cv. Tainung 67) grown in the first and the second cropping seasons of 2001.
Figure 11. Changes of canopy reflectance in spectral regions of
blue (425-490 nm, BLUE), green (490-560 nm, GREEN), red (640-740 nm, RED), and near-infrared (740-1,100 nm, NIR) to
leaf rolling index (LRI) for rice plants (Oryza sativa L. cv. Tai-nung 67) grown during the first and the second cropping seasons
of 2001.
DISCUSSION
phyll ratio increase and the increasing N level.
Leaf chlorophyll content altered the leaf transmit-tance and reflectance in the visible region (Blackmer et al., 1996; Hansen and Schjoerring, 2003). The higher chlorophyll content of rice plants with higher N content (Figure 9) tended to absorb more strongly in the visible region, which resulted in the decrease of reflectance at BLUE, GREEN, and RED bands (Figure 10). Reflectance in the near-infrared region is related to the diffraction at air-liquid interface within the leaves, and is thus affected by internal leaf structure and canopy architecture (Guyot, 1990). The increases of reflectance at NIR were related to increases of crop biomass, leaf area index and canopy water content (Guyot, 1990; Broge and Leblanch, 2000; Thenkabail et al., 2000; Thenkabail, 2002). Accordingly, the thicker, flatter and more turgid leaves of plants, due to higher N content, would reflect strongly in the NIR band (Figures 10 and 11).
When using canopy reflectance spectrum for plant N status assessment, the predictors used in the regression models should account for as many of these anatomic and physiological changes as possible, but should not be confounded with other unnecessary information such as background soil reflectance, percent cover and variety's spectrum signature. Shibayama and Akiyama (1986) and Takebe et al. (1990) used canopy reflectance at several bands as plant N status predictors in their models. How­ever, the predictors they used are easily affected by canopy morphology, the spectral characteristics of leaves and soil background (Tarpley et al., 2000). Instead, Inoue et al. (1998) and Xue et al. (2004) used spectral band ratios as plant N status predictors. Though their predictors are helpful in correcting the variation of canopy reflectance resulting from the variation in irradiance, leaf orienta­tion, irradiance angles and shading (Tarpley et al., 2000),
The N content increase in the aerial portion, shown in Figure 1, was more pronounced in plants grown during the second cropping season (0.0054% N increase per kg of N applied) than in those grown in the first cropping season (0.0037% N increase per kg of N applied). This was considered to be due to the difference in weather con­ditions during the two cropping seasons. As temperature and irradiance were higher in the vegetative growth phase of the second cropping season, relative to that of the first cropping season, the rapid plant growth at the early growth stage might favor N accumulation in the aerial parts of rice plants grown during the second crop season (Lin, 1979).
The bulliform cell enlargement within the mesophyll layer (Figure 4) is a logical response to higher N since the function of bulliform cells is to control leaf movements (Buleon et al., 1998) and more turgid and larger leaves were observed in plants having higher N levels. However, the bulliform/mesophyll ratio decreased after reaching the threshold values (1.71% for the first season crop and 1.89% for the second season crop), implying that there was a size limit for bulliform cells.
Leaves of rice plants with higher N content had dis­persed and less condensed starch granules (Figure 3), which implied fewer stored reserves. Besides, plants with higher aerial N content had higher LRI values (Figure 7) and higher LWC (Figure 8), which suggested that plants with higher N levels attain a superior leaf expanding vigor and thus exert a stronger outward tension to impede leaf rolling. Thicker leaves (Figure 5) and higher LWC (Figure 8) were also in accordance with the observed vigorous growth of plants enhanced by an abundant N supply. These phenomena in turn explained the positive relationship between LRI and aerial N content and the bulliform/meso-
LEE et al. ― Rice canopy reflectance and nitrogen status
301
they are still not very useful in eliminating the unwanted background soil reflectance (Gitelson and Merzlyak, 1994; Gitelson et al., 1996; Daughtry et al., 2000).
The derivative type predictor, such as dR/dX^s by Lee et al. (2008), accounted for changes of reflectance spec­trum between the red to near-infrared region. As shown in this study, the slope of the reflectance spectrum in this region would increase with increasing plant N content, due to the increased absorption by chlorophyll and the reflec­tion by thicker, flatter and more turgid leaves. Additionally, derivative spectral indices can remove the linear feature, such as those from background soil (Steven et al., 1990; Li et al., 1993; Estep and Carter, 2005). In this regard, deriva­tive type predictors may be the better variable for plant N assessment models.
pp. 1085-1122.
Buleon, A., P. Colonna, V. Planchot, and S. Ball. 1998. Structural
processes during starch granule hydration by synchrotron radiation microdiffraction. Intl. J. Biol. Macromol. 23: 85­112.
Cassman, K.G., A. Dobermann, and D.T. Walters. 2002. Agro-ecosystems, nitrogen-use efficiency, and nitrogen manage­ment. Ambio 31: 132-140.
Cui, R.X. and B.W. Lee. 2002. Spikelet number estimation model using nitrogen nutrition status and biomass at panicle initiation and heading stage of rice. Korean J. Crop Sci. 47: 390-394.
Daughtry, C.S.T., C.L. Walthall, M.S. Kim, E.B. de Colstoun,
and J.E. McMurtrey. 2000. Estimating corn leaf chlorophyll concentration from leaf and canopy reflectance. Remote Sens. Environ. 74: 229-239.
Estep, L. and G.A. Carter. 2005. Derivative analysis of
AVIRIS data for crop stress detection. Photogrammetric Engineering & Remote Sensing 71: 1417-1421.
Gitelson, A.A. and M.N. Merzlyak. 1994. Spectral reflectance changes associated with autumn senescence of Aesculus hipp castanum L. and Acer platanoides L. leaves. Spectral features and relation to chlorophyll estimation. J. Plant
Physiol. 143: 286-292.
Gitelson, A.A., Y.J. Kaufman, and M.N. Merzlyzak. 1996. Use of a green channel in the remote sensing of global vegeta­tion from EOS-MODIS. Remote Sens. Environ. 58: 289­298.
Guyot, G. 1990. Optical properties of vegetation canopies. In M.D. Steven and J.A. Clark (eds.), Applications of Remote Sensing in Agriculture. Butterworths, London, UK. pp. 19­43.
Hansen, P.M. and J.K. Schjoerring. 2003. Reflectance measure­ment of canopy biomass and nitrogen status in wheat crops using normalized difference vegetation indices and partial least squares regression. Remote Sens. Environ. 86: 542­553.
Hong, N., J.G. White, R. Weisz, C.R. Crozier, M.L. Gumpertz,
and D. K. Cassel. 2006. Remote Sensing-Informed Variable-Rate Nitrogen Management of Wheat and Corn: Agronomic and Groundwater Outcomes. Agron. J. 98: 327-338.
Inoue, Y., M.S. Moran, and T. Horie. 1998. Analysis of spectral measurements in paddy field for predicting rice growth and yield based on a simple crop simulation model. Plant Prod.
Sci. 1: 269-279.
Jensen, W.A. 1962. Botanical Histochemistry. W. H. Freeman and Company, San Francisco-London, pp. 55-99.
Juang, T.C. and Y.M. Huang. 1984. Increasing yield of the sec­ond crop rice with improvement of fertilizer efficiency and soil nitrogen fertility. In D.J. Liu and S.C. Hsieh (eds.), Regional and Seasonal Causes of Low Yield in Rice and Measures of Improvement. Special Pub. No. 16. Taiwan Agric. Res. Inst., Taichung, Taiwan, pp. 1-6. (in Chinese with English summary)
CONCLUSIONS
This study suggests that rice plants exhibit differential morphological, anatomical, and photosynthetic plasticity in response to the N status changes that result when vary­ing amounts of N fertilizer are applied. The correlations between canopy reflectance spectra and anatomical leaf characteristics (e.g., LRI, bulliform/mesophyll ratio and LWC) and chlorophyll content indicate that remote sens­ing techniques have potential for assessing N status in rice. The derivative type predictors using the transition region between red and near-infrared wavebands have numerous advantages over other predictor types. Such predictors could account for the changes in leaf chlorophyll content and structures induced by plant N content and were less hindered by other influences.
Acknowlegements. This work was supported by grants (91AS-5.1.3-CI-C2 and 92AS-1.1.6-CI-C1) from the Council of Agriculture of Executive Yuan, Taiwan R.O.C. and by the Ministry of Education, Taiwan, R.O.C. under the ATU plan. Professor Song-Iuan Liaw in the Depart­ment of Life Sciences and Professor Jen-Hsien Chen in the Department of Soil and Environmental Sciences at National Chung-Hsing University kindly provided their re­spective help with rice anatomy and N analyses techniques and are deeply appreciated.
LITERATURE CITED
Blackmer, T.M., J.S. Schepers, G.E. Varvel, and E.A. Walter-
Shea. 1996. Nitrogen deficiency detection using reflected shortwave radiation from irrigated corn canopies. Agron. J.
88: 1-5.
Broge, N.H. and E. Leblanc. 2000. Comparing prediction power and stability of broadband and hyperspectral vegetation indices for estimation of green leaf area index and canopy chlorophyll density. Remote Sens. Environ. 76: 156-172.
Bremner, J.M. 1996. Nitrogen-total. Methods of Soil Analysis. Part 3. Chemical Methods. In D.L. Sparks et al. (eds.), SSSA Book Ser. 5. SSSA and ASA, Madison, WI., USA,
302
Botanical Studies, Vol. 52, 201'
Lee, Y丄,C.M. Yang, and A.H. Chang. 2002. Changes of nitro­gen and chlorophyll contents and spectral characteristics to the application of nitrogen fertilizer in rice plants. J. Agric. Res. China 51: 1-14. (in Chinese with English abstract)
Lee, Y.J., C.M. Yang, K.W. Chang, and Y. Shen. 2008. Field test
of the simple spectral index using 735nm in mapping nitro­gen status of rice canopy. Agron. J. 100: 205-212.
Li, Y., T.H. Demetriades-Shah, E.T. Kanemasu, J.K. Shultis, and M.B. Kirkham. 1993. Use of second derivatives of canopy reflectance for monitoring prairie vegetation over different soil backgrounds. Remote Sens. Environ. 44: 81-87.
Lin, A.C. 1979. Comparison on the photosynthesis under com­munity conditions between the first and second crops of rice. In: Proceedings of the Symposium on the Causes of Low Yield of the Second Crop Rice in Taiwan and the Mea­sures for Improvement. 7-8 June 1978, Taiwan Agricultural Research Institute. Published by National Science Council, Taipei, Taiwan, pp. 85-90. (in Chinese)
Lord, D., R.L. Desjardins, P.A. Dube, and E.J. Brach. 1985.
Variations of crop canopy spectral reflectance measure­ments under changing sky conditions. Photogram. Engin. Remote Sens. 51: 689-695.
Mae, T. 1997. Physiological nitrogen efficiency in rice: Nitrogen utilization, photosynthesis, and yield potential. Plant Soil.
196: 201-210.
McBurney, T. 1992. The relationship between leaf thickness and plant water potential. J. Exp. Bot. 43: 327-335.
Mulla, D.J. and J.S. Schepers. 1997. Key processes and proper­ties for site-specific soil and crop management. The state of site-specific management for agriculture. In F.J. Pierce and E.J. Sadler (eds.), ASA, CSSA, SSSA, Madison, WI. USA, pp. 1-18.
Ntanos, D.A. and S.D. Koutroubas. 2002. Dry matter and N ac­cumulation and translocation for Indica and Japonica rice
under Mediterranean conditions. Field Crops Res. 74: 93­101.
Raun, W.R., J.B. Solie, G.V. Johnson, M.L. Stone, R.W.
Mullen, K.W. Freeman, W.E. Thomason, and E.V. Lukina. 2002. Improving nitrogen use efficiency in cereal grain production with optical sensing and variable rate application. Agron. J. 94: 815-820.
Sass, J.E. 1958. Botanical Microtechnique. 3rd ed. Iowa State
College Press, Ames, IA., USA. 228 pp.
Shibayama, M. and T. Akiyama. 1986. A spectroradiometer for field use: VI. Radiometric estimation for chlorophyll index of rice canopy. Jpn. J. Crop Sci. 55: 433-438.
Steven, M.D., T.J. Malthus, T.H. Demetriades-Shah, F.M.
Dan-son, and J.A. Clark. 1990. High-spectral resolution indices for crop stress. In M.D. Steven and J.A. Clark (eds.), Ap­plications of Remote Sensing in Agriculture. Butterworths, London, UK, pp. 209-227.
Takebe, M., T. Yoneyama, K. Inada, and T. Murakami. 1990. Spectral reflectance ratio of rice canopy for estimating crop N status. Plant Soil. 122: 295-297.
Tarpley, L., K.R. Reddy, and G.F. Sassenrath-Cole. 2000. Reflec­tance indices with precision and accuracy in predicting cot­ton leaf nitrogen concentration. Crop Sci. 40: 1814-1819.
Thenkabail, P.S., R.B. Smith, and E. De Pauw. 2000. Hyperspec-tral vegetation indices and their relationships with agricul­tural crops. Remote Sens. Environ. 71: 158-182.
Thenkabail, P.S. 2002. Optimal hyperspectral narrowbands for discriminating agricultural crops. Remote Sens. Rev. 20:
257-291.
Xue, L., W. Cao, W. Luo, T. Dai, and Y. Zhu. 2004. Monitoring leaf nitrogen status in rice with canopy spectral reflectance.
Agron. J. 96: 135-142.
LEE et al. ― Rice canopy reflectance and nitrogen status
303
氮營養狀態對水稻葉片解剖結構、葉綠素含量及 植被反射光譜之影響
李裕娟1 楊純明1 章國威2 申  雍3
1台灣農業試驗所作物組
2真理大學休閒遊憩事業學系
3中興大學土壤環境科學系
應用遙測技術適時提供田間作物氮營養狀態資訊,對於採行精準農業操作,減少過量施用氮肥所造 成的環境污染問題非常重要。為能選擇最適當的因子,以建立推估作物氮營養狀態遙測模式,本研究利 用不同氮肥用量處理,探討植體氮營養狀態對水稻葉片解剖結構、葉綠素含量及植被反射光譜之影響。 研究結果指出氮含量高的植體,不僅葉片葉綠素含量片較高,葉片也較厚、堅挺且不易捲縮,因此增 強植被反射光譜在可見光區的吸收,且提高在近紅外光區的反射。利用植被反射光譜在紅光和近紅外光 區的微分值,可以同時考量植體氮營養狀態對葉綠素含量和葉片解剖結構的影響,並降低背景土壤的干 擾,因此比單純使用特定波段的反射值或波段比值更適合作為推估作物氮營養狀態迴歸模式的自變數使 用°
關鍵詞:遙測;水稻;葉片結構;葉綠素含量;氮營養。