Botanical Studies (2011) 52: 327-336.
ECOLOGY
Seed distribution of eleven tree species in a tropical forest in Taiwan
Yi-Ching LIN1*, Pei-Jung LIN2, Hsiang-Hua WANG3, and I-Fang SUN1
1Department of Life Science, Tunghai University, Taichung 40704, Taiwan
2Taroko National Park, 291, Fushih Village, Sioulin Township 97253 Hualien, Taiwan
3Forest Biology Division, Taiwan Forestry Research Institute, Taipei 10066, Taiwan
(Received April 28, 2010; Accepted April 12, 2011)
ABSTRACT. Seed distributions in a forested landscape represent the initial spatial template for tree popu­lations and determine the spatial relationships among individuals within the population. These spatial re­lationships impact interactions among neighboring plants and, thus, can significantly affect population and community dynamics. In this study, we documented the seed distribution of eleven tree species in a tropical forest in Taiwan. We determined the distribution of seeds at the stand level and examined factors that may directly and indirectly influence this distribution. This study was carried out in a 10 ha permanent plot (400 m x 250 m) in Kenting, Taiwan, from August 2006 to August 2007. A total of 72 seed traps were placed at 20-m intervals along four transects within the plot. Seed traps were checked weekly. All reproductive parts of woody plants greater than 1 mm were collected, dried, weighed and identified to species. Seed distributions were characterized by standardized Morisita's index and Green's dispersion index. The seeds of all 11 tree species were aggregated. Based on Ripley's L functions, parent trees of ten of the eleven species were also ag­gregated at certain spatial scales within the plot. The results of generalized additive mixed models (GAMM) suggested that seed aggregation was primarily a product of local topography and aggregation of the parent trees. For most species, seed distribution was significantly associated with parent abundance and three topo­graphic variables, elevation, convexity and slope. The patterns of seed distributions, however, did not reflect habitat preference of parent trees or seed traits. Aggregated seeds, such as those in this study, are likely to suf­fer density-dependent mortality, which could profoundly influence subsequent seedling dynamics.
Keywords: Forest dynamics; Generalized additive mixed model (GAMM); Seed dispersal; Spatial pattern.
INTRODUCTION
damentally impacts population dynamics and tree species coexistence in forests (Nathan and Muller-Landau, 2000;
Levine and Murrell, 2003).
However, at the stand level, there is limited empirical data on the overall spatial distribution of seeds (McEuen and Curran, 2007). Previous studies have focused on the distributions of seeds at the scale of individual trees and have documented seed distributions around isolated par­ent trees (Augspurger and Kitajima, 1992; Clark et al., 2005; Jansen et al., 2007). Many studies have examined the Janzen-Connell hypothesis, which states that seed distributions become less aggregated near the parent tree due to density-dependent mortality by natural enemies (Augspurger, 1984; Clark and Clark, 1984; Cintra, 1997). Other studies have followed the movement and behavior of frugivores to understand the subsequent seed distribu­tions of animal-dispersed species (Sork, 1984; Iida and Nakashizuka, 2004). Although these approaches provide an understanding of the process of seed dispersal, neither approach can generate a comprehensive picture of seed distributions at the stand level.
At the stand level, seeds are most likely to be aggre-
The overall spatial distribution of seeds in a forested landscape represents the immediate outcome of seed dis­persal at the population level and has significant ecological and evolutionary consequences. For each tree species, the seed distribution results from the dispersal of seeds from all reproductive individuals in the population. The seed distribution provides an initial spatial template that influ­ences the subsequent spatial pattern of the tree population and the spatial arrangement of neighbors (Nathan and Muller-Landau, 2000; Levin et al., 2003; Muller-Landau and Hardesty, 2005; Seidler and Plotkin, 2006). This spa­tial distribution may alter biotic interactions, such as com­petition, pathogen attacks, or seed predation, which may ultimately influence probability of post-dispersal mortality, seed germination, seedling establishment, and the survival and growth of individual trees (Harms et al., 2000). It fun-

*Corresponding author: E-mail: yichingtree@gmail.com; Tel: +886-4-2359-0121 ext. 32406; Fax: +886-4-2359­0269.
328
Botanical Studies, Vol. 52, 2011
gated, because dispersal distances for many tree species are short, thus, seeds are mostly deposited near their par­ents (Clark et al., 1998; Dalling et al., 2002; Svenning and Wright, 2005). As a consequence of such dispersal limita­tion, many seeds may fail to reach microhabitats suitable for germination and greatly impact subsequent seedling dynamics. Furthermore, seed distributions may reflect top­ographic features of forests. It has been demonstrated that the process of seed dispersal can be greatly altered by to­pography (Schurr et al., 2008). Topography may also influence seed distributions indirectly via parent distributions. Recent studies in several, large, forest dynamics plots have found that the majority of tree species in tropical forests are aggregated at the stand level (Condit et al., 2000; Sei-dler and Plotkin, 2006). Such aggregation of tree species may further reinforce seed aggregations at the stand level.
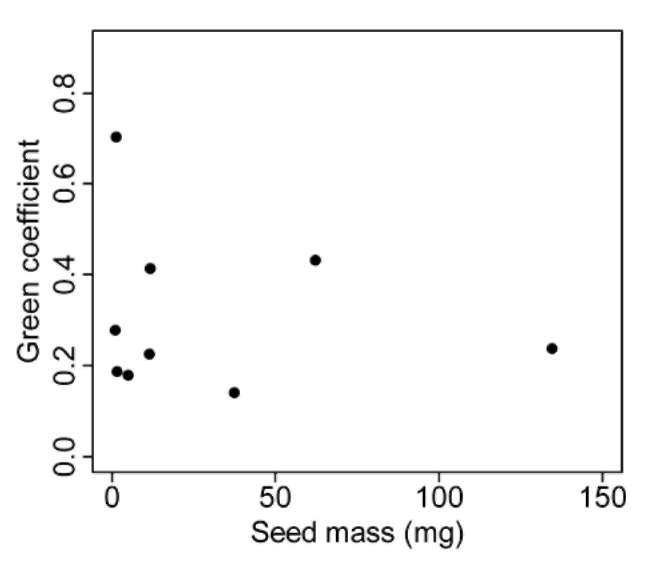
To what extent can seed distribution be predicted by species attributes associated with seed dispersal? The pro­cess of seed dispersal is closely related to seed traits, such as dispersal mode and seed mass (Fenner and Thompson,2005). Muller-Landau et al. (2008) found that dispersal mode explained some of the interspecific variation in seed distributions. Many studies have shown that different dis-persal agents result in different patterns of seed distribu-tion (Clark et al., 1999; Clark et al., 2005; Muller-Landau et al., 2008). In addition, seed mass explained interspecific variation in dispersal distances and seed production in many tree species in a tropical forest in Panama (Muller-
Landau et al., 2008).
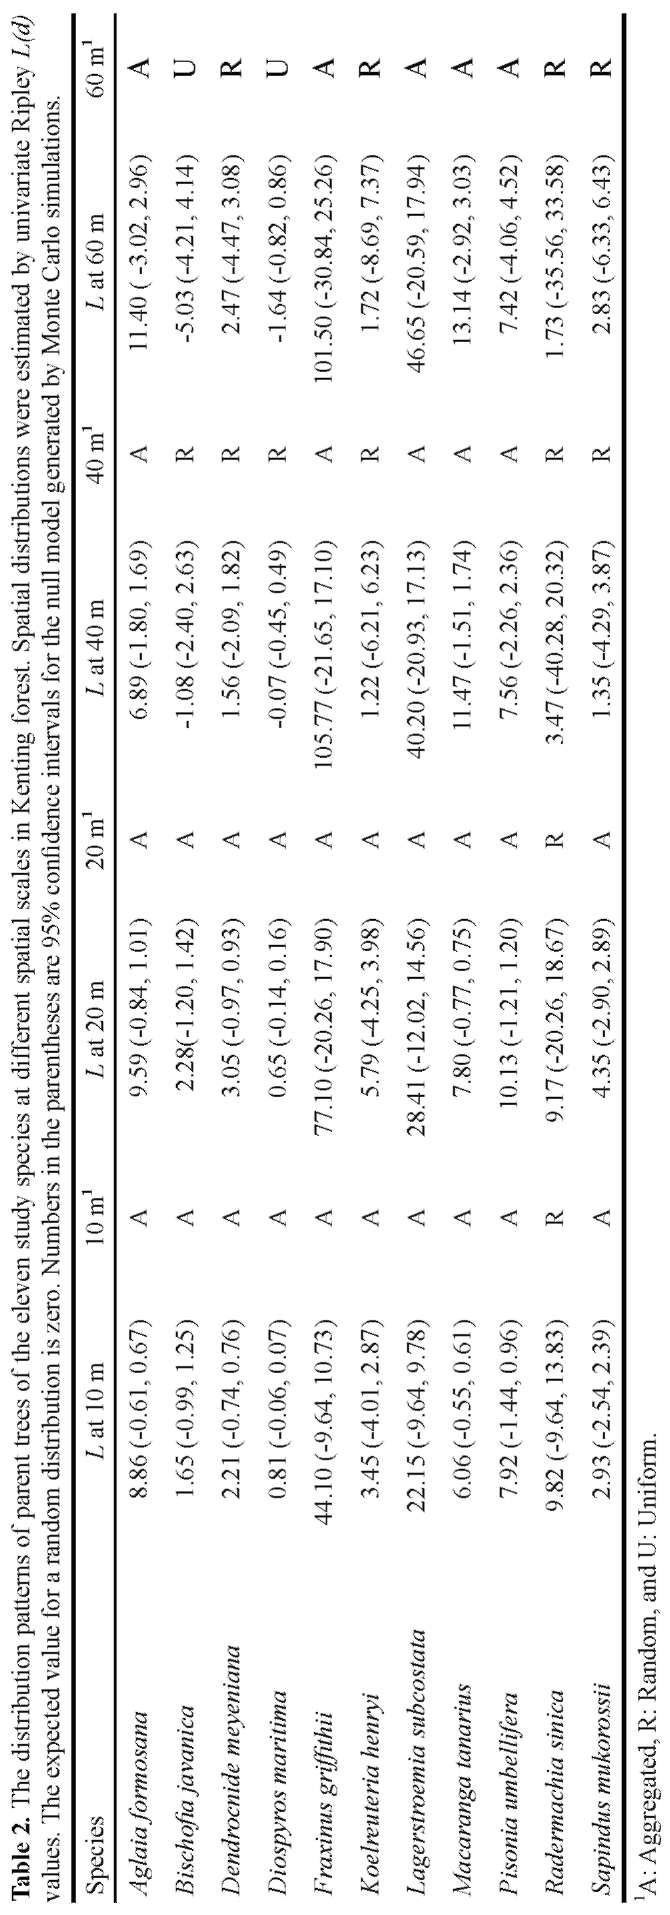
In this study, we documented, at the stand level, the seed distributions of eleven tree species in a tropical for­est in Taiwan. We investigated how seed distributions are related to parent tree distributions, topography and seed traits. We found that seeds tend to be aggregated at the stand level. Seed aggregations may arise from short dispersal distances from parent trees and reflect the local topography. Topography may influence seed distributions directly, or indirectly via the distributions of parent trees. Finally, seed mass and dispersal mode may account for most of the interspecific variability in seed distributions.
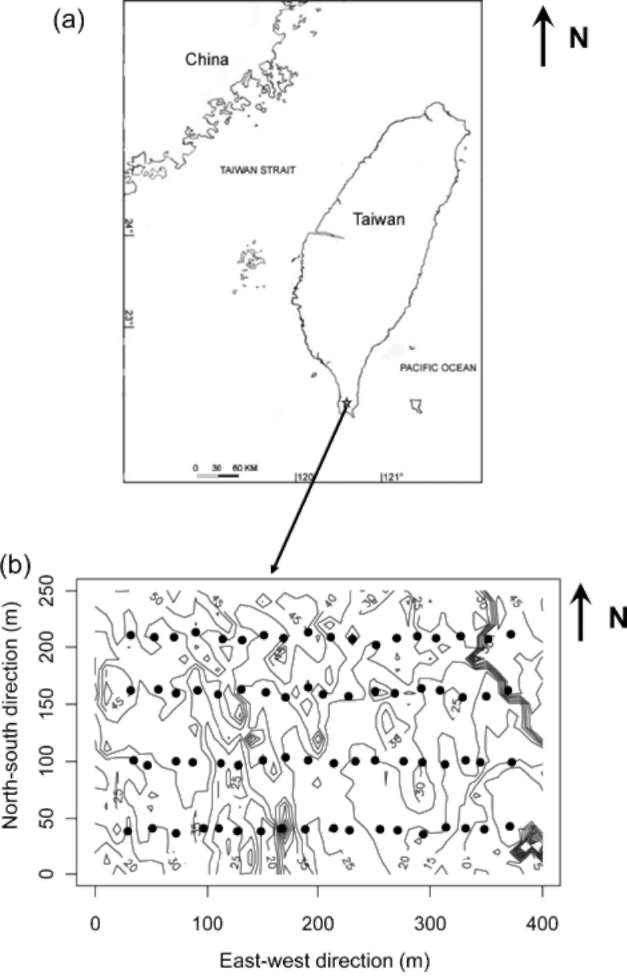
Figure 1. Map of the study site in Kenting, Taiwan. (a) The lo­cation of Kenting is marked by an asterisk. (b) Locations of seed traps within the Kenting forest dynamics plot. The black dots represent seed traps with 10 m contour lines in the background.
is especially abundant, accounting for 50.3% of the indi­viduals within the plot (Yu, 1998; Wang et al., 2004). Oth­er common species include swamp gelonium (Melanolepis multiglandulosa), autumn maple tree (Bischofiajavanica), Taiwan nato tree (Palaquium formosanum), sappan wood (Aglaia formosana), and pouteria (Pouteria obovata). The mean canopy height is about 10 m.
MATERIALS AND METHODS
Study area
This study was carried out in Kenting Elevated Coral Reef Natural Reserve on the Hengchun Peninsula (21°58' N, 120°48' E), Taiwan (Figure 1). This site is underlain by Miocene rocks and capped with an elevated coral reef (Wang et al., 2004). There is a distinct monsoon season from October to March (Wang et al., 2004). The average mean temperature is 25.1°C and average annual precipita­tion is 1963.8 mm (1977-2006). A 10 ha (400 m x 250 m) forest dynamics plot (FDP) was established in 1997 (Wang et al., 2004). The plot is dominated by woody species in the Ebenaceae and Euphorbiaceae. One hundred and ten woody species were found within the forest dynamics plot (Wang et al., 2004) Coast persimmon, Diospyros maritima,
Seed rain collection
We established four east-west transects within the 10 ha permanent plot (Figure 1). Each transect was 340 m long, starting at a point 30 m from the western edge of the plot and ending 30 m from the eastern edge. Areas within 30 m from the plot edges were excluded to avoid edge effects. The transects were 50 or 60 m apart in the south-north di­rection. The distances between transects were determined by local topographic features. Areas with extreme topo­graphic differences were avoided. A total of 72 seed traps were placed, at 20 m intervals, along the four transects (Figure 1). Locations with heavy understory vegetation or bare rock were avoided because it was difficult to set
LIN et al. — Seed distribution in a Taiwanese forest
329
up the seed traps in these areas. Seed traps were 0.5 m2 in area and were comprised of 1-mm wire-mesh screens sup­ported by PVC frames 1 m above the ground.
Reproductive parts of woody plants were collected from the seed traps weekly from August 16, 2006 to August 12, 2007. The samples from each trap were quantified, dried, weighted and identified to species. Only mature seeds were included in our analyses. Mature seeds arrived singly or within fruits. Seeds contained within mature fruits were extracted and counted. Ficus spp. were not included in the analysis due to the difficulty of counting the large number of tiny seeds. The number of seeds collected singly and in fruits was summed for further analyses. Seeds from each tree species were classified as animal- or wind-dispersed based upon fruit and seed morphology.
where x is the total number of seeds collected per trap dur­ing the study period, s2 is the variance of x, ^ x is the sum of x, and x is the mean of x. The bootstrapping procedure was used to estimate the 95% confidence intervals of both indices (Efron and Tibshirani, 1993). Individual seed traps were used as the unit for the bootstrapping procedure. The number of seeds collected from individual traps was resampled with replacement 999 times. Correspondence dispersion indices were recalculated. The 95% confidence intervals were obtained from the 2.5 and 97.5 percentiles for 999 samples plus the observed values. If both upper and lower limits of the confidence intervals for Green's dispersion index were greater than zero, Green's dispersion index was significantly different from 0. Positive values of Green's dispersion index indicated aggregation; negative values indicated a uniform distribution. These two indices were chosen because they were independent of the density of individuals and sample size (Myers, 1978). Only those tree species for which more than 100 seeds were collected during the study period, and whose seeds were collected in at least 10% of the seed traps, were included in the analy­ses.
Parent distributions. Ripley's univariate L(d) func­tions were used to determine the spatial distributions of parent trees.
Ripley's L(d) function is defined as:
Census of parent trees
All trees with a diameter at breast height (DBH) greater than 1 cm were mapped during 1997-2002 by the research team led by Wang and Sun (Wang et al., 2004). Species identity and DBH were recorded for each individual. Par­ent trees were defined as trees with a DBH greater than 5 cm because, for most species, fruits were observed on trees of this size (Y. Lin, Personal observation).
Topography
Three topographic variables, mean elevation, convex­ity, and slope of each quadrat, were included in this study (Harms et al., 2001; Valencia et al., 2004). The Kenting plot was divided into 1000, 10x10 m quadrats. We ob­tained the topographic values for the quadrat closest to the seed trap. The mean elevation of a quadrat was the mean elevation of the four corners of the quadrat. Convexity was defined as differences in mean elevation between the focal quadrat and the neighboring quadrats (Harms et al., 2001; Valencia et al., 2004). Slope was measured by the mean angular deviation from the horizontal plane of each of the four triangular planes formed by connecting the four cor­ners in groups of three.
where iK(d)is Ripley's K function (Ripley, 1976) and d is the distance between trees. Ripley's L(d) is a linearized version of Ripley's K function. Subtracting distance made the expected value zero, which would indicate a random distribution. Monte Carlo simulations, based upon a ho­mogenous Poisson process, were used to create confidence intervals for the random distributions (Ripley, 1976; Besag and Diggle, 1977). Values of L(d) greater than the up­per limit of the confidence interval indicated trees were aggregated. Trees were uniformly distributed when IJ(d) was less than the lower limit of the confidence interval. Values within the confidence interval indicated trees were randomly distributed. Statistical analyses were performed with R Package Spatsat (Baddeley and Turner, 2005) in the R environment version 2.12.1 (R Development Core Team, 2010).
Factors associated with seed distributions. The
relationships between seed and parent abundances and topographic factors were evaluated with generalized ad­ditive mixed models (GAMM). The dependent variable is the number of seeds per seed trap collected during the study period. The independent variables included the basal area of parent trees, mean elevation, convexity, and the slope of the nearest 10 x 10 quadrat. Both quadratic and linear relationships between seed and parent abundances were explored. Poisson distributions were chosen for the error structure. In addition, the relationship between parent
Data analysis
Seed distributions. Seed distribution was evaluated by two indices of dispersion, standardized Morisita's in­dex (Morisita, 1962; Smith-Gill, 1975; Krebs, 1999) and Green's dispersion index (Green, 1966). The standardized Morisita's index was modified from Morisita's index of dispersion (Morisita, 1962) with a range from -1 to +1 and confidence intervals between -0.5 and 0.5. If the stan國 dardized Morisita's index was between -0.5 and +0.5, the seeds were randomly distributed. Values greater than 0.5 indicated seeds were aggregated, and values less than -0.5 indicated seeds were uniformly distributed.
Green's dispersion index was defined by the formula:
330
Botanical Studies, Vol. 52, 2011
abundance and topography were analyzed with GAMM. GAMMs were performed by R Package Mgcv in the R environment version 2.12.1 (R Development Core Team,
2010).
Seed distributions and seed traits. The effects of dispersal mode and seed mass on seed distribution were examined using nonparametric methods. The Green's dispersion indices of animal- and wind-dispersed species were compared using the Mann-Whitney U test. Green's dispersion index was correlated with average seed mass using Spearman's rank correlation.
RESULTS
During this study period, we collected 16745 seeds of 27, non-liana, woody species. The following analyses only include the 11 tree species that had more than 100 seeds collected in at least 10% of the seed traps during the study period.
Seed distributions
Seeds of all eleven species were aggregated at the stand-level. Seeds of most species only reached a small portion of the seed traps (Table 1, Figure 2a-f). The pro­portion of traps receiving seeds of a given species ranged from 0.14 to 0.75 (Table 1). For all species, both the mean and confidence interval for Morisita's index were greater than 0.5, indicating the seeds of all species were aggre­gated (Table 1). Calculations of Green's dispersion index yielded the same results. Green's dispersion index was significantly different from zero for each species (Table 1). Seeds collected from the seed traps either came singly or were contained within intact fruits. The proportion of seeds originating from intact fruits varied greatly among species, and ranged from 0 to 0.98 for species with a mean seed-to-fruit greater than 1 (Table 1).
Using six species as examples, the distribution maps of the six species clearly show that seeds of tree species were unevenly distributed among the seed traps (Figure 2a-f). Seeds of different species reached different parts of the plot (Figure 2a-f).
Parent distributions
Parent trees of all study species were aggregated at a variety of spatial scales, except for Radermachia sinica (Table 2, Figure 2g-l). Five species, including Aglaia for-mosana, Fraxinus griffithii, Lagerstroemia subcostata, Macaranga tanarius, and Pisonia umbellifera were ag­gregated at all scales except for distances shorter than 2.5 m (Table 2, Figure 2i-k). The other three species, Den-drocnide meyeniana, Koelreuteria henryi, and Sapindus mukorossii were aggregated at small spatial scales, but randomly distributed at large scales (Table 2, Figure 2g). Finally, Bischofia javanica and Diosppyros maritima exhib­ited aggregated, random, and then uniform distributions as distance increased (Table 2, Figure 2h).
LIN et al. — Seed distribution in a Taiwanese forest
331
Figure 2. Spatial information for six tree species in the Kenting plot, August 2006 to August 2007. The first six panels (a-f) are three dimensional scatter plots of the number of seeds collected at given locations within the plot. The second set of panels (g-l) shows the spatial distribution of adult trees estimated with univariate Ripley's L(d). The final six panels (m-r) show the relationship between seed abundance and the basal area of adult trees in a 20 x 20 m quadrat (m-r). n: the total number of seeds of the species collected during the study period, CI: confidence intervals.
332
Botanical Studies, Vol. 52, 2011
Factors associated with seed distributions
The seed abundance was significantly correlated with parent abundance and topographic factors in the Kenting forest. The results of GAMM models showed that seed abundance was significantly correlated with the basal area of parent trees in eight of the eleven species (Table 3, Figure 2m-r). The relationships between seed and parent abundance could be either quadratic or linear. Among the models, significant quadratic relationships were detected in four species, Aglaia formosana, Lagerstroemia sub-costata, Pisonia umbellifera, Radermachia sinica, while significant linear relationships were found in six species (Table 3). In addition to parent abundance, the seed distri­bution was significantly associated with at least one of the three topographic variables, convexity, slope, and eleva­tion, for all species (Table 3). In contrast, there were fewer significant relationships between parent abundance and three topographic variables (Table 4).
Seed distributions and dispersal traits
The distributions of wind and animal dispersed seeds, as characterized by Green's dispersion index, were not significantly different (Mann-Whitney U test, U= 22, p = 0.16, Figure 3). Results of Spearman's rank correlations indicated that Green's dispersion index was negatively correlated with seed mass, but the relationship was not sta­tistically significant (Rho = -0.17, p = 0.63).
DISCUSSION
We found that the seeds of the eleven tree species in­cluded in this study were aggregated in the Kenting For­est Dynamics Plot. Such aggregations were significantly associated with parent distributions and local topography. The patterns of seed distributions, however, did not reflect habitat preference of parent trees or seed traits.
Our findings are consistent with those of other empiri­cal studies of seed distributions, which also found that seeds were highly aggregated (Houle, 1994; McEuen and Curran, 2007). In these studies, seed aggregation was at­tributed to the limited distribution of source trees and limited seed dispersal (Clark et al., 1998; McEuen and Curran, 2007). In the Kenting forest, dispersal limitation may be even more severe than the previous studies due to its unique topographic features. The Kenting forest was highly heterogeneous in its topography (Wang et al., 2004; Liao et al., 2006). Limestone from elevated coral reefs is widely distributed across the landscape and abrupt topo­graphic changes occur over short distances (Figure 1). The environmental conditions differed considerably between the top of limestone outcroppings and the valleys. In some areas, an elevation change of more than 10 meters could occur over a horizontal distance of only 5 m. The elevated coral reefs could serve as barriers to seed dispersal. The crowns of trees growing in the valleys were almost as high as the elevated coral reefs (Lin unpublished data). As a result, seeds that disperse from the lower portions of
LIN et al. — Seed distribution in a Taiwanese forest
333
Table 3. Results of the generalized additive mixed models (GAMM), which evaluated the relationships between seed abundance and four factors. Values in the table are x2. Parent abundance was estimated by the basal area of parent trees within the nearest 10 x 10 quadrat of each seed trap.

Species

Parent2,a

Parent

Convexity

Slope

Elevation

Aglaia formosana

59.14*,b

0.11

29.84*

49.13*

28.47*
Bischofia javanica
0.03
696.55*
421.31*
295.94*
595.70*
Dendrocnide meyeniana
0.04
332.07*
219.80*
492.84*
481.85*
Diospyros maritima
1.51
0.04
1.38
20.53*
18.95*
Fraxinus griffithii
0.03
33.93*
1.52
63.73*
11.17*
Koelreuteria henryi
0.10
26.89*
0.52
54.18*
2.32
Lagerstroemia subcostata
122.50*
< 0.01
7.97
84.39*
169.83*
Macaranga tanarius
0.60
3.14
157.55*
34.84*
94.97*
Pisonia umbellifera
21.71*
21.63*
24.56*
25.52*
23.03*
Radermachia sinica
7.89*
13.11*
715.80*
1099.20*
516.40*
Sapindus mukorossii
0.40
0.98
28.92*
3.10
29.64*

aParent2 refers to a quadratic term. b*P < 0.05.
Table 4. Results of the generalized additive mixed models (GAMM) showing the relationship between parent abundance and three topographic factors. Values in the table are F statis­tics. Parent abundance was estimated by the basal area of par­ent trees within the nearest 10 x 10 quadrat of each seed trap.

Species

Convexity

Slope

Elevation

Aglaia formosana

4.03*

0.01

2.50
Bischofia javanica
0.45
< 0.01
0.12
Dendrocnide meyeniana
0.02
0.12
0.31
Diospyros maritima
0.03
0.76
0.22
Fraxinus griffithii
0.96
2.96*
1.67
Koelreuteria henryi
0.03
0.02
1.92
Lagerstroemia subcostata
0.51
5.94*
0.12
Macaranga tanarius
1.17
0.30
5.60*
Pisonia umbellifera
11.36*
1.27
6.77*
Radermachia sinica
1.37
3.31
3.10
Sapindus mukorossii
0.33
0.05
0.19
Figure 3. The relationship between the seed mass and Green's dispersion index in the Kenting plot, August 2006 to August 2007.

*P <0.05.
tree canopies might not be able to cross the elevated coral reefs and will be deposited over a very limited area. Our GAMM models also indicated strong relationships be­tween seed distributions and topographic variables.
Seed aggregations may be further enhanced by the ag­gregations of parent trees. This aggregation in parent trees, however, was not significantly associated with topography in most study species in our GAMM models. Such results suggested that the aggregations of parent trees could be generated by dispersal limitation (Lin et al., 2011). Fur­thermore, in the Kenting forest, the relative abundance of tree species was highly uneven due to an overwhelmingly dominant species, Diospyros maritime (Yu, 1998; Wang
et al., 2004). As a consequence, the density of most other species of parent trees was low. The low density of parent trees may have enhanced the limitation in seed sources in Kenting forest more than occurs in temperate forests (Houle, 1994; McEuen and Curran, 2007).
Surprisingly, neither seed mass nor dispersal mode were good predictors of seed distribution. There are two rea­sons dispersal mode might not have been a good predictor. First, seed dispersal is a complicated process involving a series of stages, including seed production, pre-dispersal predation and seed movement (Nathan and Muller-Landau, 2000). In most stages, there is high intra- and interspe­cific variation (Nathan and Muller-Landau, 2000; Muller-
334
Botanical Studies, Vol. 52, 2011
Landau et al., 2008). It was difficult to use a single mode to categorize dispersal. Second, in many studies, including ours, seeds were collected with seed traps. Most of the animal dispersed seeds were collected in seed traps before being eaten by animals (Clark et al., 1998; Muller-Landau et al., 2008). Therefore, dispersal distances may have been underestimated.
In this study, other factors could obscure differences in seed dispersal by different dispersal modes. Wind dis­persal could be impeded by the complicated landscape at the study site. Studies of wind profiles demonstrated that turbulence was generated as air traveled over different surfaces (McNaughton, 1989; Kruijt et al., 1995). Areas of turbulence can rise to ten times the height of the trees over which the wind is flowing (McNaughton, 1989; Kruijt et al., 1995). Severe turbulence could occur as winds blow over the abrupt, rocky outcroppings at our study site. In the forest dynamics plot, the landscape could enhance or diminish wind dispersal of seeds in unpredictable ways.
Several species of animals, including Taiwanese ma­caques (Macaca cyclopis), red-bellied tree squirrels (Cal-losciurus erythraeus) and Muller's Barbets (Megalaima oorti), forage actively in Kenting forest and likely disperse seeds. Taiwanese macaques eat the fruits or seeds of many tree species and were observed eating fruits of Bischofia javanica and Diospyros maritima at the study site (Yang, 2003). We regularly found Taiwanese macaque feces con­taining tree seeds in our seed traps (Lin and Lin, unpub­lished data). Taiwanese macaques could greatly influence seed distributions at larger spatial scales. Their impact on overall seed distributions needs to be studied thoroughly.
Although our study lasted only one year, we think it ac­curately characterized seed distributions in Kenting forest for three reasons. First, seed production was fairly stable. Although there is annual variation in seed production, there were no general flowering or masting events in this forest (Wang, unpublished data). Therefore, seed distribu­tion would not be distorted by sudden, great quantities of seeds. Second, this study covered a period with relatively high seed production (Wang, unpublished data). Our con­clusion that seeds were aggregated would likely hold in years with lower seed production because seeds should be more aggregated and source limited when seed abundance is low. Third, the distributions of seeds in our traps mir­rored, for the most part, seed dispersal of the year since seed bank species in this study site were limited (Wang et
al., 1997).
What are the consequences of aggregated seeds on for­est dynamics? Aggregations of seeds increase seed density at small spatial scales and might increase the likelihood of density-dependent mortality during the seed and seedling stages. Density-dependent mortality of seeds and seedlings has been observed in many forests (Harms et al., 2000). A study found that seedlings of some species are randomly distributed despite their aggregation at the seed stage in the Kenting forest (Shao, 2007). Such results suggested the occurrence of density-dependent mortality during the
early seedling stage in the Kenting forest.
In conclusion, we found that seeds were aggregated in this tropical forest in Taiwan. These aggregations were likely a product of the topography and the distribution of parent plants. Aggregated seeds and seedlings are likely to suffer density-dependent mortality, which and could pro­foundly influence subsequent seedling dynamics.
Acknowledgements. We thank Ms. S. Wu and Ms.
H. Ting for plant identification and students of Tung-hai University and the staff at the Heng-Chun Research Center, Taiwan Forestry Institute for parent tree census. The authors also thanked Dr. Masakado Kawata and two anonymous reviewers for their constructive comments on early drafts. This research was supported by grants to Y. L. from the National Science Council, Taiwan (NSC95-2313-B-037-002) and the Kaohsiung Medical University (Q096020).
LITERATURE CITED
Augspurger, C.K. 1984. Seedling survival of tropical tree spe­cies: Interactions of dispersal distance, light-gaps, and pathogens. Ecology 65: 1705-1712.
Augspurger, C.K. and K. Kitajima. 1992. Experimental studies of seedling recruitment from contrasting seed distributions. Ecology 73: 1270-1284.
Baddeley, A. and R. Turner. 2005. Spatstat: An R package for analyzing spatial point patterns. J. Stat. 12: 1-42.
Besag, J. and P.J. Diggle. 1977. Simple Monte Carlo tests for spatial pattern. Appl. Stat. 26: 327-333.
Cintra, R. 1997. A test of the Janzen-Connell model with two common tree species in Amazonian forest. J. Trop. Ecol.
13: 641-658.
Clark, C.J., J.R. Poulsen, B.M. Bolker, E.F. Connor, and V.T.
Parker. 2005. Comparative seed shadows of bird-, monkey-, and wind-dispersed trees. Ecology 86: 2684-2694.
Clark, D.A. and D.B. Clark. 1984. Spacing dynamics of a tropi­cal rain forest tree: Evaluation of the Janzen-Connell model.
Am. Nat. 124: 769-788. Clark, J. S., E. Macklin, and L.Wood. 1998. Stages and spatial
scales of recruitment limitation in southern Appalachian
forests. Ecol. Monogr. 68: 213-235. Clark, J.S., M. Silman, R.Kern, E. Macklin, and J. Hille Ris
Lambers. 1999. Seed dispersal near and far: Patterns across temperate and tropical forests. Ecology 80: 1475-1494.
Condit, R., P.S. Ashton, P. Baker, S. Bunyavejchewin, S. Guna-
tilleke, N. Gunatilleke, S.P. Hubbell, R.B. Foster, A. Itoh,
J.V. LaFrankie, H.S. Lee, E. Losos, N. Manokaran, R. Suku-mar, and T. Yamakura. 2000. Spatial patterns in the distribu­tion of tropical tree species. Science 288: 1414-1418.
Dalling, J.W., H.C. Muller-Landau, S.J. Wright, and S.P. Hub-
bell. 2002. Role of dispersal in the recruitment limitation of neotropical pioneer species. J. Ecol. 90: 714-727.
LIN et al. — Seed distribution in a Taiwanese forest
335
Efron, B. and R.J. Tibshirani. 1993. An Introduction to the Boot­strap. Chapman and Hall, New York.
Fenner, M. and K. Thompson. 2005. The Ecology of Seeds. Cambridge University Press, Cambridge.
Green, R.H. 1966. Measurement of non-randomness in spatial distributions. Res. Pop. Ecol. 12: 249-251.
Harms, K.E., R. Condit, S.P. Hubbell, and R.B. Foster. 2001.
Habitat associations of trees and shrubs in a 50-ha neotropi­cal forest plot. J. Ecol. 89: 947-959.
Harms, K.E., S.J. Wright, O. Calderon, A. Hernandez, and E.A. Herre. 2000. Pervasive density-dependent recruitment en­hances seedling diversity in a tropical forest. Nature 404:493-495.
Houle, G. 1994. Spatiotemporal patterns in the components of regeneration of four sympatric tree species - Acer rubrum, A. saccharum, Betula alleghaniensis and Fagus grandifolia.
J. Ecol. 82: 39-53.
Iida, S. and T. Nakashizuka. 2004. Spatial and temporal dispersal of Kalopanax pictus seeds in a temperate deciduous forest,central Japan. Plant Ecol. 135: 243-248.
Jansen, P.A., F. Bongers, and P.J. van der Meer. 2007. Is farther seed dispersal better? Spatial patterns of offspring mortality in three rainforest tree species with different dispersal abili­ties. Ecography 31: 43-52.
Krebs, C.J. 1999. Ecological Methodology, Second edition. Ben­jamin Cummings, Menlo Park.
Kruijt, B., W. Klaassen, and R.W.A. Hutjes. 1995. Edge effects on diffusivity in the roughness layer over a forest. In M. P. Coutts and J. Grace (eds.), Wind and trees. Cambridge Uni­versity Press, Cambridge, pp 60-70.
Levin, S.A., H.C. Muller-Landau, R. Nathan, and J. Chave. 2003. The ecology and evolution of seed dispersal: A theo­retical perspective. Annu. Rev. Ecol. Evol. Syst. 34: 575­604.
Levine, J.M. and D.J. Murrell. 2003. The community-level con­sequences of seed dispersal patterns. Annu. Rev. Ecol. Evol.Syst. 34: 549-574.
Liao, J.-H., H.-H.Wang, C.-C. Tsai, and Z.-Y. Hseu. 2006. Litter production, decomposition and nutrient return of uplifted coral reef tropical forest. For. Ecol. Manag. 235: 174-185.
Lin,Y.-C., L.-W. Chang, K.-C. Yang, H.-H. Wang, and I.-F. Sun.
2011. Point patterns of tree distribution determined by habi­tat heterogeneity and dispersal limitation. Oecologia 165:175-184.
McEuen, A.B. and L.M. Curran. 2007. Seed dispersal and re­cruitment limitation across spatial scales in temperate forest fragments. Ecology 85: 507-518.
McNaughton, K.G. 1989. Micrometeorology of shelter belts and forest edges. Philos. Trans. R. Soc. London Ser. B. 324: 351-368.
Morisita, M. 1962. Id-index, a measure of dispersion of individu­als. Res. Pop. Ecol. 4: 1-7.
Muller-Landau, H.C. and B.D. Hardesty. 2005. Seed dispersal of woody plants in tropical forests: Concepts, examples, and
future directions. In D. Burslem, M. Pinard, and S. Hartley (eds.), Biotic interactions in the tropics. Cambridge Univer­sity Press, Cambridge, pp 267-309.
Muller-Landau, H.C., S.J. Wright, O. Calderon, R. Condit, and S.P. Hubbell. 2008. Interspecific variation in primary seed dispersal in a tropical forest. J. Ecol. 96: 653-667.
Myers, J.H. 1978. Selecting a measure of dispersion. Environ.
Entomol. 7: 619-921.
Nathan, R. and H.C. Muller-Landau. 2000. Spatial patterns of seed dispersal, their determinants and consequences for re­cruitment. Trends Ecol. Evol. 15: 278-285.
R Development Core Team. 2010. R: A Language and Environ­ment for Statistical Computing. R Foundation for Statistical Computing, Vienna.
Ripley, B.D. 1976. The second-order analysis of stationary point processes. J. Appl. Prob. 13: 255-266.
Schurr, F.M., O. Steinitz, and R. Nathan. 2008. Plant fecundity
and seed dispersal in spatially heterogeneous environments: models, mechanisms and estimation. J. Ecol. 96: 628-641.
Seidler, T.G. and J.B. Plotkin. 2006. Seed dispersal and spatial pattern in tropical trees. PLoS Biol. 4: e344.
Shao, R. 2007. Spatial Distributions and Microhabitat Preference of Tree Seedlings in a Tropical Forest in Kenting. Kaohsi-ung Medical University, Kaohsiung.
Smith-Gill, S.J. 1975. Cytophysiological basis of disruptive pig­mentary patterns in the leopard frog Rana pipiens. II. Wild type and mutant cell specific patterns. J. Morphol. 146: 35­54.
Sork, V.L. 1984. Examination of seed dispersal and survival in red oak, Quercus rubra (Fagaceae), using metal-tagged acorns. Ecology 65: 1020-1022.
Svenning, J.C. and S.J. Wright. 2005. Seed limitation in a Pana­manian forest. J. Ecol. 93: 853-862.
Valencia, R., R.B. Foster, G. Villa, R. Condit, J.C. Svenning, C.
Hernandez, K. Romoleroux, E. Losos, E. Magard, and H. Balslev. 2004. Tree species distributions and local habitat variation in the Amazon: large forest plot in eastern Ecua­dor. J. Ecol. 92: 214-229.
Wang, H.-H., Y.-L. Kuo, and S.-Y. Pan. 1997. Effects of canopy
opening on seed germination among twenty species of up­lifted coral-reef forest trees at Kenting, Taiwan. Taiwan J.For. Sci. 13: 299-307.
Wang, H.-H., I.-F. Sun, C.-T. Chien, F.-J. Pan, C.-F. Kuo, M.-H. Yu, H.-L. Ku, S.-H. Wu, Y.-P. Cheng, S.-Y. Chen, and Y.-C.
Kao. 2004. Tree species composition and habitat types of a karst forest in Kenting, Southern Taiwan. Taiwan J. For. Sci.19: 323-325.
Yang, T. 2003. Ranging behaviour of Formosan macaque (Maca-ca cyclopis) in Heng-Chun, southern Taiwan. Master's the­sis, National Dong Hwa University, Hualien.
Yu, M.H. 1998. Floristic composition and structure of the Kent-ing high coral reef forest. Master's thesis, Tunghai Univer­sity, Taichung.
336
Botanical Studies, Vol. 52, 2011
臺灣熱帶森林11種木本植物之種子空間分布
林宜靜1 林佩蓉2 相華3 孫義方2
1東海大學生命科學系
2太魯閣國家公園
3行政院農業委員會林業試驗所林業試驗所生物組
樹木於種子階段的空間分布,代表一個樹木族群的啟始空間分布。此啟始空間分布將決定族群內
個體的空間關係,影響個體之互動,進而對於森林的長期動態,造成深遠的影響。本研究評估墾丁高位
珊瑚礁森林內,11種木本植物種子之空間分布,並探討影響種子空間分布的因子。本研究於墾丁高位
珊瑚礁森林自然保留區內進行,在10公頃之永久樣區(250 x 400 m)內設立四條穿越線,於每條穿越
線,每隔20公尺,設立種子網一個,共72個。20068月至2007年八月間,每週調查一次,收集
網內所有徑長超過1 mm之花、果實與種子,於實驗室內鑑定種類、計量與秤重。種子之空間分布由標
準莫氏指婁戈(standardized Morisita's index)與格林係數(Green's dispersion of index)估計。結果顯示,
所有物種的種子均呈現聚集分布。根據Ripley L函數,11個物種之母樹,有10種在特定空間尺度下呈
現聚集分布。廣義加成混合模式之分析結果顯示,種子的聚集分布受地形與母樹分布的影響。大部份
物種之種子空間分布與母樹的數量、樣區之海拔、地形凹凸度與坡度呈現顯著相關。然而,種子之分布
卻無法由母樹的棲地好或種子的特性來解釋。本研究所呈現的種子聚集現象,可能增加種子受密度制
約死亡的影響,進而影響後續的小苗動態。
關鍵詞:森林動態;廣義加成混合模式;種子傳播;種子分布。