Botanical Studies (2011) 52: 393-405.
MOLECULAR BIOLOGY
Authentication of domestic Taiwan rice varieties based on fingerprinting analysis of microsatellite DNA markers
Hsue-Yu CHUANG, Huu-Shen LUR, Kae-Kang HWU, and Men-Chi CHANG*
(Received June 22, 2010; Accepted March 2, 2011)
ABSTRACT. Microsatellite marker (SSR) analysis was used to differentiate between domestic Taiwan rice varieties and foreign rice cultivars for authentication and traceability. A panel of 32 microsatellite DNA mark­ers and 36 rice varieties from different countries were used for comparative polymorphism analysis. A total of 306 alleles were observed in 32 loci. The number of alleles per locus ranged from 3 to 21, with an average of 9.6. Polymorphic information content (PIC) values varied from 0.205 (RM7023) to 0.926 (RM333), with an average of 0.75. The most useful markers identified for efficient differentiation of domestic Taiwan rice iden-tities were RM21, RM22, RM101, RM333, RM475, RM1387, RM5704, and RM7545. Principle component analysis (PCA) score plot and clustering analysis were sufficient to discriminate between two different groups of rice varieties based on geographic origins. To prevent fraudulent commercial activity, these results provide effective SSR marker sets and workflow for regular genotype verification and premium rice variety purity monitoring in Taiwan. Finally, to ensure the practical use of DNA fingerprinting technology in rice adultera-tion tests, sensitivity as low as 3 to 7.5 % can be detected by mixing different ratios of Taikeng 9 and Taikeng 16.
Keywords: DNA fingerprinting analysis; Microsatellite markers; Polymorphism; Principle component analysis (PCA); Rice; Simple sequence repeat (SSR).
INTRODUCTION
Thailand jasmine rice and to meet legal requirements, a standard authentication protocol for jasmine rice was de­veloped (Wu et al., 2009). Furthermore, with the trend of trade liberation and globalization, Taiwan became a mem­ber of WTO in 2001, allowing a minimum market access quota of 144,720 tons rice importation. In 2004, Taiwan rice started being to be exported to Japan, the first time in 30 years (Huang, 2001). Imported rice usually has a lower price than domestic rice; therefore, mixing domestic rice with imported rice can earn extra profit. The industry was challenged to develop a valid and rapid rice forensics tech­nique to identify domestic Taiwan rice. Issues including consumer rights protection, ensuring fair competition and market assessment for rice production and for the food in­dustry will soon become critically important (Woolfe and Primrose, 2004).
Over the past decade, morphological characteristics such as height, grain shape, size, etc. were used in rice variety identification. Other biochemical or physiological factors such as starch composition, lipids, seed storage proteins, and alloenzymes were also used to characterize different rice varieties. However, the above parameters are not inherently stable and are easily affected by growth conditions and environment. Recently, DNA profiles based on various molecular markers have been widely applied across different fields (Popping, 2002; Terzi et al., 2005;
Rice is one of the world's staple food crops. More than 90% of the population of Asia considers rice their main calorie source. Owing to world population growth, there is a tremendous increase in the demand for rice. The price for rice is not homogenous in the international rice mar­kets due to its variability in quality, variety and process­ing. To comply with different standards, most rice seed dealers, farmers, millers, food processors and consumers are highly concerned about the authenticity of their rice for its uniformity and quality (Vlachos and Arvanitoy-annis, 2009). Thus, it is essential for industry to have a successful strategy to verify rice variety labeling and com­position, in other words, its traceability and authenticity. For example, billions of dollar's worth of basmati rice is exported to Europe from India and Pakistan every year. However, by counterfeiting brand names and by deliber­ately fraudulent labeling, regular-quality rice can be sold as premium-priced basmati rice in order to make profits (Vemireddy et al., 2007; Steele et al., 2008; Colyer et al., 2009). China has recently become the largest importer of

*Corresponding author: E-mail: menchi@ntu.edu.tw; Tel: +886-2-33664771; Fax: +886-2-23620879.
394
Botanical Studies, Vol. 52, 2011
Primrose et al., 2010). These markers include restric­tion fragment length polymorphism (RFLP) (Botstein et al., 1980), random amplified polymorphic DNA (RAPD) (Williams et al., 1990), amplified fragment length poly­morphism (AFLP) (Vos et al., 1995), sequence character­ized amplify region (SCAR) (Zhang and Stommel, 2001), microsatellite or simple sequence repeat (SSR) (Tautz, 1989; Chen et al., 1997; McCouch et al., 2002), and single nucleotide polymorphism (SNP) (Hour et al., 2007; Ga-nal et al., 2009). Among them, SSR markers have several advantages, their co-dominant, stable, and highly poly-morphic characteristics have been used intensively for rice cultivar identification (Pal et al., 2004; Singh et al., 2004; Pessoa-Filho et al., 2007; Vemireddy et al., 2007; Bonow et al., 2009; Cirillo et al., 2009; Rahman et al., 2009), ge-netic diversity evaluation and phylogenetic comparison (Hashimoto et al., 2004; Bajracharya et al., 2006; Giarroc-co et al., 2007; Jayamani et al., 2007; Pervaiz et al., 2009; Yuan et al., 2007), germplasm maintenance (Jain et al., 2004; Xu et al., 2004; Lu et al., 2005; Thomposon et al., 2007; Ebana et al., 2008; Agrama et al., 2009), and marker assisted selection. Traditionally, for a small to intermediate laboratory, SSR analyses are done with agarose or poly-acrylamide gel electrophoresis. However, routine DNA fin-gerprinting with large numbers of SSR can be tedious and time consuming, especially when attempting to score cor-rect allele sizes. A capillary gel electrophoresis system, the QIAxcel system-GT12TM genetic analyzer, which replaces traditional, labor-intensive DNA gel analysis, can now be used for fast, accurate, cost-effective and regularly large-scale SSR analysis, gene mapping and population genetic studies (Vemireddy et al., 2007; Archak et al., 2009; Wang et al., 2009).
In Taiwan, rice cultivation covers about 260 thousand acres. From 2005 to 2007, the most popular premium vari­eties among 30 currently planted commercial Japonica rice varieties, were Tainan 11 (39%), Taikeng 14 (10.8%) and Taikeng 8 (8.3%) (Statistic data from COA, httpwww. coa.gov.tw/view.php?catid= 17817&print= 1). In the past, the introduction of elite germplasm from Japan varieties, such as Sinriki and Kameji, contributed more than 66% of the parentage of Japonica varieties released in Taiwan (Lin, 1991). Through pedigree analysis, Lin (1991) showed that between 1940 and 1987, the 99 Japonica rice varieties released in Taiwan were traceable to 65 ancestors. Among these ancestors, only 11 were from Taiwan, 44 were plant introductions from Japan. Chen et al. (2008) established a Taiwan rice pedigree database (http://ricebreeding. agron.ntu.edu.tw) containing 124 Japonica and 19 Indica varieties or breeding lines developed between 1981 and 1997. Due to the involvement of Japanese introductions in variety improvement, we noticed a narrow genetic base for the Japonica rice varieties, especially for the premium varieties (Taichung 65, Koshihikari or Tainung 67), in Tai­wan (Chen et al., 2008). Japan cultivars such as Hokuriku 100, Koshihikari and Kinuhikari continue to be used for breeding parental lines to improve the taste quality of Tai­wan Japonica rice varieties (Tainung 71, Hualian 20 and
Kaohsiung 145) (Wu and Lin, 2008). Cultivars Hokuriku 100 and Kinuhikari have been used directly as backbone parents to breed Taikeng 9 and Tainung 71, respectively. However, in Japan, Hokuriku 100 and Kinuhikari are ge­netically closed rice varieties (Hsieh et al., 2007; Chen et al., 2008). It is thus difficult to distinguish the genetic diversity and individual genotypes of domestic Taiwan rice varieties based on traditional agro-morphological traits or isoenzyme analysis. For this purpose, a promis­ing and effective advanced DNA-based marker set, such as SSR with high polymorphism, is absolutely crucial. Meanwhile, with the rice market opening up, Taiwan has begun to import rice from various countries, including the U.S.A, Japan, Australia, Thailand, Egypt, and Vietnam. It is difficult to differentiate between imported and domestic Taiwan rice based on appearance. Hence, this study was aimed at screening and selecting compatible polymorphic microsatellite DNA markers with 36 rice cultivars from different countries according to their allelic diversity and genetic relatedness. To do so, we used the QIAxcel mul-ticapillary electrophoresis gel system. Our final goal is to develop a low-cost, accurate, sensitive and effective DNA fingerprinting method to authenticate domestic Taiwan rice from foreign varieties using SSR markers.
MATERIALS AND METHODS
Plant materials
In total, a collection of 36 rice (Oryza sativa L.) ac­cessions were used for microsatellite analysis as listed in Table 1. Twenty three of these were Taiwan rice cul-tivars from germplasm of TARI (Taiwan Rice Research Institute), the others from separate agricultural research stations. Three commercial American rice varieties were kindly provided by the U.S. Rice Association. Three Japan varieties and six Thai varieties were obtained from the Council of Agriculture in Taiwan. A single sample, Sun-White from Australia, was purchased from Taiwan market.
Genomic DNA extraction
Total genomic DNA was extracted from a bulk of 10 rice grains, randomly selected from each rice cultivar us­ing the CTAB/PTB method (Bernardo et al., 2005). Rice seeds were ground into powder with liquid nitrogen in a mortar. 750 fiL of extraction buffer (1% CTAB, 0.02 M EDTA, 1.4 M NaCl and 0.01 M Tns-HCl (pH = 8.0)) was then added and the mixture was incubated at 65°C for 20 min. For protein digestion, 10 [iL proteinase K (20 mg/ml) was added and reacted at 65。C for another 30 min. After phenol/chloroform extraction, genomic DNA was precipi-tated with 2/3 volume of isopropanol. The DNA pellet was washed with 70% EtOH and dissolved in 200 [iL of 1X TE buffer (pH = 8.0). After RNase digestion to eliminate RNA residues, the genomic DNA was precipitated with ethanol and dissolved in TE buffer. The concentration of DNA was quantified using Biophotometer (Eppendorff) and then di-luted 100X as stock for use in the following PCR reaction.
CHUANG et al. ― Fingerprinting analysis of rice by SSR
395
Table 1. List of rice varieties used in rice authentication study.

Country of origin

Total numbers

Cultivar name

Taiwan

23

Japonica: TaiKeng 2 (TK 2), TaiKeng 4 (TK 4), TaiKeng 5 (TK 5), TaiKeng 6 (TK 6), Tai-Keng 8 (TK 8), TaiKeng 9 (TK 9), TaiKeng 11 (TK 11), TaiKeng 12 (TK 12), TaiKeng 14 (TK 14), TaiKeng 16 (TK 16), Tainung 67 (TNG 67), Tainung 71 (TNG 71), Kaohsiung 139 (KH 139), Kaohsiung 145 (KH 145), Tainan 11 (TN 11), Taichung 191 (TC 191), Taoyuan 3 (TY 3), Taitung 30 (TD 30), Hualian 19 (HL 19)
Indica: Taichung Sen 2 (TS 2), Taichung Sen 10 (TCS 10), Tainung 1 (TN 1), Tainung Sen22
(TNS 22)
Thailand
6
Indica: Jasmine 85 (J 85), Pathumithani (Path), Hom Mali (Hom), 17032, 17050, KDML
Japan
3
Japonica: Koshihikari (Koshi), Koshiibuki (Ibuki), Akitakomachi (Akita)
USA
3
Japonica: M 202, M 401
Indica: Southern Long Grain (SL)
Australia
1
Japonica: SunWhite (Sun)

Microsatellite markers and PCR amplification
Thirty-two microsatellite primer pairs were used for rice variety discrimination in this study (Table 2). These primer sets include RM580, RM1387, RM3412, RM6515, RM7180 (Chr 1); RM3501, RM5862 (Chr 2); RM22, RM2835, RM5755, RM7565 (Chr 3); RM475, RM1359, RM1388, RM3892 (Chr 4); RM1089, RM 7271 (Chr 5);
RM276, RM 7023 (Chr 6); RM 1353, RM 8006 (Chr 7); RM72, RM 5428 (Chr 8); RM3912, RM6971 (Chr 9); RM333, RM496, RM3152, RM7545 (Chr10); RM21, RM5704 (Chr11); RM101 (Chr 12) (McCouch et al., 2002). PCR amplification was carried out in a final vol-ume of mixtures (12 iL) containing 15~20 ng of genomic DNA, 0.2 mM dNTP, 0.4 [iM of forward and reverse prim-
Table 2. Data on SSR markers used, location on rice chromosomes, polymorphism information content (PIC), number of alleles de­tected, and allele size range.

SSR
marker

Chr. location

SSR
motifs

PIC
value

Allele
number

Size range (bps)

SSR
marker

Chr.
location

SSR
motifs

PIC
value

Allele
number

Size range (bps)

RM21

11

(GA)18

0.809

10

123-169

RM3412

1

(CT)17

0.495

7

205-242
RM22
3
(GA)22
0.574
5
163-199
RM3501
2
(CT)25
0.778
9
181-216
RM72
8
(TAT)5C(ATT)15
0.762
8
157-209
RM3892
4
(TG)14
0.901
19
184-359
RM101
12
(CT)37
0.875
13
134-309
RM3912
9
(GT)22
0.728
9
190-218
RM276
6
0.725
7
88-137
RM5428
8
(TC)16
0.656
6
90-396
RM333
10
(TAT)19(CTT)19
0.926
21
160-287
RM5704
11
(AAT)20
0.873
15
160-215
RM475
4
(TATC)8
0.856
12
175-230
RM5755
3
(ACT)26
0.752
11
203-261
RM496
10
(TC)14
0.724
6
268-297
RM5862
2
(ATA)28
0.869
12
144-237
RM580
1
(CTT)19
0.77
8
205-266
RM6515
1
(GCG)8
0.329
3
220-227
RM1089
5
(AC)33
0.741
11
200-249
RM6971
9
(TTC)13
0.775
6
193-232
RM1353
7
(AG)23
0.807
9
169-276
RM7023
6
(AAAG)11
0.205
4
209-232
RM1359
4
(AG)25
0.847
10
114-151
RM7180
1
(ATAG)6
0.662
4
175-219
RM1387
1
(AG)44
0.801
8
114-151
RM7271
5
(ATCT)8
0.716
6
197-222
RM1388
4
(AG)46
0.889
14
165-240
RM7545
10
(TATG)18
0.829
14
167-256
RM2835
3
(AT)36
0.781
10
173-267
RM7565
3
(TCGA)6
0.526
3
203-212
RM3152
10
(CA)23
0.83
12
232-334
RM8006
7
(AT)94
0.9
14
131-310
396
Botanical Studies, Vol. 52, 2011
ers, 1X TAKARA rTaq buffer and 0.25U TAKARA rTaq. PCR reactions were performed on a TAKARA PCR Ther-mal Cycler Dice Model TP600 (TaKaRa Bio Inc., Japan) for 1 cycle of 5 minutes at 94。C, followed by 35 cycles of 30 seconds at 94。C, 30s at annealing temperature, 30 sec-onds at 72°C, and a final 7-minute extension at 72°C. The optimal annealing temperature for all SSR primer sets was determined by gradient PCR condition conducted using a TAKARA PCR Thermal Cycler.
size variation of microsatellite fragments greater than 3 bp were considered as significantly different alleles.
Data analysis
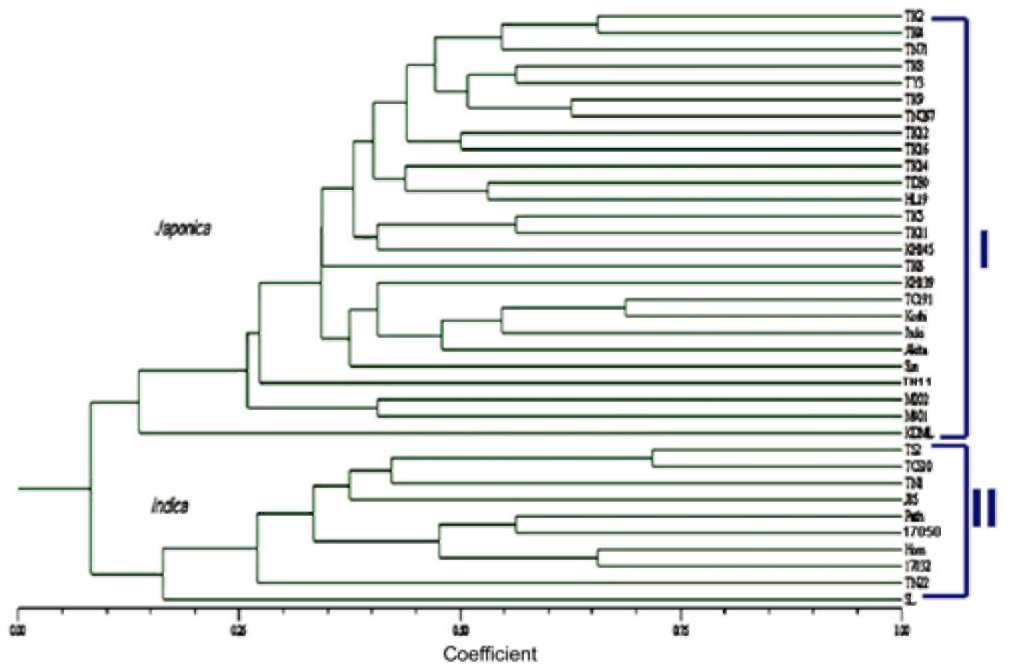
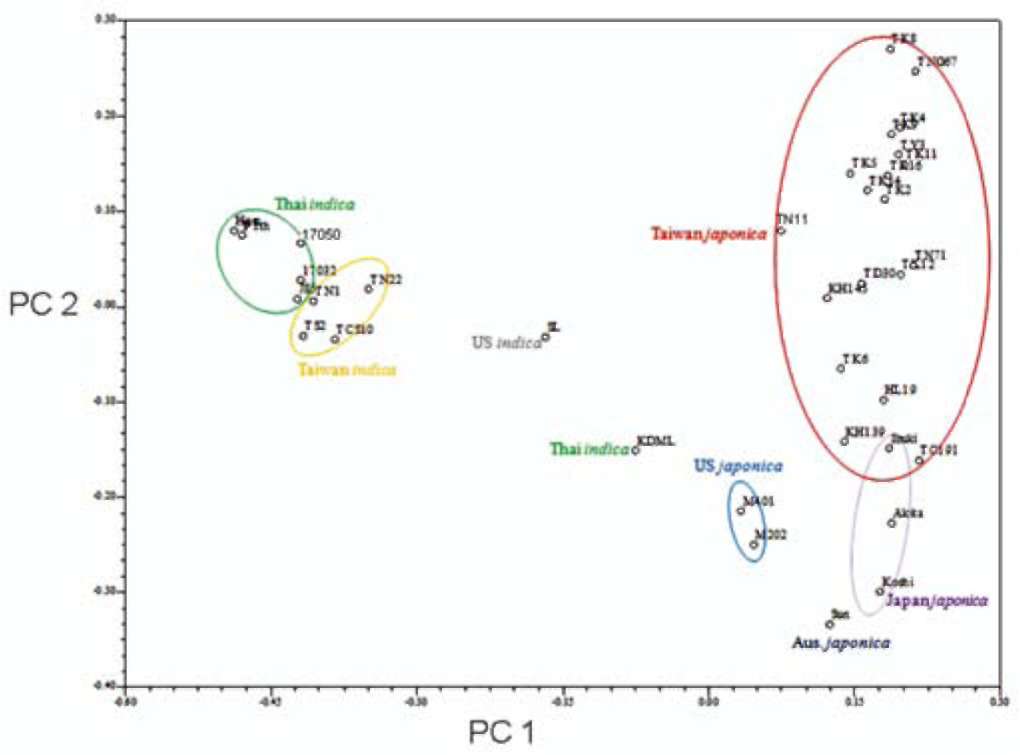
Molecular data from SSR assays, including genetic distance, cluster and principle component analysis (PCA), were analyzed with NTSYS pc ver 2. 2 (Exeter software). PCR products were scored as present (1) and absent (0) for each marker to generate a binary matrix. The genetic simi­larity of 23 local Taiwan rice cultivars was calculated, and a phylogenetic tree was constructed using the UPGMA (unweighted pair-group method using arithmetic averages) method based on genetic similarity coefficients estimated by Modified Rogers' Distance (RMD) (Goodman and Stu-ber, 1983; Reif et al., 2003; Reif et al., 2005):
PCR product separation and allelic size deter­mination
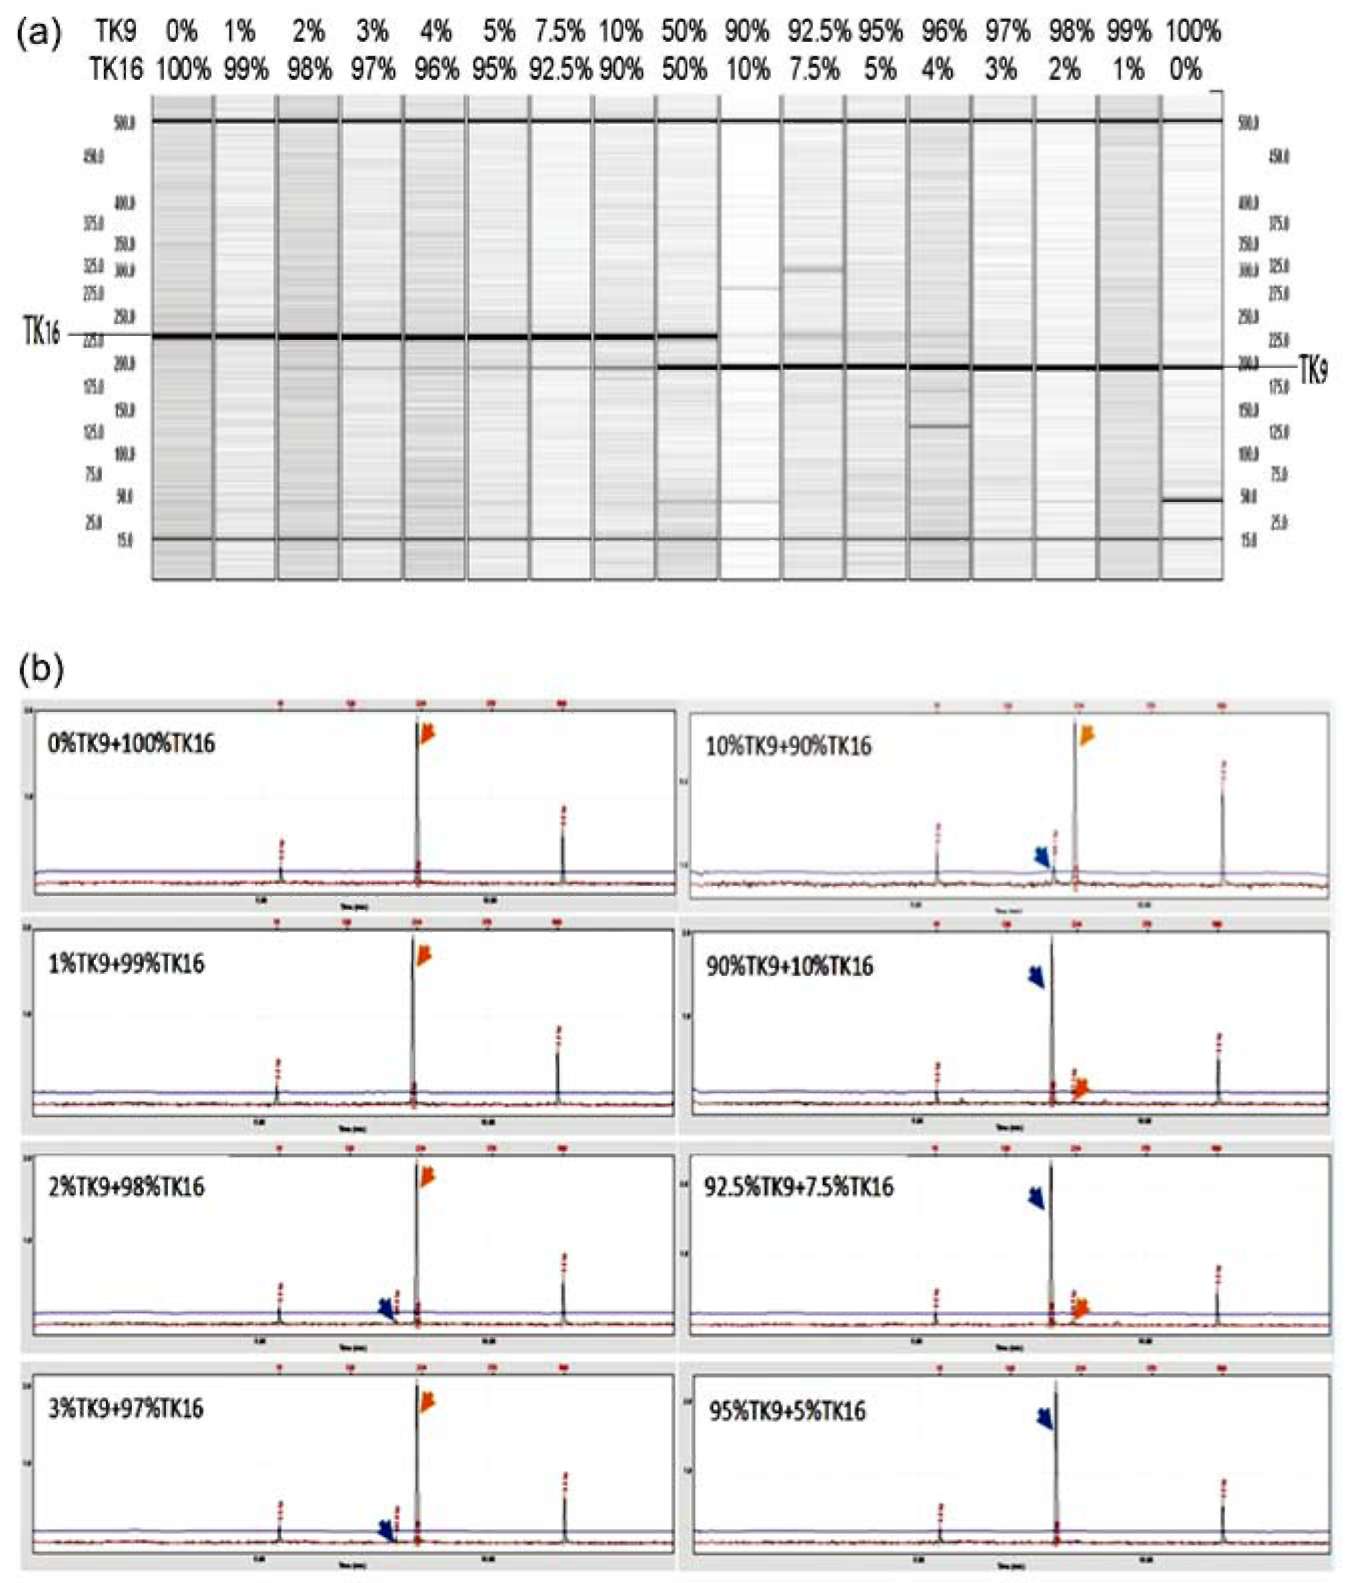
For optimal polymorphic SSR marker screening, PCR products were electrophoresised in 3% Metaphor agarose gel (Cambrex Bio science Rockland Inc., USA) with 1X TBE buffer, stained with EtBr and photographed under UV light. The SSR markers with high polymorphism were fur­ther used in SSR fingerprinting analysis and PCR products were analyzed on a QIAxcel multicapillary electrophoresis system (Qiagen; formerly eGene's HDA-GT12 system). Reactions were carried out with QIAxcel DNA high resolution Kit (Cat No. 929002) and the PCR products were separated using the OM750 method in a 12-channel, sieving-gel cartridge (GCK5000). Based on QX Align-ment Markers 15 bp/500 bp (Cat. No. 929520) and QX DNA Size Marker 25-450 bp (Cat No. 920555), actual al-lele sizes were resolved and automatically calculated in bp by BioCalculatorTM software, provided with the QIAxcel system, and shown as a gel image and electrophoregram. To fit into the best resolution capability of the system, the
where and qy are the frequency of the jth allele at the ith marker in two independent cultivars and m, n indicate the number of markers. The polymorphic information content (PIC) for each marker was calculated (Botsein et al., 1980) and modified by Anderson et al. (1993) for self-pollinated species as follows:
where pi is the frequency of the ith allele, and n is the num­ber of alleles.
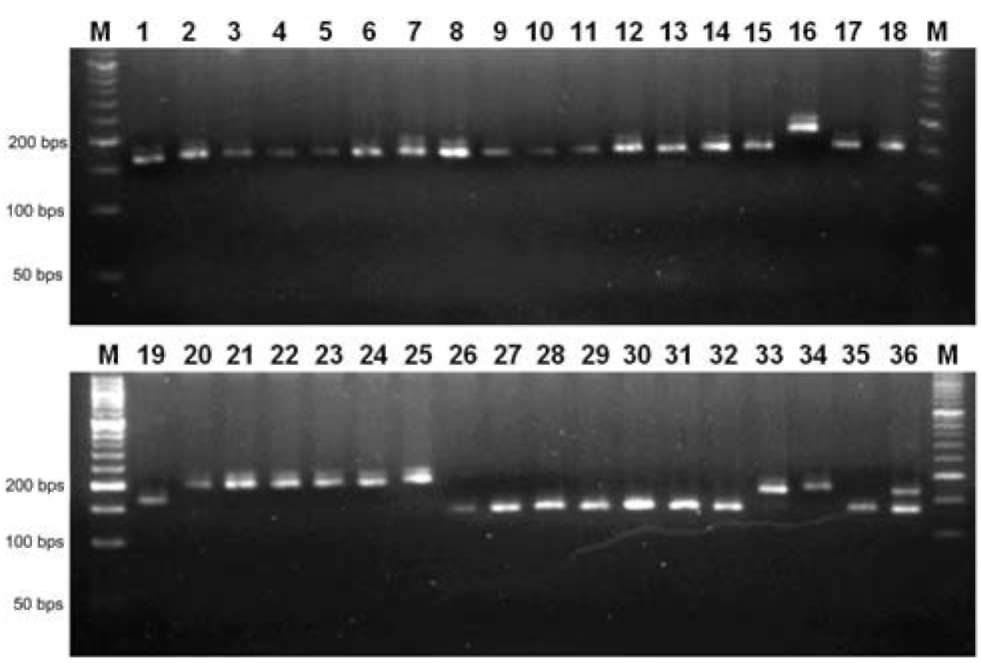
Figure 1. DNA fingerprint analysis of 36 rice varieties from different countries that were amplified by SSR marker (RM1387). The lane (M) represents 50 bp DNA molecule weight markers. The abbreviation name of rice cultivars used for this analysis is the same as Table 1. (1) TK2, (2) TK4, (3) TK5, (4) TK6, (5) TK8, (6) TK9, (7) TK11, (8) TK12, (9) TK14, (10) TK16, (11) TNG67, (12) TN71, (13) KH139, (14) KH145, (15) TN11, (16) TC191, (17) TY3, (18) TD30, (19) HL19, (20) M202, (21) M401, (22) Koshi, (23) Akita, (24) Ibuki, (25) Sun, (26) TS2, (27) TCS10, (28) TN22, (29) TN1, (30) J85, (31) Path, (32) Hom, (33) K17032, (34) K17050, (35) SL, (36) KDML.
CHUANG et al. ― Fingerprinting analysis of rice by SSR
397
Sensitivity of rice adulteration test
used in a genotyping assay of 36 rice cultivars using the QIAxcel multi capillary electrophoresis system (formerly HAD-GT12) (Wang et al., 2009). These 36 commercially-available rice cultivars were obtained from various coun-tries; Japonica (19 from Taiwan, 3 from Japan, 2 from USA and 1 from Australia) and Indica (4 from Taiwan, 6 from Thailand and 1 from USA). Amplification profiles from different primer pairs revealed a considerable differ-ence in their ability to determine genetic variation among these cultivars (Table 2). Some of the primers generated several different alleles across 36 rice varieties but others produced less allelic variation. A total of 306 alleles were detected. The number of alleles per locus ranged from 3 (RM6515, RM7565) to 21 (RM333), with an average of 9.6. The overall allele sizes of DNA ranged from 88 to 396 bp. The polymorphism levels of these 32 markers among the 36 varieties were determined according to the calcu-lated PIC values for each of the SSR loci. The PIC value is an indicator that reflects allele diversity and frequency among various rice varieties. The PIC values varied widely from 0.205 (RM7023) to 0.926 (RM333), with an average of 0.75 per locus (Table 2). The most useful markers for efficient determination of domestic Taiwan rice identi-ties from those of foreign rice are RM21, RM22, RM101, RM333, RM475, RM1387, RM5704, and RM7545. These markers exhibited several distinct bands and showed enough polymorphism to differentiate domestic from for-eign rice varieties.
Genetic similarity among rice cultivars
To determine the level of genetic relatedness among the currently studied rice cultivars, pair-wise similarity coef­ficients were calculated from the SSR-derived data (Table 3). The SSR-based Modified Rogers' Distance (RMD) coefficient between Japonica and Indica rice varieties was
To verify the sensitivity of the methodology used for adulterant detection and quantification, standard samples were prepared with a final concentration of 10 ng DNA templates of TK9/TK16 mixture at progressive ratios of 0, 1, 2, 3, 4, 5, 7.5, 10, 50, 90, 92.5, 95, 96, 97, 98, 99 and 100% of each of TK9 in TK16. Adulterant quantification was determined with RM475 using the Qiaxcel capillary electrophoresis system.
RESULTS
SSR polymorphism among rice varieties
To select SSR markers for efficient differentiation of various rice varieties, we conducted a preliminary screen­ing of 120 microsatellite markers (McCouch et al., 2002) by agarose gel analysis using 16 rice accessions from dif­ferent countries (data not shown). These rice varieties were selected according to the following criteria: (1) where they are currently grown in Taiwan, (2) the higher price avail­able in current rice market, (3) the total trade volume of imported foreign rice and (4) the adulterated rice preferred by customers. Those SSR markers displaying non-specific banding patterns, no polymorphisms or without PCR prod­ucts were discarded. The identity of either foreign or do­mestic Taiwan rice varieties was easily determined using RM1387 (Figure 1). In most cases, except for Taichung 191 (number 16), local Taiwan cultivars (number 1 to 19 Japonica rice, and number 26 to 29 Indica rice) exhibited the same DNA fingerprint. All other foreign cultivars, ex­cept for Jasmine 85 (number 30), Pathumithani (31), and Hom Mali (32), showed variable characteristic DNA frag­ments. For high resolution SSR fingerprinting analysis, 32 SSR markers on all 12 chromosomes showing a clear and high polymorphic DNA fingerprinting profile were further
Figure 2. Phylogenetic tree for 36 rice varieties (23 from Taiwan and 13 from foreign countries) from a UPGMA cluster analysis based on 32 SSR markers.
398
Botanical Studies, Vol. 52, 2011
CHUANG et al. ― Fingerprinting analysis of rice by SSR
399
0.17. The genetic similarity coefficients among foreign and domestic Taiwan Japonica rice ranged from 0.0625 to 0.59375, with an average of 0.11. For Taiwan domestic Japonica varieties, TK 9 and TK 11 showed the closest similarity index, 0.53125, and TK 12 and TN 11 had little similarity, 0.0625. For foreign rice varieties, the genetic similarity coefficient was the highest (0.46875) for two Japonica rices from Japan, Koshihikari and Koshiibuki. On the other hand, rice cultivars from the U.S., Australia and Japan (M401 and SunWhite; Koshiibuki and SunWhite) showed the least similarity, 0.125. We also calculated the similarity coefficients among all Indica rices, which ranged from 0.03125 to 0.56250. Two domestic Taiwan Indica va­rieties, TS 2 and TCS 10, shared high similarity, 0.5625. A distant genetic relationship was found in Khao Dowk Mali 105 (KDML, Thailand Jasmine rice) and Pathumithani; Hom mali and Southern Long Grain (SL); Southern Long Grain, 17032 and Hom mali, as shown with similarity co­efficient 0.03125.
Cluster and principle component analysis among rice varieties
The genetic diversity data were used to group various rice varieties into different clusters and to construct a den­drogram using of NTSYS software UPGMA method. The genotypes which derived from genetically similar ances­tors were clustered together as shown in the dendrogram. The 36 rice cultivars were divided into two major groups (Figure 2). In the first group, there are 19 Japonica rice varieties from Taiwan, three from Japan (Koshihikari (Ko-shi), Koshiibuki (Ibuki), Akitakomachi (Aki)), one from Australia (SunWhite) and two medium rice grains, M 202 and M 401, from U.S. All other Indica cultivars, except for KDML, form a distinct cluster from Japonica as cluster II. A principle component analysis (PCA) was also performed with the 36 rice varieties, which is listed in Table 1. With this statistical method, a large set of variables are replaced by a smaller number of orthogonal variables (called prin­ciple components (PC)). Typically, these relationships are represented as a linear function to account for the variance in the whole dataset. The contribution of the first and sec­ond principle component (PC1 and PC2) to the multivari-ate variation was 17.61% and 6.11%, respectively, and the cumulative contribution was 23.72%. The first and second components provided the correlation between various genotypes of rice cultivars and the corresponding geo­graphical origins. Most Taiwan Japonica varieties formed a separate group apart from the rest of U.S. and Japan Japonica, except for Ibuki. Meanwhile, except for KDML and SL, Taiwan and Thailand Japonica rice varieties were easily distinguishable as belonging to separate groups.
Work flow of domestic Taiwan rice authentica­tion
Market-based incentives are one way to encourage Taiwanese consumers to consume local rice and maintain the integrity of the Taiwanese rice industry. Thus, to pre-
400
Botanical Studies, Vol. 52, 2011
Figure 3. Principle component analysis of 36 rice cultivars using genetic diversity data of 306 alleles at 32 SSR loci. The contribution of PC1 and PC2 was 17.61% and 6.11%, respectively. The cumulative contribution was 23.72%.
vent the adulteration of rice grains and to distinguish local Taiwan rice from other foreign varieties, we developed a workflow of Taiwan rice authentication using SSR DNA fingerprinting analysis (Figure 4). Based on the allelic di­versity of SSR fingerprinting, 8 core SSR markers, includ­ing RM21, RM22, RM101, RM333, RM475, RM1387, RM5704, and RM7545, were chosen to separate 16 rice accessions in sequential order (Figure 4). The RM1387 was the most efficient core SSR primer to easily distin-guish Taiwan rice varieties from foreign rice, except for Taichung 191. The SSR marker RM475, can be further ap-plied to separate foreign rice groups into three subgroups:Koshihikari and Taichung 191, M 401, and SunWhite.
Finally, with marker RM101, the identity of TC 191 can be confirmed. Other domestic rice accessions can be dis­tinguished from each other using the different SSR sets shown in Figure 4. Because of the close genetic relation­ship among local Taiwan Japonica rice varieties during the breeding and selection process, more numbers of poly­morphic markers were required to characterize and sepa­rate them efficiently. It would be interesting to develop a multiplex SSR genotyping platform based on current SSR markers for economic, cost-effective and sensitive local Taiwan rice variety identification in the near future.
Figure 4. Workflow of domestic Taiwan rice variety authenti-fication by DNA fingerprinting profile analysis based on SSR makers.
commercial purpose, we worked out a standard workflow of microsatellite markers (Figure 4) and microsatellite al-lele profiles of the corresponding rice varieties (Data not shown). To validate the sensitivity of our methodology, we first extracted pure DNA from TK 9 and TK16 rice grains and prepared different ratios of standard sample by mixing DNAs from TK9 and TK16. As shown in Figure 5, as low as 4% to 7.5% of impurities admixture in which TK9 or TK16 could be detected with microsatellite marker RM475 by QIAxcel multicapillary electrophoresis gel system. It would be interesting to explore further developments using multiplex SSR genotyping technology by increasing the resolution for adulteration detection.
Quantification of adulteration with different ad­mixtures of TK9 and TK16
It is possible that the premium Taiwan rice variety in the market is inadvertently mixed with other rice samples in the field, in storage, or even worse, intentionally adul­terated with low-priced foreign rice for profit. Thus, in attempting to develop an efficient method for character­izing the identity of a domestic Taiwan rice cultivar for
CHUANG et al. ― Fingerprinting analysis of rice by SSR
401
DISCUSSION
resistance or other agronomical traits of local Taiwan rice varieties. Many studies of pedigree analysis revealed that Japan and Taiwan varieties share high genetic similarities and might be developed from common ancestors (Chen et al., 2008; Lin, 1991; Wu and Lin, 2008). How to keep in-
In the past, elite rice varieties from Japan have been introduced to continuously improve the taste quality, in­crease the genetic diversity of and improve the disease
Figure 5. Adulteration quantification using RM475 with QIAxcel capillary electrophoresis system (a) gel image (b) electropherogram. The admixture of TK16/TK9 rice is based on the corresponding DNA in a final concentration of 10 ng. The corresponding peaks from the amplified products of TK9 are shown as blue arrows, while those from TK16 are shown as orange arrows.
402
Botanical Studies, Vol. 52, 2011
creasing the genetic diversity of local Taiwan rice varieties to adapt to future climate change and to preserve the in­tegrity of high quality rice varieties in the market remains a big challenge for breeders. Assessing genetic similarity by SSR fingerprinting among Taiwan and foreign rice varieties is thus not only important for facilitating parent selection in hybridization breeding programs but also for authentication and traceability in the domestic rice market. Although pedigree analysis can provide basic informa­tion about the genetic relatedness among rice varieties, a precise and complete pedigree data set related to the hy­bridization process and ancestors used is needed. Owing to self-crossing and selection, genetic drift and random crossover may also cause ambiguities in interpreting the genetic similarity between rice varieties. The recent deci­phering of the rice genome and the development of various DNA markers provides new opportunity for polymorphism discovery, identification and high-resolution rice genetic linkage mapping. Theoretically, with enough specific and polymorphic DNA markers, the differences in genetic compositions between any two rice varieties should not require a sequenced genome. In this study, we preliminar­ily screened out 32 highly polymorphic primer pairs from 120 microsatellite markers and applied genetic similarity analysis to 36 rice varieties from different countries. These markers were evenly distributed across all 12 rice chromo­somes. With SSR-derived data, we were able to determine the level of genetic similarity between domestic Taiwan and foreign rice varieties. Some of these shared the same similarity coefficients (Table 3) suggests that more mark­ers may still be needed for further discrimination and char­acterization of various rice genotypes.
In this study, a UPGMA dendrogram-based cluster­ing analysis was used to access the genetic relationship of 36 rice varieties from different countries. In group I, Taiwan Japonica rice cultivars were closely linked genetically. Twelve out of sixteen (75%) rice varieties shared "TNG67" as one of the parents in their pedigree: TK2 (25%), TK5 (12.5%), TK8 (37.5%), TK11 (6.25%), TK14 (28.125%), TK16 (37.5%), TNG71 (12.5%), TN11 (18.75%), TY3 (12.5%), HL19 (18.75%) and TD30 (12.5%). Eight out of sixteen (50%) were inherited from the parent of KH139: TK4 (12.5%), TK5 (12.5%), TK6 (12.5%), TK11 (37.5%), TK12 (3.125%), KH145 (50%), TY3 (6.25%) and TD30 (6.25%). Values in parentheses indicate the relative genetic contribution of TNG 67 as a breeding parent (Lu C.T. and H. Y. Lu, 2010). We also noticed that five rice accessions (5/7 = 71.4%) including KH139, TC191, Koshi, Ibuki, Akita, KH145 were pedi-gree-related to Koshihikari. The Japonica rice from Japan, such as Koshihikari and Kinuhikari had been selected as the parental line for breeding TC191 (56.25%) and TNG 71 (50%); KH145 (50%), respectively. To our under-standing, Koshiibuki (Ibuki) and Akitakomachi (Akita) were all pedigrees related to Koshihikari. In addition, we found that TK 9 shares the highest genetic similarity with TNG67, and this may ascribe to their mutual inheritance from Koshihikari. From our SSR data, two Indica rice va-
rieties, KDML in group I and Southern Long Grain Rice (SL) in group II, tended to be more genetically related to Japonica (Figure 2) and were not easily classified and separated into different groups using PCA (Figure 3). This could be due to the number of SSR markers used in the study or the bias of genetic similarity estimation con­ducted by the UPGMA-based method. KDML is a popu­lar non-basmatic aromatic landrace rice variety developed from a high-yield potential (HYP) program and consumed in the Thai rice market. This Jasmine rice cultivar is well known for its unique appearance, cooking quality and aro­ma. Southern Long Grain Rice (SL) represents the most common brand of table rice consumed in the U.S. Several varieties of long grain Indica-type rice are grown in dif­ferent U.S. states, including Arkansas, Mississippi, Mis­souri, Louisiana, and Texas. Some varieties are consumed with special processing, such as parboiling. Since there is no pedigree data available regarding their hybridization or breeding processes, it is difficult to deduce the putative genetic relationships they have with the current Japonica rice varieties.
Finally, though the number of foreign rice genotypes analyzed in our study was low, the structure of clusters illustrated by PCA clearly indicated that the grouping trends of most rice varieties are geographical-related; the Taiwan rice cultivars in particular. Shu et al. (2009) ana­lyzed 313 Japonica varieties from 20 countries using 34 SSR primers and their results also showed a clear genetic similarity among various Japonica rice varieties that were closely linked to their geographical distribution. Conse­quently, microsatellite allele profiles can be a convenient, efficient and economic technique for measuring the genet­ic diversity and the differentiation of rice cultivars having different origins.
CONCLUSION
The competiveness of the domestic rice market or of the international rice trade demands the identification of rice varieties in a milled sample to maintain purity and qual­ity standards. For this purpose, many DNA fingerprinting methods previously applied in rice variety identification and authentication used milled grains. In this study, we took advantage of the high resolution DNA banding pat­tern of the QIAxcel capillary gel electrophoresis system to measure the genetic diversity of 36 rice verities using 32 SSR markers. Taken together, the microsatellite mark­ers identified in this study can be used for efficient genetic diversity analysis to separate Taiwan rice cultivars from other foreign rice. Moreover, according to the unique pro­files of rice genotypes, we selected a SSR marker and tried to establish a workflow for domestic Taiwan rice variety authentication. The results from this study can be extended and further applied to tracing and monitoring adulteration in rice agric-products and agric-food markets. Capillary electrophoresis (CE)-based microsatellite DNA finger­printing technology holds a promise for highly efficient, sensitive and economic adulterants quantification and can
CHUANG et al. ― Fingerprinting analysis of rice by SSR
403
benefit both farmers' and consumers' communities by pre­serving the integrity of premium rice varieties in Taiwan.
wase. 2008. Development of mini core collection of Japa­nese rice landrace. Breed. Sci. 58: 281-291.
Ganal, M.W., T. Altmann, and M.S. Roder. 2009. SNP identifica­tion in crop plants. Curr. Opin. Pl. Biol. 12: 211-217.
Giarrocco, L.E., M.A. Marassi, and G.L. Salerno. 2007. Assess­ment of the genetic diversity in Argentine rice cultivars with SSR Markers. Crop Sci. 47: 853-858.
Goodman, M.C. and C.W. Stuber. 1983. Races of maize. VI.
Isozyme variation among races of maize in Bolivia. Maydi-
ca 28: 169-187.
Hashimoto, Z., N. Mori, M. Kawamura, T. Ishii, S. Yoshida, M. Ikegami, S. Takumi, and C. Nakamura. 2004. Genetic diversity and phylogeny of Japanese sake-brewing rice as revealed by AFLP and nuclear and chloroplast SSR mark­ers. Theor. Appl. Genet. 109: 1586-1596.
Hour, A.L., Y.C. Lin, P.F. Li, T.Y. Chow, W.F. Lu, F. Wei, and
Y.I. Hsing. 2007. Detection of SNPs between Tainung 67 and Niponbare rice cultivars. Bot. Stud. 48: 243-253.
Hsieh, L.Y., D.R. Wu, and K.K. Hu. 2007. Variety identification among major Japonica rice cultivars of Taiwan based on simple sequence repeat markers. Seed & Nursery (Taiwan)
9: 25-39.
Huang, S. 2001. Taiwan's rice import market to open with WTO accession. Rice Situation and Outlook Yearbook. Market and Trade Economics Division, ERS. USDA. November 2-1. RCS-2001, pp. 33-36.
Jain, S., R.K. Jain, and S.R. McCouch. 2004. Genetic analysis of Indian aromatic and quality rice (Oryza sativa L.) ger-mplasm using panels of fluorescent-labeled microsatellite
markers. Theor. Appl. Genet. 109: 965-977.
Jayamani, P., S. Negrao, M. Martins, B. Macas, and M.M. Oliveira. 2007. Genetic relatedness of Portuguese rice ac­cessions from diverse origins as assessed by microsatellite markers. Crop Sci. 47: 879-884.
Lin, M.S. 1991. Genetic base of Japonica rice varieties released in Taiwan. Euphytica 56: 43-46.
Lu, C.Y. and H.Y. Lu. 2010. Establishment and application of Taiwan Rice Information System. J. Taiwan Agric. Res. 59: 61-69. (Chinese in English Abstract)
Lu, H., M.A. Redus, J.R. Coburn, J. N. Rutger, S.R. MuCouch,
and H.T. Tai. 2005 Population structure and breeding pat­terns of 145 U.S. rice cultivars based on SSR marker analy­sis. Crop Sci. 45: 66-76.
McCouch, S.R., L. Teytelman, Y. Xu, K.B. Lobos, K. Clare, M. Walton, B. Fu, R. Maghirang, Z. Li, Y. Xing, Q. Zhang, I.
Kono, M. Yano, R. Fjellstrom, G. DeClerck, D. Schneider, S. Cartinhour, D. Ware, and L. Stein. 2002. Development and mapping of 2240 new SSR markers for rice (Oryza sa-
tiva L.). DNA Res. 9: 199-207.
Pal, S., S. Jain, N. Saini Aarti, and R.K. Jain. 2004. Identification of microsatellite markers for differentiating some Basmati and non-Basmati rice varieties. Indian J. Biotech. 3: 519­526.
Pervaiz, Z.H., M.A. Rabbani, S.R. Pearce, and S.A. Malik. 2009.
Acknowledgements. We thank the Council of Agricul­ture (COA), Taiwan for their funding and support. We also thank TARI (Taiwan Rice Research Institute), various Taiwan Agricultural Research Stations, U.S. Rice Associa­tion and COA for collecting and providing the local and foreign rice seed materials.
LITERATURE CITED
Agrama, H.A., W.G. Yan, F. Lee, R. Fjellstrom, M.H. Chen, M. Jia, and A. McClung. 2009. Genetic assessment of a mini-core subset developed from the USDA rice genebank. Crop Sci. 49: 1336-1346.
Anderson, J.A, G.A. Churchill, J.E. Autrique, S.D. Tanksley, and M.E. Sorreles. 1993. Optimizing parental selection for ge­netic linkage maps. Genomes 36: 181-186.
Archak, S., V. Lakshminarayanareddy, and J. Nagaraju. 2007. High-throughput multiplex microsatellite marker assay for detection and quantification of adulteration in Basmati rice (Oryza sativa). Electrophoresis 28: 2396-2405.
Bajracharya, J., K.A. Steele, D.J. Jarvis, B.R. Sthapti, and J.R. Witcombe. 2006. Rice landrace diversity in Nepal: vari­ability of agro-morphological traits and SSR markers in lan-draces from a high-attitude site. Field Crops Res. 95: 327­335.
Bernardo, G.B., U. Galderisi, M. Cipollaro, and A. Cascino. 2005. Methods to improve the yield and quality of DNA from dried and processed figs. Biotechnol. Prog. 21: 546­549.
Bonow, S.W., E.V.R. Von Pinho, M.G.C. Vieira., and B.
Vosman. 2009. Microsatellite markers in and around rice genes: ap­plication in variety identification and DUS testing. Crop Sci. 49: 880-886.
Botstein, D., R.L. White, M. Skolnick, and R.W. Davis. 1980.
Construction of genetic linkage map in man using restric­tion fragment length polymorphism. Am. J. Hu. Genet. 32:314-331.
Chen, H., M.S. Lin, and K.K. Hwu. 2008. A database of Taiwan rice pedigrees. Crop, Environment & Bioinformatics 5: 22­28. (Chinese in English Abstract)
Chen, X., S. Temnykh , Y Xu, Y.G. Cho, and S.R. McCouch. 1997. Development of a microsatellite framework map providing genome-wide coverage in rice (Oryza sativa L.)
Theor. Appl. Genet. 95: 553-567.
Cirillo, A., S.D. Gaudio, G.D. Bernardo, U. Galderisi, A. Casci-no, and M. Cipollaro. 2009. Molecular characterization of Italian rice cultivars. Eur. Food Res. Technol. 228: 875-881.
Colyer, A., R. Macarthur, J. Lloyd, and H. Hird. 2009. Compari­son of calibration methods for the quantification of Basmati and non-Basmati rice using microsatellite analysis. Food Addit. Contam. (Part A) 25: 1189-1194.
Ebana, K., Y. Kojima, S. Fukuoka, T. Nagamine, and M. Ka-
404
Botanical Studies, Vol. 52, 2011
Determination of genetic variability of Asian rice (Oryza sativa L.) varieties using microsatellite markers. African J.
Biotech. 8: 5641-5651.
Pessoa-Filho, M., A. Belo, AN.A. Antonio, P.H.N. Rangel, and M.F. Ferreira. 2007. A set of multiplex panels of microsatel-lite markers for rapid molecular characterization of rice ac­cessions. BMC Plant Biol. 7: 23.
Popping, B. 2002. The application of biotechnological methods in authenticity testing. J. Biotech. 98: 107-112.
Primrose, S., M. Woolfe, and S. Rollinson. 2010. Food forensics: methods for determing the authenticity of foodstuffs. Trends Food Sci. Tech. 21: 582-590.
Rahman, M.S., Md. R. Molla, Md. S. Alam, and L. Rahman. 2009. DNA fingerprinting of rice (Oryza sativa L.) cultivars using microsatellite markers. Aust. J. Crop Sci. 3: 122-128.
Reif, J.C, A.E. Melchinger, X.C. Xia, M.L. Warburton, D.A.
Hoisington, K. Vasal, G. Srinivasan, M. Bohn, and M. Fisch. 2003. Genetic distance based on simple sequence re­peats and heterosis in tropical maize populations. Crop Sci. 43: 1275-1282.
Reif, J.C., A.E. Melchinger, and M. Fisch. 2005. Genetical and
mathematical properties of similarity and dissimilarity coef­ficients applied in plant breeding and seed bank manage­ment. Crop Sci. 45: 1-7.
Shu, A.P., K.J. Hwan, S.Y. Zhang, G.L. Cao, Z.H. Nan, K.S. Lee, M.Q. Lu, and L.Z. An. 2009. Analysis on genetic similarity of japonica rice variety from different origins of geography in the world. Agricultural Sciences in China 8: 513-320.
Singh, R.K., R.K. Sharma, A.K. Singh, V.P. Singh, S.P. Tiwari,
and T. Mohapatra. 2004. Suitability of mapped sequence tagged microsatellite site markers for establishing distinct­ness, uniformity and stability in aromatic rice. Euphytica 135: 135-143.
Steele, K.A., R. Ogden, R. McEwing, H. Briggs, and J. Gorham. 2008. InDel markers distinguish Basmatis from other fra­grant rice varieties. Field Crops Res. 105: 81-87.
Tautz, D. 1989. Hypervariability of simple sequences as a gen­eral source of polymorphic DNA markers. Nucleic. Acids. Res. 17: 6463-6471.
Terzi,V., C. Morcia, A. Gorrini, A.M. Stanca, P.R. Shewry, and P. Faccioli. 2005. DNA-based methods for identification and quantification of small grain cereal mixtures and finger­printing of varieties. J. Cereal Sci. 41: 213-220.
Thomposon, M.J., E.M. Septiningsih, F. Suwardjo, T.J. Santoso,
T.S. Silitonga, and S.R. McCoush. 2007. Genetic diversity
analysis of traditional and improved Indonesian rice (Oryza sativa L.) germplasm using microsatellite markers. Theor.
Appl. Genet. 114: 559-568.
Vlachos, A. and L.S. Arvanitoyannis. 2009. A review of rice au­thenticity/adulteration methods and results. Crit. Rev. Food Sci. Nut. 48: 553-598.
Vemireddy, L., S. Archak, and J. Nagarju. 2007. Capillary elec-trophoresis is essential for microsatellite marker based detection and quantification of adulteration of basmati rice (Oryza sativa L.). J. Agric. Food Chem. 55: 8112-8117.
Vos, P., R. Hogers, M. Bleeker, M. Reijans, V.D. Lee, and M. Homes. 1995. AFLP: a new concept for DNA fingerprint­ing. Nucleic. Acids. Res. 23: 4407-4414.
Wang, X.W., A.T. Rinehart, P.A. Wadl, J.M. Spiers, D. Had-
ziabdic, M.T. Windham, and R.N. Trigiano. 2009. A new electrophoresis technique to separate microsatellite alleles African. J. Biotech. 8: 2432-2436.
Williams, J.G.K., A.R. Kubelik, K.J. Livak, J.A. Rafalski, and
S.V. Tingey. 1990. DNA polymorphism amplified by arbi­trary primers are useful as genetic markers. Nucleic. Acids. Res. 18: 6531-6535.
Woolfe, M. and S. Primrose. 2004. Food Forensics: using DNA technology to combat misdescription and fraud. Trends Bio-technol. 22: 222-226.
Wu, W.C. and M.S. Lin. 2008. Pedigree analysis of rice varieties of Taiwan: I. relationships among Japanese introductions. Crop Environ. Bioinformatics 5: 248-257. (Chinese in Eng­lish Abstract)
Wu, Y.J., Z.M. Zhang, Y. Chen, B. Wang, G.U. Yang, and W.Y.
Yang. 2009. Authentication of Thailand jasmine rice using
RAPD and SCAR methods. Eur. Food Res. Technol. 229: 515-521.
Xu, Y.B., H. Beachell, and S.R. McCouch. 2004. A marker-based approach to broadening the genetic base of rice in the USA. Crop Sci. 44: 1947-1959.
Yuan, X.P., X.H. Wei, H. Lei, H.Y. Yu, Y.P. Wang, Q. Xu, and
S.X. Tang. 2007. A comparative study of SSR diversity in Chinese major rice varieties planted in 1950s and in the re­cent ten years (1995-2004). Rice Sci. 14: 78-84.
Zhang, Y. and J.R. Stommel. 2001. Development of SCAR and
CAPS markers linked to the Beta gene in tomato. Crop Sci.
41: 1602-1608.
CHUANG et al. ― Fingerprinting analysis of rice by SSR
405
利用微衛星DNA標誌鑑別台灣市售米常見品種
莊雪玉  盧虎生  胡凱康  張孟基
國立台灣大學農藝學系
爲追溯、偵測並防止混米之目的,本硏究利用微衛星標誌(SSR)來鑑別台灣常見市售國產米及
國外進口食米品種。共使用36個國內外食米品種及32組微衛星標誌進行水稻多型性之DNA指紋分
析。結果於32個基因座上共得到306個不同之等位基因。每個基因座可有321個片段,平均每
個基因座爲9.6個片段。多態性訊息含量Polymorphic information value (PIC),介於0.205 (RM7023)
0.926 (RM333),平均爲0.75 。其中RM101, RM333, RM475, RM1387, RM1388, RM2835, RM5428
RM5704微衛星標誌可有效區別台灣國產米。經由主座標principle component analysis (PCA)及集群分析
(clustering analysis),發現來自不同國家之食米品種可分爲2群。最後爲防範混米,本硏究也建立了台灣
良質米品種鑑定及純度檢測流程表。在實際檢測應用上,以不同比例之台梗九號及台梗十六號進行混米
檢測'其檢出之靈敏度約爲3% - 7.5%
關鍵詞:DNA指紋分析;微衛星標誌;多型性;水稻;簡單重覆序列。