Botanical Studies (2012) 53: 19-30.
MOLECULAR BIOLOGY
Cloning the broccoli HMG-I/Y gene as an endogenous reference for transgene copy number determinations using real-time PCR
Chun-Hung LIN, Jia-Yuan HUANG, and Long-Fang O. CHEN*
Institute of Plant and Microbial Biology, Academia Sinica, Taipei, Tai-wan 11565
(Received January 25, 2011; Accepted July 20, 2011)
ABSTRACT. Transgenic technology has become an indispensable tool for crop improvement. However, transgene integration and copy number insertion affect transgenic expression and stability. TaqMan® quantita­tive real-time PCR (qRT-PCR) was developed as an alternative way to determine transgene copy numbers and has several advantages over other methods: smaller amounts of test materials required, higher throughput capacity, large quantification scope, no post-PCR gel analyses, etc. Nevertheless, the TaqMan qRT-PCR re­quires an endogenous DNA sequence with confirmed low copy numbers per genome for its internal control. The current reports that use the HMG-I/Y (high-mobile-group protein I/Y) gene as the internal standard for Brassica oleracea are discrepant. Using the HMG-I/Y gene found in rapeseed and Arabidopsis as a reference, we cloned and characterized a full cDNA sequence (796 bp) of the broccoli (Brassica oleracea var. italica) HMG-I/Y gene that shared 75% identity with the deduced amino acid sequences of Brassica napus in our laboratory. We also conducted phylogenetic analyses from the deduced amino acid sequences of the HMG-I/Y gene among known plant species. These corresponded with traditional taxonomy. We demonstrate here that the cloned HMG-I/Y gene, being a single copy in broccoli, can serve as an internal reference gene for estimat­ing copy numbers of transgene among the tested populations of isopentenyl transferase (ipt) and Arabidopsis embryonic flower gene EMF1 (AttEMF-1) transgenic broccoli.
Keywords: Quantitative real time polymerase chain reaction (qRT-PCR); AtEMF1 gene; ipt gene.
INTRODUCTION
for transgenic study. Copy number estimation methods have evolved from the traditional Southern blotting analy­sis to the handy Polymerase Chain Reaction (PCR)-based quantitative real time PCR (qRT-PCR). The qRT-PCR has recently been adapted for transgene expression, copy number determination, GM food contamination and mixed events (Ginzinger, 2002; Mason et al., 2002; Huang and Pan, 2004; Huang and Pan, 2005; Battistim and Noli, 2009; Beltran et al., 2009). Several varieties of transgenic species have used qRT-PCR transgene copy number estimation including wheat, barley, (Ingham et al., 2001), rice (Yang et al., 2005), and maize (Song et al., 2002) for monocots; watermelon, tomato, sugar beet (Ingham et al., 2001), cot­ton (Yi et al., 2007), citrus (Omar et al., 2008), rapeseed (Weng et al., 2004) and soybean (Harikai et al., 2009) for dicots. The advantages of qRT-PCR in these studies noted the relatively minimal amount of test materials needed, the higher throughput capacity, the large scope of quantifica­tion, no post-PCR gel analyses, etc. (Mason et al., 2002; Weng et al., 2004). Transgene quantification employed two typical qRT-PCR methods, i.e. absolute quantification (or standard-curve quantitation) and relative quantification (Li-vak and Schmittgen, 2001; Ginzinger, 2002). The absolute quantification for determining the copy number is largely dependent on the standard curve obtained from serious di-
Rapid developments in genomic sequencing and func­tional genomics have paved a magnanimous avenue toward identifying genetic traits within gene sequences. Tradi­tional plant breeders conducted genetic recombinations for desired traits without this sequence information. Trait-se­quence link studies are now more feasible than in the past, coincidentally, transgenic technology has become an indis-pensible tool for plant improvement. The growing amount of acreage planted with GM (genetically modified) crops over the past decades (James, 2009) should be an indicator of its potential. The key factor in using transgenic technol­ogy, however, is how to avoid transgenic gene silencing. Although there are some controversies on the effects of transgene copy numbers toward transgene expressing or transgene silencing (Flavell, 1994; Vaucheret et al., 1998; Craig et al., 2005; Mirza, 2005; Tang et al., 2007), it is es­sential to estimate the inserted transgene copy numbers for stable integration and inheritance. An efficient method for transgene copy numbers determination is always the need

*Corresponding author: E-mail: ochenlf@gate.sinica.edu.tw.
20
Botanical Studies, Vol. 53, 2012
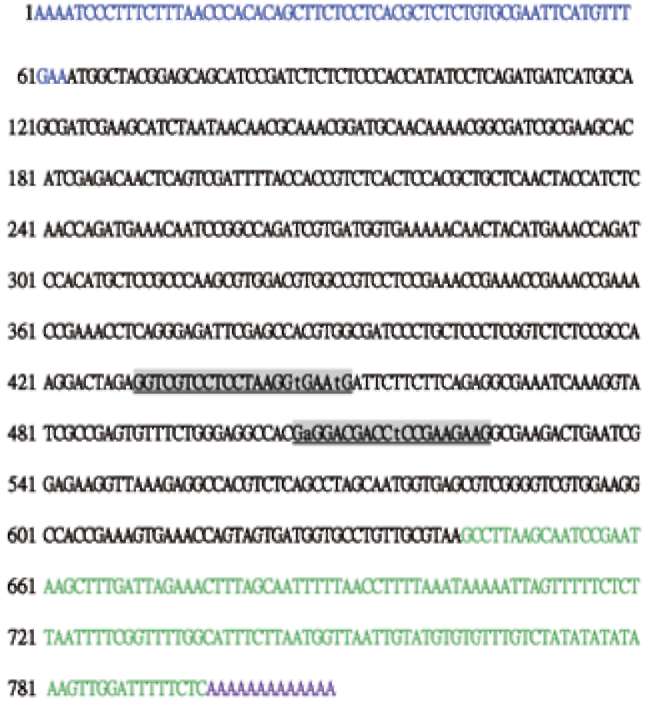
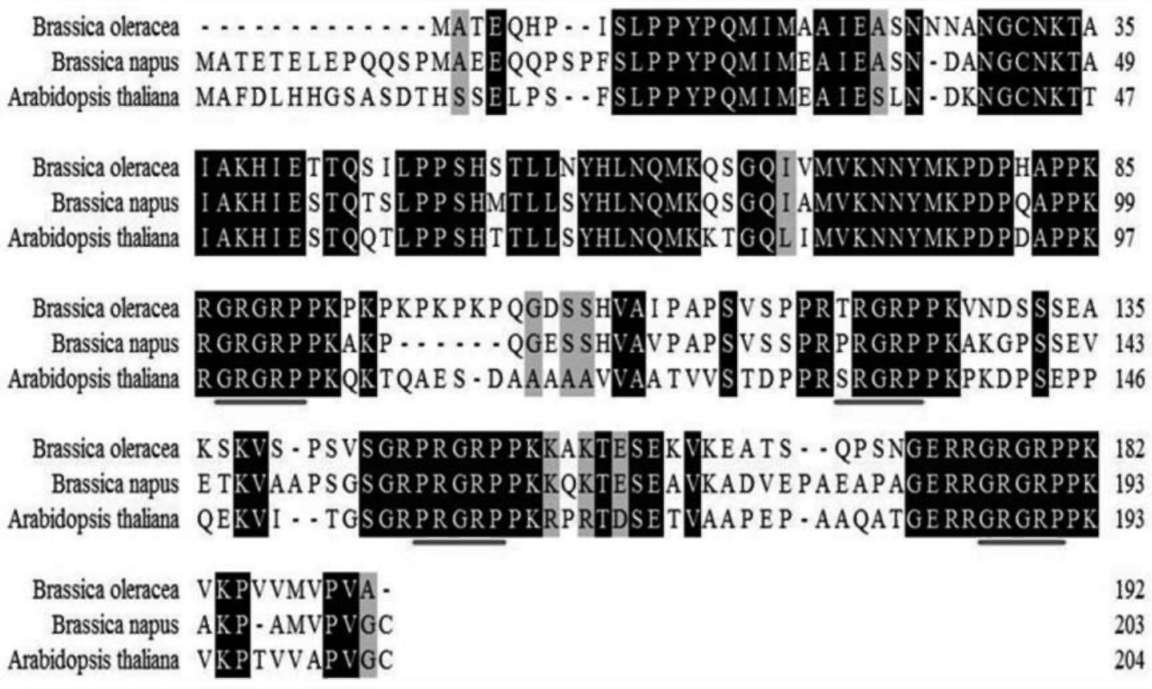
lution of a known sample, while the relative quantification relies on comparing the amplified signal with the control gene. Estimating this requires exploring the endogenous genes and their reference gene potentials. Ding et al. (2004) propose that a reliable reference gene should meet three re­quirements: be species specific, have low copy number, and have low heterogeneity among the cultivars. They provided reference plant gene examples for maize, soybean, rape-seed and rice. The most intensive research on endogenous reference genes for qRT-PCR studies in Brassica have been with rapeseed (Brassica napus) (Masek et al., 2000; Weng et al., 2004; Weng et al., 2005; Wu et al., 2010). Wu et al. (2010) indicated that there were five endogenous reference genes in B. napus: acetyl-CoA carboxylase gene (BnAC-Cg8), phosphoenolpyruvate carboxylase (PEP), oleoxl hy­drolase gene (Fat A), high-mobility-group protein I/Y gene (HMG-I/Y) and cruciferin A gene (Cru A), The presence of these genes in other Brassica species is currently contested. For example, Weng et al., 2005, pointed out that HMG-I/Y is a single copy in rapeseed and that its amplification was not observed in other Brassica genus or species, such as broccoli, stem mustard, cauliflower, Chinese cabbage, cabbage, sprouts, etc. This gene was also absent in B. oleracea according to Southern blotting analysis of the HMG-I/Y gene. Wu et al. (2010), however, recently located HMG-I/Y in B. napus, B. nigra and B. oleracea. In this study, we demonstrate the presence of HMG-I/Y as single copy in broccoli (B. oleracea var. italica) and its utility for copy number determination in transgene broccoli transformation.
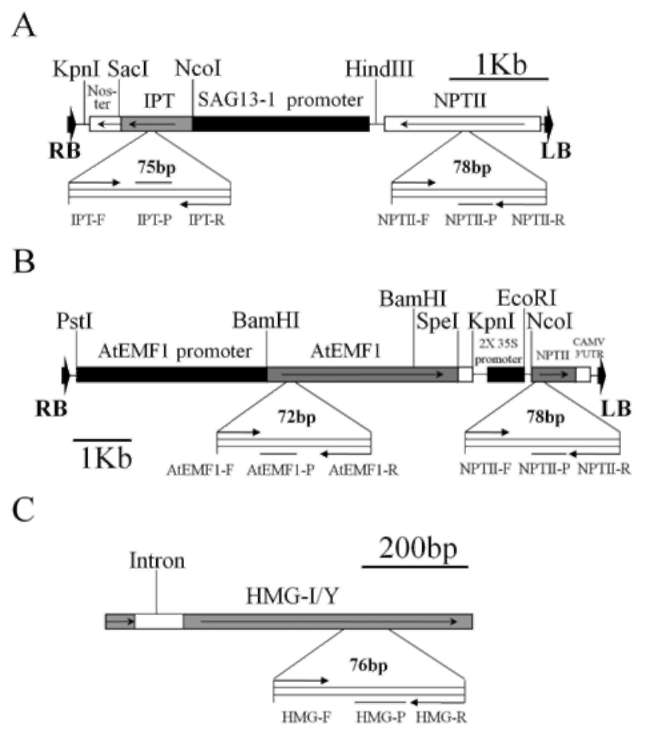
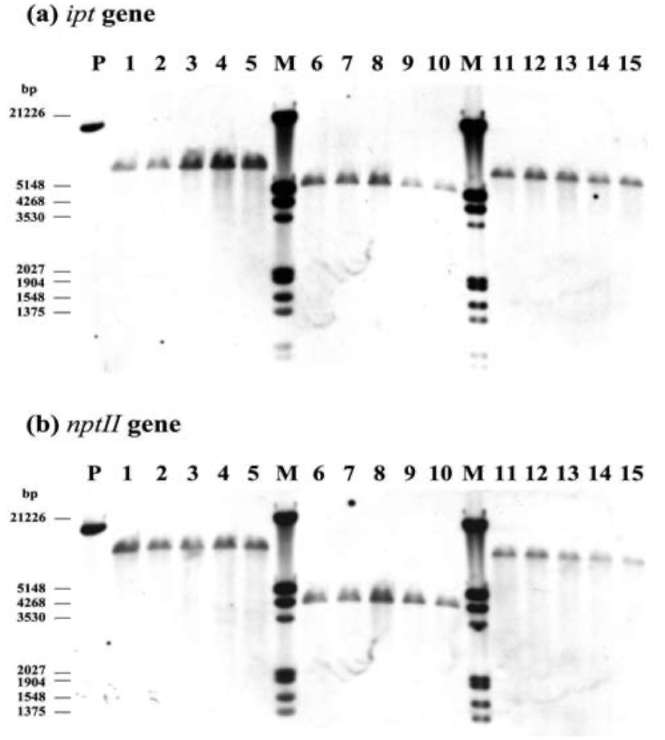
Figure 1. Maps of transgene constructs and sites of primer sets designed for qRT-PCR, (A) ipt&NPTII; (B) AtEMF1&NPTI! and (C) endogenous Brassica oleracea var. italica HMG-I/Y.
for copy number determination to validate the established methodology.
MATERIALS AND METHODS
Plant DNA extraction, total RNA isolation and cDNA synthesis
Plant materials and transgene constructs
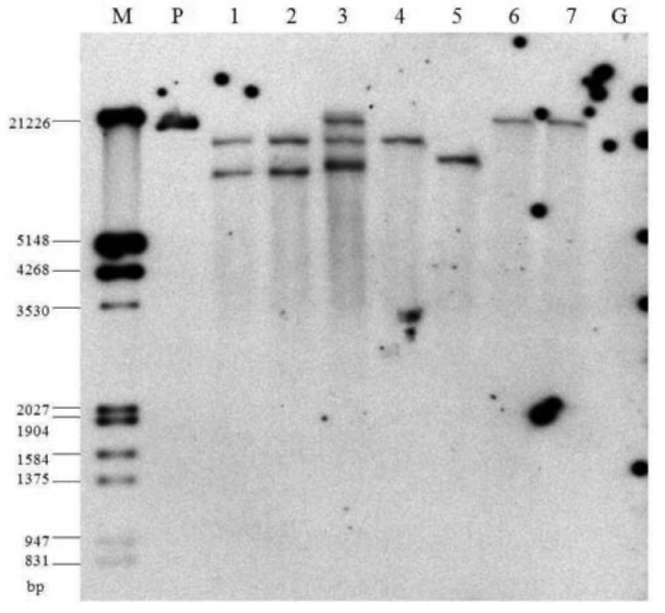
The plant genomic DNA samples used for quantitative PCR detection were extracted and purified using a DNA extraction kit: Plant Genomic DNA Extraction Miniprep System (VIOGENE, Taipei, Taiwan, R.O.C.). The plant genomic DNA samples used for the Southern blot analysis and chromosome walking were extracted and purified from fresh leaves according to the CTAB method (Gawel et al., 1991). Genomic DNA was quantified spectrophotometri-cally using a DU® 640B DNA/Protein calculator (Beckman Company) and analyzed by 1% agarose gel electrophoresis in lxTBE with ethidium bromide staining.
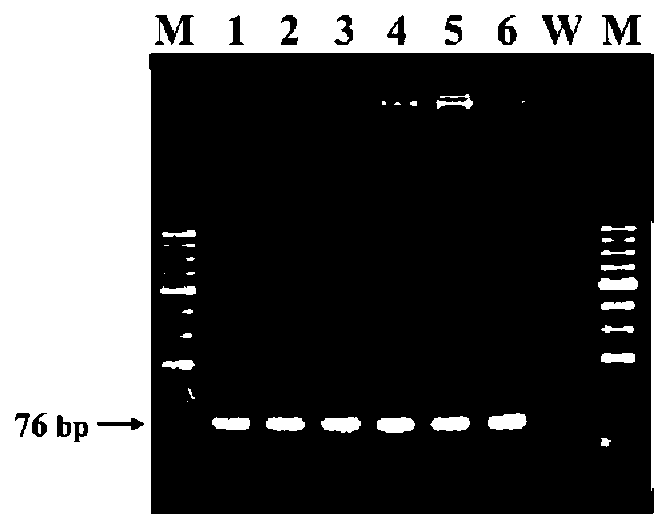
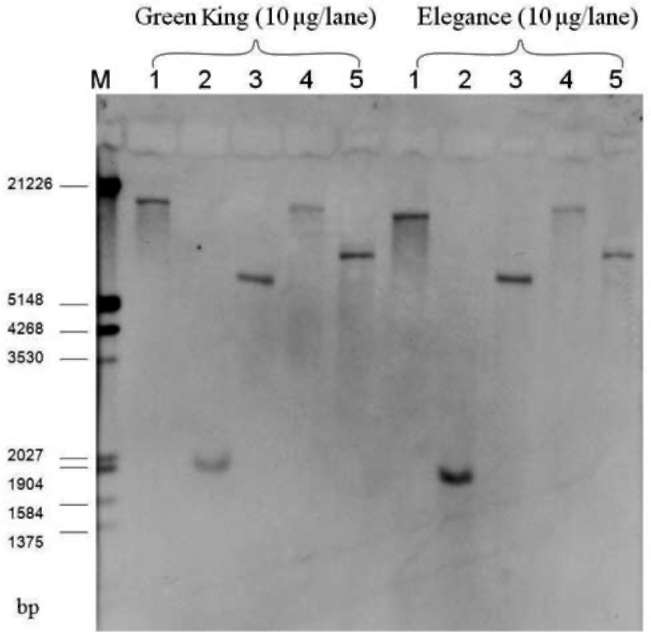
Broccoli (B. oleracea var. italica) cultivars Green King and Elegance seeds were obtained from the Know-You Seed Company (Kaoshiung, Taiwan). We used constructs of transgene ipt and AtEMF1 as indicated in Figure 1A and 1B. We also used transgenic ipt T5 lines derived from self-progeny of selected T4 individuals from our previous study (Chen et al., 2001). Three T4 lines were used first to check the stability and purity among selfed or sib-mated (due to the occasional lack of pollen) progeny. For each line, five sib or self-pollinated progeny were randomly selected for transgene zygosity examination via qRT-PCR. Among those, Lines 101 and 103 derived from the same Ttrans-formant and Line 102 derived from another independent transformant. At least ten individuals of each T5 from the self-pollinated progeny of each line were further con­firmed for the copy number. The agronomic performance of the developed inbred lines (T5) has been reported else­where (Chan et al., 2009). The later transgene construct for polycomb gene study (Figure 1C) was kindly supplied by Professor Zinmay Renee Sung of the Department of Plant and Microbial Biology, University of California, Berkeley, US). The AtEMF1 transgenic lines were obtained follow­ing the method of Chen et al. (2001) using Agrobacterium-mediated transformation. We used twenty-four T0 plants
Total RNA was extracted from broccoli leaves using an RNeasy Plant Mini Kit (Qiagen), according to the manu­facturer's instructions. Total RNA were reverse transcribed with Reflection™ Kit (ACTIVE MOTIF) and oligo (dT) following the enzyme manufacturer's instructions.
Cloning and identifying the broccoli HMG-I/Y gene
Primer pairs were designed to amplify the partial HMG-I/Y cDNA of broccoli through comparisons of NCBI blastn
(http://www.ncbi.nlm.nih.gov/BLAST/) alignments on HMG-I/Y cDNAs of Arabidopsis thali-ana (GenBank accession number CAA71797) and
LIN et al. ― Broccoli HMG-I/Y as reference for qRT-PCR
21
rapeseed (Brassica napus; GenBank accession number AAF22135). We then noted several conserved DNA sequences (Figure 2). Oligonucleotide primers: HMG-F, 5′- TATCCTCAGATGATCATGGAAGCGAT-3′; HMG-R, 5′- TCTTCGGCGGTCGTCCACGTGGCCT-3′ were designed to clone the broccoli HMG-I/Y partial sequence. Primers from the partial HMG-I/Y cDNA were then designed to conduct chromosome walking and RACE (Rapid amplification of cDNA ends) for full sequence determination.
RACE, chromosome walking and HMG-I/Y full sequence cloning
To get the full-length cDNA of the putative HMG-I/Y, gene specific primers (GSPs) and nested gene specific primers (NGSPs) were designed with HMG-I/Y partial sequence for 3′,5′ RACE according to FirstChoiceR RLM-RACE kit (Ambion) instructions. We used the GSPs and NGSPs as follows: 5′RACE: GSP1, 5′-GGGAGCAGGGATCGC AC-3′; NGSP1, 5′- CTTGGGCGGAGCATGTGGAT-3′; 3′RACE: GSP2, 5′-GGC ATCGCGAAGCACATC-3′; NGSP2, 5′-GCTGCTCAACTACCATCTCAACCA-3′.
The HMG-I/Y gene flanking region was determined using a GenomeWalkerTM Universal Kit (BD Biosciences Clontech) according to the manufacturer's instructions. Restriction endonucleases, Z)raI, EcoRV, Pvull and StuI were used to generate several DNA fragment libraries, which were separately ligated to corresponding adaptors. Adaptor-ligated genomic DNA fragment libraries were subjected to an initial round of polymerase chain reaction (PCR) amplification with the outer adaptor primer (AP1)
Figure 2. Broccoli HMG-I/Y full cDNA sequences (796 bp). The open reading frame is in black (576 bp), the 5'-untranslated region is in blue (63 bp), the 3'-untranslated region is in green (157 bp) and the poly(A) tail is in purple (13 bp). The grey un­derlined sites are primer sets in Weng et al. (2004) and the mis­matched bases are in lower case letters.
bean (Canavalia gladiata; BAA11766), rapeseed (B. napus; AAF22135), Arabidopsis (Arabidopsis thaliana; CAA71797), rice (Oryza sativa; XP_482501), oats (Avena sativa; AAA32718), soybean (Glycine max; Q00423), wheat (Triticum aestivum; AAM22691), pea (Pisum sa-tivum; CAA67752) along with broccoli (B. oleracea var. italica). The evolutionary distances were calculated by the Poisson correction method (Zuckerkandl and Paul­ing, 1965) and units are represented as the number of amino acid substitutions per site. The numbers in Figure 6 represent bootstrap percentages and the clustering significance was evaluated by bootstrap with 1,000 replications
(Felsenstein, 1985).
(5'-GTAATACGACTCACTATAGGGC-3')
and an outer gene-specific primer (5'GSP1) (5'-
CAAAGCTTATTCGGATTGCT-3') and (3'GSP1) (5'-CCCACACAGCTTCTCCTCACG-3'),
while an inner adaptor primer (AP2) (5'-
ACTATAGGGCACGCGTGGT-3') and in­ner gene-specific primer (5'GSP2) (5'-
GGCTTACGCAACAGGCACCATCACT-3') and (3'GSP2) (5'-CTCTCTGTGCGAATTCATGT-3') were
used for the second round of PCR amplification.
The amplified fragments were isolated, gel-purified us­ing the Gel-MTM Gel Extraction System (VIOGENE, Tai­pei, Taiwan, R.O.C.), cloned into a yT&A vector (Yeastern Biotech, Taipei, Taiwan, R.O.C.), and the inserts were sequenced entirely on both strands with M13 pairs by Mis­sion Biotech Co., Ltd. (Taipei, Taiwan, R.O.C.).
Southern hybridization for genomic determina­tion of ipt, HMG-I/Y and AtEMFI transgene in broccoli
A Southern assay on ipt transgenic inbred lines was previously demonstrated (Chan et al., 2009). In this study, genomic DNA was digested with HindIll (3-4U/^gDNA) and hybridized with respective probes DIG-labeled ipt and NPTII (Neomycine phosphotransferase II) based on similar procedures as in Chen et al. (2001) and Chan et al. (2009). To investigate the HMG-I/Y gene copy number in the broc­coli genome, genomic DNA of cultivars Green King and Elegance were digested with 5U/[igDNA each of BamHI, EcoRI, HindIll, Sad and Xhol, respectively, for Southern
Phylogenetic estimation on the known HMG-I/Y protein among plant species
We used the Neighbor-Joining method (Saitou and Nei, 1987) with MEGA4 (Molecular Evolution Analysis ver­sion 4.0) (Tamura et al., 2007) to estimate the phylogenetic trees of HMG-I/Y proteins based on the deduced amino acid sequences from GenBank (http://www.ncbi.nlm.nih. gov/BLAST/) for maize (Zea mays; CAB40848), sword-
22
Botanical Studies, Vol. 53, 2012
hybridization to confirm the copy number of HMG-I/Y gene. The digested genomic DNAs were fractionated on 1% agarose gels, transferred onto a nylon membrane and hybridized to DIG-labeled probes according to the Roche's instructions (Roche, Germany). The HMG-I/Y gene of genomic DNA was cloned into a yT&A vector (Yeastern Biotech, Taipei, Taiwan, R.O.C.) by PCR amplification us­ing (3'GSP2) (5'-CTCTCTGTGCGAATTCATGT-3') and (5'GSP1) (5'-CAAAGCTTATTCGGATTGCT-3') primers, and the HMG-I/Y probe was labeled with non-radioactive digoxigenin (DIG)-11-dUTP (Roche, Germany). The hy-bridization signal was visualized on x-ray film using an alkaline phosphatase anti-DIG-Fab conjugate in the pres-ence of a chemiluminescent substrate CDP-Star (Roche, Germany).
A similar method was used for transgene AtEMF-1 identification except that DIG labeling re­quired a 700 bp PCR AtEMF1 DNA probe ampli­fied by the primer set of forward AtEMF1-SF, 5'- CTTATTGAATGGGAAAAGGGTGGG-3' and reverse AtEMF1-SR, 5'-CTGTATTGATTAGGAACACTCTGG CA-3'.
Figure 3. PCR identification of broccoli-specific 76 bp HMG-I/Y fragment by HMG1-F and HMG1-R primer set on tested lines. M: 50 bp DNA ladder; 1: Green King; 2: Elegance; 3: 93-101; 4: 93-102; 5: 93-103; 6: 93-104; W: water control.
program: 2 min at 50°C, 10 min at 95°C, and 40 cycles of 15 s at 95°C and 1 min at 60°C. The fluorescence signals obtained were measured once for each cycle at the exten­sion step. The PCR results were then analyzed using ABI Prism 7000 SDS Software (Applied Biosystems, USA).
Oligonucleotide primers and probes
The oligonucleotide primers and TaqMan probes (Fig­ure 1, Table 1) were designed and synthesized by Ap­plied Biosystems (USA). The primer pairs for HMG1-F/HMG1-R, ipt-F/ipt-R, NPTII-F/NPTII-R and AtEMF1-F/AtEMF1-R are listed in Table 1. The TaqMan probes, HMG1-P for quantitative PCR, were designed to detect a 76 bp broccoli-specific fragment of HMG-I/Y (Figure 3) while in the ipt-P for a 75 bp fragment of transgene ipt, the NPTII-P for a 78 bp fragment of selection marker gene NPTII and another AtEMF1-P for a 72 bp fragment of transgene AtEMF1 , as indicated in Figure 1. The probes were labeled with fluorescent reporter dyes 5'-FAM and the nonfluorescent quencher NFQ at the 3'-end.
The PCR reaction volume of 20 μL contained 5 μL of template DNA, 1 μL of 20x primer pair and probe mix (Applied Biosystems, USA), 4 μL ddH2O and 10 μL of 2x TaqManR universal PCR Master mix (includes ROX as a passive reference) (Applied Biosystems, USA). The PCR reactions were run on an ABI 7000 Sequence Detection System (Applied Biosystems, USA), with the following
Transgenes and endogenous gene copy num­ber calculation
To calculate the number of transgene copies and copy number, we used the equation designed by Weng et al.
(2004) below:
[1] X0/R0 = 10[(C/T,XIX)/SX] – [(CT,RIR)/SR]
where IX and IR are intercepts of the relative standard curves of target and reference genes, respectively, SX and SR are the slopes of the standard curves of target and refer­ence genes, respectively, and CT,X and CT,R are the detected threshold cycles of the amplification of the target and ref­erence genes to a tested sample. If the copy number of the reference gene (R0) is well confirmed, the copy number of the target gene (X0) can easily be deduced from the Ix, Ir, SX, SR, CT,X, and CT,R in the tested sample.
The accurate number of target gene copies in the tested
Table 1. The primers and probes designed by ABI.

Gene

Primer1 (Sense)

Primer2 (Antisense)

TaqMan Probe

Length

HMG-I/Y

HMG1-F

HMG1-R

HMG1-P

76 bp
CGTCCTCCTAAGGTGAATGATTCTT
CTCGTGGCCTCCCAGAAA
FAM CACTCGGCGATACCTT NFQ*
Ipt
ipt-F
ipt-R
ipt-P
75 bp
GAGTGCAGATTTTCGTTGGCATATT
GCCTTGGCCGCTTTCATG
FAM CCGACCAAGAGACCTT NFQ*
NPTII
NPTII-F
NPTII-R
NPTII-P
78 bp
GGATTGCACGCAGGTTCTC
GCAGCCGATTGTCTGTTGTG
FAM CCCAGTCATAGCCGAATAG NFQ*
AtEMF1
AtEMFl-F
AtEMF1-R
AtEMF1-P
72 bp
GGAGAAAGTGGGTGTAAACTGTGA
CGACCACGTGCTTTCTTGAGAA
FAM TAGCTGTCTGATCATCATTC NFQ*

*NFQ: Non-fluorescent quencher.
LIN et al. ― Broccoli HMG-I/Y as reference for qRT-PCR
23
samples, Ix, Ir, Sx, and Sr in equation [1] can be deduced from relative standard curves of transgenic plants contain­ing the target and endogenous genes without knowing the exact number of target gene copies. To prepare the relative standard curves of three PCR reaction systems (endogenous gene HMG-I/Y and transgenes ipt, NPTII and AtEMF1 ) by 10-fold, were serially diluted its genomic DNA over four grades (12ng, 1.2ng, 0.12ng and 0.012ng for ipt/NPTII and 50ng, 5.0ng, 0.5ng and 0.05ng for AtEMF1 ) with each in duplicate. We were thus able to de­termine the standard curve correlation coefficients.
lecular mass of 20.78 kDa (Figure 4). The translational start site of the HMG-I/Y coding region (TTGAAATGGC) is very similar to that of the dicots consensus sequence (aaAa(A/C)ATGGC) (Cavener et al., 1991). We also com­pared the HMG-I/Y genomic DNA and cDNA that found a single intron (data not shown). This intron has a 89 bp in the broccoli HMG-I/Y gene, starts 45 bp downstream of the translation start site, follows the consensus (AG/ GT) at the 5' exon/intron boundary, but diverges (AG/AT) at the 3' end of the intron. The intron is located in exactly the same place as the single introns in the pea (Gupta et al., 1997), rapeseed (Masek et al., 2000) and Arabidopsis HMG-I/Y genes (Gupta et al., 1998). The protein is very similar to HMG-I/Y proteins from other plant species, with the highest similarity to B. napus (75% identity at the protein level).
RESULTS AND DISCUSSION
Cloning and identification of broccoli HMG-I/Y gene
Based on the comparison between the HMG-I/Y cDNA sequences of Arabidopsis and rapeseed, primer pairs were designed to amplify the partial HMG-I/Y cDNA from broccoli (Table 1). The partial HMG-I/Y cDNA sequence was aligned on NCBI Blastn, where we noted their high similarity to Arabidopsis and rapeseed HMG-I/Y genes (Data not show). We then designed some primers from partial HMG-I/Y cDNA to do chromosome walking and RACE (Rapid amplification of cDNA ends). Through chromosome walking and RACE we determined that 796 bp cDNA contains an open reading frame of 576 bp along with 63 bp of the 5'-untranslated region and 157 bp of the 3'-untranslated region exclusive of a 13 bp poly(A) tail (Figure 2). We deduced that the broccoli HMG-I/Y gene encodes a protein of 192 amino acid residues containing four copies of the AT-hook motif with a calculated mo-
The endogenous copy number of the broccoli HMG-I/Y gene was confirmed with Southern analyses, probing with DIG-labeled broccoli HMG-I/Y genomic DNA. As indi­cated in Figure 5, genomic DNA of two cultivars digested by BamH1, EcoRI, HindIll, Sad and Xhol all exhibited a single band pattern, and the single major band of hybrid­ization in each digest suggested it was a single copy of the HMG-I/Y gene in the broccoli genome.
Phylogenetic studies among plant species
In addition to the model plant Arabidopsis thaliana, we studied two Brassica species (B. oleracea var. italica and B. napus), three legume (Canavalia gladiate, Glycine max and Pisum sativum) and four Graminae (Oryza sa-tiva, Avena sativa, Triticum aestivum and Zea mays). The phylogenetic relationship of the deduced amino acid se-
Figure 4. Sequence alignment of B. oleracea HMG-I/Y protein (deduced from cDNA sequence) using the CLUSTALX program to A. thaliana, B. napus HMG-I/Y proteins. Gaps introduced to improve the alignment are shown as dashes (-). Color identical amino acids are black, and similar amino acids are light gray. The 'AT-hook' sequences are underlined.
24
Botanical Studies, Vol. 53, 2012
Table 2. Estimated numbers of ipt and NPTII copies for T4 transgenic ipt inbred line progeny from the qRT-PCR.
Sample
ipt
NPTII

(X/R )

Estimated number of copies

(X/R)
00

Estimated number of copies

93-101-A-4

0.39

0.5

0.58

0.5
93-101-A-9
0.76
1
0.97
1
93-101-A-15
0.43
0.5
0.48
0.5
93-101-A-23
0.96
1
1.21
1
93-101-A-35
0.45
0.5
0.49
0.5
93-102-3-20
0.82
1
1.26
1
93-102-4-12
0.78
1
1.04
1
93-102-1A-12
1.02
1
0.92
1
93-102-1A-26
0.97
1
1.09
1
93-102-2A-7
0.77
1
0.94
1
93-103-A-5
1.06
1
1.24
1
93-103-A-8
0.83
1
0.96
1
*93-103-A-17
1.73
0.95
1
93-103-A-26
1.14
1
1.23
1
93-103-A-27
0.98
1
1.18
1
Figure 5. Southern blot confirmed that HMG-I/Y gene is a single copy gene on two broccoli cultivars, Green King and Elegance.
M: DNA DIG-labeled Marker III (Roche); 1: BamHI digestion;
2: EcoRI digestion; 3: HindIII digestion; 4: Sad digestion; 5: XhoI digestion.
quences of the HMG-/Y gene were quite clear, with three distinct clusters as listed in Figure 6. Arabidopsis was clustered with the Brassica species and the three legume species clustered. Brassica species and the legumes are dicots, while the four Gramineae species, i.e. rice, maize, oat and wheat, are all monocots and form another group. The obtained results fit very well with the traditional taxo-nomic analyses.
Values of X0/R0 were calculated according to equation [1]. From standard curves of HMG-I/Y, ipt, and NPTII systems
(*Rearrangement).
Purity and copy number determination on ipt transgenic inbred lines by qRT-PCR and South­ern analysis.
Standard curves of reference gene HMG-I/Y and two linked transgene, ipt and selection marker gene NPTII, were established through plotting the threshold cycle (Ct) values vs a logarithm of template concentrations from four 10-fold serial dilutions. The slopes were -3.139, -3.414 and -3.283, respectively, for HMG-I/Y, ipt and NPTII, and interceptions were 28.369, 28.425 and 29.184. The X0/R0 were then calculated from the equation [1] (Weng et al., 2004) as described in the materials and methods. Both T4 and T5 ipt transgenic inbred lines were estimated for the ipt and NPTII copy numbers. Random samples from five progeny of each transgenic T4 inbred (sib-mated) indicated some heterozogosity. As indicated in Table 2, of the T4 progeny of line 93-101, 3/5 of the ipt-NPTII transgene were hemizogotes, line 93-102 had all 5 individual prog­eny as single copy/haploid genome for both genes and line 93-103 had one progeny, A-17, that resulted in 2 copies of ipt and 1 copy of the NPTII gene (showing rearrangement had taken place). The last four were single copy/ haploid
Figure 6. Evolutionary relationships of 10 known plant taxa including sword-bean (Canavalia gladiata, soybean (Glycine max), pea (Pisum sativum), Arabidopsis (Arabidopsis thaliana), broccoli (Brassica oleracea var. italica), rapeseed (Brassica na-pus), wheat (Triticum aestivum), oat (Avena sativd), maize (Zea mays) and rice (Oryza sativa) of HMG-I/Y proteins based on the deduced amino acid sequences searched from the GenBank as described in the materials and methods. The percentage of rep­licate trees in which the associated taxa clustered together in the bootstrap test (1000 replicates) are shown next to the branches. The scale on the bottom indicates the number of substitutions per amino acid site.
LIN et al. ― Broccoli HMG-I/Y as reference for qRT-PCR
25
genome for both ipt and NPTII transgenes. Transgene identification through traditional PCR was not feasible for distinguishing these hemizygous individuals among the selfed or sib-mating populations. In this study, we used the developed inbred lines on the T4 lines to check transgene zygosity. Hemizygous individuals and rearrangement oc­curred in lines 101 and 103, respectively. An explanation for the hemizygotes might be their accidental pollination by the non-transgenic progeny, as mentioned in the materi­als and methods. We noted the lack of pollen in some ipt transgenic inbred progeny, thus conducting sib-mating to
obtain the seeds for further study. However, through se­lection of T4 individuals with homozygous transgene we further self-pollinated for advance generation to derive the T5 inbred lines. The estimated result from the T5 progeny for the above three transgenic lines all exhibited an unique purity. We checked 20 progeny with regular PCR and ran­domly picked 10 individuals from each line for qRT-PCR and observed single copy/haploid genome for both ipt and NPTII transgenes (Table 3). The Southern confirma­tion had been proved elsewhere (Chan et al., 2009) from five random individuals selected from each T5 line. In this
Table 3. Estimated numbers of ipt and NPTII copy of ipt and NPTII for T5 transgenic ipt inbred line progeny from the qRT-PCR.


ipt


NPTII

Sample

(X0/R0)

Estimated number of copies

Southern blotting (HindIII)

(X0/R0)

Estimated number of copies

Southern blotting (HindIII)
95-101-58
0.93
1
1
0.91
1
1
95-101-59
1.02
1
1
0.89
1
1
95-101-60
1.07
1
1
1.05
1
1
95-101-71
0.99
1
1
0.95
1
1
95-101-72
0.99
1
1
1.01
1
1
95-101-73
0.93
1
1
0.95
1
1
95-101-263
1.08
1
1
0.98
1
1
95-101-265
1.06
1
1
0.88
1
1
95-101-266
1.03
1
1
0.97
1
1
95-101-300
1.05
1
1
1.01
1
1
95-102-1
0.96
1
1
0.99
1
1
95-102-2
1.04
1
1
1.08
1
1
95-102-3
0.96
1
1
0.99
1
1
95-102-15
0.96
1
1
1.12
1
1
95-102-16
0.99
1
1
1.19
1
1
95-102-17
1.03
1
1
1.04
1
1
95-102-27
0.88
1
1
0.95
1
1
95-102-37
1.14
1
1
1.08
1
1
95-102-201
1.00
1
1
1.05
1
1
95-102-204
0.99
1
1
1.10
1
1
95-103-1
1.08
1
1
1.02
1
1
95-103-2
0.97
1
1
1.05
1
1
95-103-3
1.10
1
1
1.01
1
1
95-103-11
1.01
1
1
1.04
1
1
95-103-13
0.98
1
1
0.88
1
1
95-103-23
0.96
1
1
0.91
1
1
95-103-24
0.90
1
1
0.94
1
1
95-103-31
0.99
1
1
1.04
1
1
95-103-32
0.93
1
1
0.98
1
1
95-103-33
1.08
1
1
1.14
1
1
aX0/R0 are calculated from equation[1], with slopes -3.239, -3.315, -3.319 and intercept 23.019, 23.216, 23.505 from the standard
curve of HMG-I/Y, ipt and NPTII respectively.
26
Botanical Studies, Vol. 53, 2012
study, the HindIII digested genomic DNAs of lines 101, 102 and 103 from each of five randomly selected individu­als within line also proved to be single insertion (Figure 7).
Copy number screening on the AtEMF-1 trans­gene by qRT-PCR and Southern confirmation
We also randomly selected 24 T0 transformants for AtEMF-endogenous 1 transgene determination. The rela­tive standard curves of 3 PCR reaction systems (gene HMG-I/Y and transgene AtEMFF) were established by 10­fold, serial dilution of its genomic DNA over four grades with each in duplicate and three repeated measurements. The correlation coefficients of the standard curves were good (0.999 for HMG-I/Y and: 0.997 for AtEMF1) and the PCR efficiencies were all above 0.95. Copy number estimation by qRT-PCR was then calculated according to equation [1], relative standard curves of three reaction systems determined slopes (Sx and Sr) and intercepts (Ix and IR) for the target genes AtEMF1 , and reference gene HMG-I/Y. The slopes for HMG-I/Y and AtEMF1 were -3.360 and -3.389, and the intercepts were 29.110 and 31.513, respectively (Figure 8). Relative standard curves allowed (AtEMF1) and q (HMG-I/Y) calculations for each transgenic plant tested. Each reaction had three replications. Because the transgenic lines in the T0 genera­tion are hemizygotes for transgenes and homozygotes for endogenous genes, the copy number of the target gene in T0 transformants should be calculated after the value of X0/R0 in equation [1] is doubled. The copy numbers of the AtEMF1 in primary broccoli transformants (T0) was calcu­lated by comparing quantitative PCR result of the AtEMF1
Figure 7. Transgene confirmation by Southern hybridization on transgene ipt and selection marker gene NPTII of transgenic T5 inbred progeny based on HindIII digestion and exhibiting the single insertion in the three tested lines each with five ran­domly selected individuals. M : DNA DIG-labeled marker III; P: pSG766 plasmid DNA; 1-5: individuals from 95-101 inbred line; 6-10: individuals from 95-102 inbred line; 11-15: individu­als from 95-103 inbred line.
Figure 8. Real-time PCR amplification of the logarithmic plots resulting from the amplifica­tion of four 10-fold serial dilutions (Genomic DNA:50ng, 5ng, 0.5ng, 0.05ng) of DNA from lines AtEMF1-03 and its relative standard curve, obtained with the threshold cycle (Ct) value versus the log of each initial concentra­tion on (A) HMG-I/Y gene; and (B) AtEMF1 gene.
LIN et al. ― Broccoli HMG-I/Y as reference for qRT-PCR
27
gene with the HMG-I/Y internal standard. We obtained the number of transgene AtEMF1 copies from 24 tested T0 transformants (Table 4).
As suggested by Ingham et al. (2001), samples with lower copies allowed better accuracy in the TagMan copy number assay. Lower copies of transgene insertion also simplified the explanation for transgene activity in trans-genic studies. Our goal for establishing the qRT-PCR was also aimed at screening lower copy transformants. At the sampling stage, we thus used the seven transgenic broccoli lines (from 24 transformants) with the lowest estimated copy numbers (using real-time PCR) and with enough leaf tissue for DNA extraction for Southern analyses. As shown in Figure 9 and Table 4, the results from the Southern blot­ting and real-time PCR analyses were consistent in six samples (86%) and differed in one (14%). However, we cannot rule out that the inconsistent one was incompletely digested.
In this study, we successfully developed a rapid and reliable TaqMan real-time PCR method for estimating
Figure 9. Southern blot confirmation of AtEMF1 Transgene based on the genomic DNA digestion of Eco RI. M: DNA Mo­lecular Weight Marker III (Roche); P: AtEMF1 plasmid DNA; 1: AtEMF1-03; 2: AtEMF1-05; 3: AtEMF1-10; 4: AtEMF1-13; 5: AtEMF1-14; 6: AtEMF1-23; 7: AtEMF1-24; G: Green king.
Table 4. Estimated numbers of AtEMF1 copies for each line from the qRT-PCR and Southern blot results.

Sample

(X0/R0)

Estimated of copies

number Southern blotting (EcoRI)

AtEMF1-03

1.82

2

2
AtEMF1-05
1.88
2
2
AtEMF1-10
4.55
4~5
3~4
AtEMF1-13
1.30
1
1
AtEMF1-14
1.33
1
1
AtEMF1-19
9.89
10
NDa
AtEMF1-23
1.31
1
1
AtEMF1-24
1.34
1
1
AtEMF1-30
3.32
3
ND
AtEMF1-31
5.08
5
ND
AtEMF1-33
1.01
1
ND
AtEMF1-36
34.67
35
ND
AtEMF1-37
1.81
2
ND
AtEMF1-38
1.80
2
ND
AtEMF1-39
1.88
2
ND
AtEMF1-41
7.02
7
ND
AtEMF1-45
2.06
2
ND
AtEMF1-51
3.24
3
ND
AtEMF1-52
3.16
3
ND
AtEMF1-58
4.05
4
ND
AtEMF1-61
3.03
3
ND
AtEMF1-62
1.21
1
ND
AtEMF1-79
15.13
15
ND
AtEMF1-74
13.98
14
ND

the number of integrated copies of a transgene in trans-genic broccoli. This method can be used as an alternative to Southern blotting. Southern blotting showed that the HMG-I/Y gene was present as a single copy in the broc­coli genome. We used TaqMan qRT-PCR systems and compared it to a novel broccoli endogenous reference gene coding for the HMG-I/Y gene to determine the copy numbers of the Arabidopsis embryonic flower 1 (AtEMFI) gene in transformed broccoli. We also found that this method can directly identify hemizygotes or homozygotes of the transgene in T1 plants. Homozygous transgenic plants can thus be obtained in the T1 generation, which can greatly reduce the time required to select the ideal plants for further breeding.
High-mobility group (HMG) proteins are known as low molecular weight non-histone proteins that commonly ex­ist in higher eukaryotic organisms (Bustin et al., 1990). The HMG-I/Y protein genes isolated from various plants such as rice, oats, Japanese jack bean, pea and Arabidop-sis have been noted (Gupta et al., 1997) and adopted as endogenous reference genes for transgene copy number determination in B. napus for qRT-PCR assays (Weng et al., 2005; Weng et al., 2004; Wu et al., 2010). Docu­mented occurances of HMG-I/Y in B. napus, however, have been somewhat controversial. HMG-I/Y cloned from a microspore-specific library of B. napus have expressed in all tissues, especially in pollen-derived embryos (Masek et al., 2000). We noted that four copies of the "AT-hook" motif had 62% homology with the Arabidopsis thaliana protein sequence. Our deduced protein sequence (Figure 4) showed similar conformation, having 75% homology with B. napus. However, the cloned B. napus HMG-I/Y protein genes were detected in closely related B. carinata,

aND: not determined.

28
Botanical Studies, Vol. 53, 2012
B. campestris var. chinesis and B. rapa species, but not in B. oleracea using Southern analysis with a HMG-I/Y cDNA probe (Masek et al., 2000; Weng et al., 2004). No amplification was observed when template DNAs from other species of Brassica or other species such as broc­coli, stem mustard, cauliflower, Chinese cabbage, cabbage, sprouts, Arabidopsis, carrot, tobacco, soybean, mung bean, tomato, pepper, eggplant, plum, wheat, maize, bar­ley, rice, lupine and sunflower (Weng et al., 2005) were used. As indicated by our comparison in Figure 2, the primer set designed by Weng et al. (2004), sense primer 5' GGTCGTCCTCCTAAGGC/tGAAA/tG 3' was located at positions 430-451 with mismatches at positions 446 and 450 (Figure 2 underlined). This appeared as "t" (shown in lower case for the ease of differentiation) in both positions for the broccoli HMG-I/Y full cDNA sequence, while the reverse primer 5' CTTCGC/aGGTCGTCCA/tC 3' located at positions 506-525. Here we found a mismatch on the HMG-I/Y sequence at position 507,"a" for broccoli and "T" for rapeseed, and at position 516, "t" for broccoli and "G" for rapeseed. The inability to detect the HMG-I/Y on broccoli in the study by Weng et al. (2004) might be due to the mismatched bases in the designed sense primer having two mismatched codes at the 3' end. However, Masek et al. (2000) used the cloned putative HMG-I/Y protein gene as a probe for Southern analyses, did not detect HMG-I/Y in B. oleracea either. B. oleracea had multiple origins and parents including B. oleracea var. gemmifera, B. olera-cea var. italica, B. oleracea var. botrytis, B. oleracea var. alboglabra, B. oleracea var. acephala, B. oleracea var. gongylodes, B. oleracea var. capitata, etc. The controver-sial results might also be due to the taxonomic differences among the research groups. However, it is clear from our study that broccoli carries the HMG-I/Y protein gene. Through comparison of five endogenous reference genes for specific PCR detection and quantification of B. napus, two sets of PCR primers for HMG-I/Y could be positively amplified in tested Brassica species, even from some dis-tant cruciferae species, including cultivars of B. oleracea such as cabbage (B. oleracea cv. Niuxin), Chinese kale (B. oleracea, ssp. albaglabra cv. Hongkong) and white Chi-nese kale (B. oleracea, ssp. cv. Tianjin) (Wu et al., 2010). Although, no direct tested sample of broccoli was in-volved, we cloned the HMG-I/Y from broccoli and proved it was a single copy in the broccoli genome (Figure 5). We also demonstrated the usefulness of designed primer sets in detecting the transgene copy number in transgenic populations.
and can be extended to the related B. oleracea species. The theoretical limitation of the TaqMan copy number as­say suggests fewer than four copies (Ingham et al., 2001). As noted in Table 4, the estimated copy numbers of the T0 transformant varied from single to multiple copies. This fit well with the collected low copy transgene samples that we selected from the Southern analysis.
Acknowledgements. This study was funded by research grants from the National Science and Technology Program for Agriculture Biotechnology, Department of Health, Ex­ecutive Yuan (DOH-96-FS-034) and Academia Sinica. We also extend gratitude to TARI's GMO core and isolation field members in Wu-Feng, Taiwan for field management and sample collection.
LITERATURE CITED
Battistini, E. and E. Noli. 2009. Real-time quantification of wild-type contaminants in glyphosate tolerant soybean. BMC
Biotechnol. 9: 16-25.
Beltran, J., H. Jaimes, M. Escheverry, Y Ladino, D. Lopez, M.C. Duque, P. Chavarriaga, and J. Tohme. 2009. Quantitative analysis of transgenes in cassava plants using real-time PCR technology. In Vitro Cell. Dev. Bio.-Plant 45: 48-56.
Chan, L.F., L.F.O. Chen, H.Y. Lu, C.H. Lin, H.C. Huang, M.Y
Ting, Y.M. Chang, C.Y. Lin, and M.T. Wu. 2009. Growth,
yield and shelf-life of isopentenyltransferase (ipt)-gene transformed broccoli. Can. J. Plant Sci. 89: 701-711.
Chen, L.F.O., J.Y. Hwang, Y.Y. Charng, C.W. Sun, and S.F. Yang. 2001. Transformation of broccoli (Brassica oleracea var. italica) with isopentenyltransferase gene via Agrobac-terium tumefaciens for post-harvest yellowing retardation.
Mol. Breed. 7: 243-257. Craig, W., D. Gargano, N. Scotti, T.T. Nguyen, N.T. Lao, T.A.
Kavanagh, P.J. Dix, and T. Cardi. 2005. Direct gene transfer in potato: A comparison of particle bombardment of leaf explants and PEG-mediated transformation of protoplasts.
Plant Cell Rep. 24: 603-611.
Ding, J., J. Jia, L. Yang, H. Wen, C. Zhang, W. Liu, and D. Zhang. 2004. Validation of a rice specific gene, sucrose phosphate synthase, used as the endogenous reference gene for qualitative and real-time quantitative PCR detection of transgenes. J. Agric. Food Chem. 52: 3372-3377.
Dixon, G.R. 2007. Vegetable Brassicas and related crucifers. CABI international Oxfordshire, UK.
Felsenstein, J. 1985. Confidence limits on phylogenies: An ap­proach using the bootstrap. Evolution 39: 783-791.
Flavell, R.B. 1994. Inactivation of gene expression in plants as a consequence of specific sequence duplication. Proc. Natl.
Acad. Sci. USA 91: 3490-3496.
Gawel, N.J. and R.L. Janet. 1991. A modified CTAB DNA ex­traction procedure for Musa and Ipomea. Plant Mol. Biol.
Rep. 9: 262-266.
Ginzinger, D.G. 2002. Gene quantification using real-time quan-
In this study, we first cloned the HMG-I/Y through chromosome walking and then designed proper primer sets for qRT-PCR study. The established system was first tested for detecting heterogenous transgenic lines and further examined the purity of advanced self-pollinated genera­tions screening on the T4 and T5 ipt transgenic inbred lines. We also demonstrated in our newly transgenic AtEMF1 study how to screen for low copy number transgenic trans-formants. The merit of the established system is that it rapidly identifies low transgene copy numbers in broccoli
LIN et al. ― Broccoli HMG-I/Y as reference for qRT-PCR
29
titative PCR: an emerging technology hits the mainstream. Exp. Hematol. 30: 503-512.
Gupta, R., C.I. Webster, A.R. Walker, and J.C. Gray. 1997. Chromosomal location and expression of the single-copy gene encoding high-mobility-group protein HMG-I/Y in Arabi-dopsis thaliana. Plant Mol. Biol. 34: 529-536.
Harikai, N., S. Satio, A. Tanaka, and K. Kinoshita. 2009. Deter­mination of unprocessed genetically modified soybean in food using simplex and duplex real-time PCR with an inter­nal standard. Intern. J. Food Sci. Technol. 44: 1778-1785.
Huang, H.Y. and T.M. Pan. 2004. Detection of genetically modi­fied maize MON810 and NK603 by multiplex and real-time polymerase chain reaction methods. J. Agri. Food Chem.
52: 3264-3268.
Huang, C.C. and T.M. Pan. 2005. Event-specific real-time detec­tion and quantification of genetically modified Roundup
Ready soybean. J. Agri. Food Chem. 53: 3833-3839.
Ingham, D.J., S. Beer, S. Money, and G. Hansen. 2001. Quanti­tative real-time PCR assay for determining transgene copy number in transformed plants. Biotechniques 31: 132-140.
Jame, C. 2009. Global status of commercialized biotech/GM
crops: 2009. ISAAA Brief No. 41. ISAAA: Ithaca NY.
Livak, K.J. and T.D. Schmittgen. 2001. Analysis of relative gene expression data using real-time quantitative PCR and the 2-AACT method. Methods 25: 402-408.
Masek, T., P. Smykal, I. Janotova, D. Honys, V. Capkova, and P.M. Pechan. 2000. Isolation of a Brassica napus L. cDNA encoding a putative high-mobility-group HMG I/Y protein.
Plant Sci. 159: 197-204.
Mason, G., P. Provero, A.M. Vaira, and G.P. Accotto. 2002. Esti­mating the number of integrations in transformed plants by quantitative real-time PCR. BMC Biotechnol. 2: 20-30.
Mirza, B. 2005. Influence of the T-DNA insertion region on transgene expression in Arabidopsis thaliana. Genetika 41:
1601-1607.
Omar, A.A., M.G.H. Dekkers, J.H. Graham, and J.W. Grosser. 2008. Estimation of transgene copy number in transformed citrus plants by quantitative multiplex real-time PCR. Bio-
technol. Prog. 24: 1241-1248.
Saitou, N. and M. Nei. 1987. The neighbor-joining method: A new method for reconstructing phylogenetic trees. Mol.
Biol. Evol. 4: 406-425.
Song, P., C.Q. Cai, M. Skokut, and B.D. Kosegi. 2002. Quantita­tive real-time PCR as a screening tool for estimating trans-gene copy number in WHISKERSTM-derived transgenic
maize. Plant Cell Rep. 20: 948-954. Tamura, K., J. Dudley, M. Nei, and S. Kumar. 2007. MEGA4:
Molecular Evolutionary Genetics Analysis (MEGA) soft­ware version 4.0. Mol. Biol. Evol. 24: 1596-1599.
Tang, W., R.J. Newton, and D.A. Weidner. 2007. Genetic trans­formation and gene silencing mediated by multiple copies of a transgene in eastern white pine. J. Exp. Bot. 58: 545­554.
Vaucheret, H., C. Beclin, T. Elmayan, F. Feuerbach, C. Godon, J.B. Morel, P. Mourrain, J.C. Palauqui, and S. Vernhettes. 1998. Transgene-induced gene silencing in plants. Plant J.
16: 651-659.
Weng, H., A. Pan, L. Yang, C. Zhang, Z. Liu, and D. Zhang. 2004. Estimating number of transgene copies in transgenic rapeseed by real-time PCR assay with HMG I/Y as an en­dogenous reference gene. Plant Mol. Biol. Rep. 22: 289­300
Weng, H., L. Yang, Z. Liu, J. Ding, A. Pan, and D. Zhang. 2005. A novel reference gene, high-mobility-group protein I/Y, can be used in qualitative and real-time quantitative PCR detection of transgenic rapeseed cultivars. J. AOAC Int. 88:
577-584.
Wu, G., L. Zhang, Y. Wu, Y. Cao, and C. Lu. 2010. Compari­son of five endogenous reference genes for specific PCR detection and quantitation of Brassica napus. J. Agri. Food
Chem. 58: 2812-2817.
Yang, L., J. Ding, C. Zhang, J. Jia, H. Weng, W. Liu, and D. Zhang. 2005. Estimating the copy number of transgenes in transformed rice by real-time quantitative PCR. Plant Cell Rep. 23: 759-763.
Yi, C.X., J. Zhang, K.M. Chan, X.K. Liu, and Y. Hong. 2008.
Quantitative real-time PCR assay to detect transgene copy number in cotton (Gossypium jirsutum). Analy. Biochem.
375: 150-152.
Zuckerkandl, E. and L. Pauling. 1965. Evolutionary divergence and convergence in proteins. In V. Bryson and H.J. Vogel (eds.), Evolving Genes and Proteins, Academic Press, New
York, pp. 97-166.
30
Botanical Studies, Vol. 53, 2012
青花菜高移動性蛋白群HMG-I/Y基因之選殖及提供為定量 Real-time PCR內生性標準估算轉基因套數之分析評估
林俊宏  黃家媛  陳榮芳
中央研究院植物暨微生物學研究所
植物基因轉殖技術已是作物改良不可或缺之工具,然一般亦知轉基因之嵌入基因組位置與轉基
因之套數關係著轉基因之表現與穩定性。TagMan定量式即時聚合酶連鎖反應(Quantitative real-time
Polymerase Chain Reaction, qRT-PCR)
係被發展出具若干優點如測試所需樣品量小、高流通量、高定量
範圍及無後PCR之膠體電泳分析等之快速檢定轉基因套數方法。惟此方法之分析有賴建立一在基因組
內低套數且穩定之內生性參考基因為基準。在蕓苔屬(Brassica)作物中,高移動性蛋白群HMG-I/Y
因曾被報導利用為qRT-PCR分析之參考基因,但該基因是否可在青花菜偵測得則有所爭議。本報告
因此乃參考已報導之油菜(Brassica napus)及阿拉伯芥HMG-I/Y基因序列選殖得一全長796 bp青花菜
HMG-I/Y cDNA序列並加以定性其衍生之胺基酸序列與油菜之相似度達75% 。利用已知作物HMG-I/Y
基因衍生胺基酸序列在演化樹分析上,其結果與傳統分類分群極為吻合。本研究亦証實HMG-I/Y基因
在青花菜基因組每單套基因組為單套存在,利用研究室之異戊丙烯轉移酶(ipt)基因及阿拉伯芥胚性開
花基因AtEMF1)青花菜轉殖材料進行檢測與篩選低套數轉基因,亦獲致該基因利用為內生性標準參考
基因以估算轉基因套數之可行性。
關鍵詞:定量式聚合酶連鎖反應;轉殖青花菜;阿拉伯芥胚性開花基因;異戊丙烯轉移酶基因。