Botanical Studies (2012) 53: 85-96.
PHYSIOLOGY
Upregulation of photosynthesis genes, and down-regulation of stress defense genes, is the response of Arabidopsis thaliana shoots to intraspecific competition
Matt GEISLER, David J. GIBSON, Kenneth J. LINDSEY1, Katherine MILLAR2, and Andrew J. WOOD*
Department of Plant Biology, Center for Ecology, Southern Illinois University-Carbondale, Carbondale, IL 62901-6509,
USA
(Received March 22, 2011; Accepted July 20, 2011)
ABSTRACT. Plants compete with each other for light, water, and soil nutrients. The extent to which gene expression is affected by the suite of biotic and abiotic stresses involved in competitive response is unknown but has relevance for our basic understanding of plant-plant interactions as well as experimental protocols when using model organisms. Arabidopsis was planted in isolated pots, or at low densities typically used in phenotypic and physiological characterization, at medium densities typical of bulk tissue and seed generation, and at high density typical of mutant screens. Biometric measures for growth and yield showed progressive reduction in inflorescence height, rosette diameter, biomass gain, and seed yield at medium and high densi­ties, and had approached the carrying capacity of our pots at high density. Shoot and leaf RNA was harvested for transcriptomic analysis. Genes involved in photosynthesis were upregulated in response to density stress, while those involved in abiotic stress response, secondary metabolism, and pathogen defense were strongly suppressed. There was significant overlap and correlation between gene expression in low and high densities. Arabidopsis survival strategy for intraspecific competition appears to be completely different to that for depri­vation of resources, biotic and abiotic stresses. Plants in these typical growth chamber conditions responded to competition by strongly up-regulating photosynthesis genes while shutting down stress response and pathogen defense pathways.
Keywords: Intraspecific competition; Metabolic reprogramming; Photosynthesis machinery; Stress response; Transcriptome.
Abbreviations: M-value, logarithm base 2 of the ratio of densely grown plants over individually grown plants; Oligo, oligonucleotide RNA; DNA, Ribo- and Deoxyribo-nucleic acid; CAB, Chlorophyll A/B binding protein; PDF, Plant defensin protein; SEN1: Senescence associated protein, also known as DIN1 (dark induc-ible protein); SA, Salicylic acid; JA, Jasmonic acid.
Footnotes: Raw microarray results have been deposited with Gene Expression Omnibus (http://www.ncbi.nlm.
nih.gov/geo/
)
INTRODUCTION
Competition is historically the most widely studied plant-plant interaction (Clements et al., 1929; Grace and Tilman, 1990; Keddy, 2001). However, while there are numerous observational and experimental studies of plant competition (Goldberg and Barton, 1992), and theories

*Corresponding author: E-mail: wood@plant.siu.edu; Tel: (618) 453-5609; Fax: (618) 453-3441.
1Current address: P.O. Box 1176 Waimea, HI 96796, USA.
2Current address: E-mail: millark2@muohio.edu; Depart­ment of Botany, Miami University 700 East high street, Oxford Ohio 45056, USA.
conceptualizing the importance of competition in natu­ral communities and agricultural systems (Grime, 1979; Tilman, 1982; Tow and Lazenby, 2001), the mechanisms involved and particular resources acting as intermediaries are often poorly understood (Goldberg and Landa, 1991). Indeed, there is increasing evidence that the interactions in plant communities involve complex additive and non-additive effects among the competing species (Weigelt et al., 2006). Nevertheless, while it is clear that competition can involve plant-based allocation tradeoffs to maximize resource acquisition that interact with other processes (e.g., herbivory, nutrient stress; Bonser and Reader, 1995; Craine, 2009), the genomic basis for these interactions, even in relatively simple communities where intraspecific interactions dominate is largely unknown. Genomic tech-
86
Botanical Studies, Vol. 53, 2012
niques, including microarrays allow genomic profiling of plants under stress (Leakey et al., 2009), including the response to relatively simple abiotic stressors (Travers et al., 2007, 2009) and other ecological issues (Thomas and Klaper, 2004) to be quantified. This approach has only recently been used to investigate the complex allocation-based genomic response to competitive stress that can in­volve multiple biotic and abiotic factors (Broz et al., 2008; Schmidt and Baldwin, 2009).
Studies of the genes involved in stress perception, growth and development often disregard the effects of in-traspecific competition on gene expression. While experi­mental protocols for studying plant competition emphasize the importance of plant density (Gibson et al., 1999; Gib­son, 2002), in molecular physiology studies, often involv­ing the model plant Arabidopsis thaliana, planting density is often not a measured parameter, is not controlled for, and is often not even reported except in studies specifically involving competition (e.g., Cahill et al., 2005). Arabidop-sis shows clear ontological changes when crowded (Ohto et al., 2001; Purves and Law, 2002; Alwerdt et al., 2006; Cahill et al., 2005; Mutic and Wolf, 2007) which implies changes to developmental genes, and indicates competi-tion for the limited resources of a small pot or low (100 uM) light source typical in many experiments. The effect of intraspecific competition on gene expression is often disregarded in traditional molecular biology and physiol-ogy studies, despite its clear importance.
In this study we investigate the effect of intraspecific competition on gene expression in Arabidopsis and estab­lish density protocols suitable for physiological studies. We show that large numbers of genes are differentially ex­pressed during crowding, particularly the conditions typi­cal of an Arabidopsis experiment.
MATERIALS AND METHODS
Planting density in soil
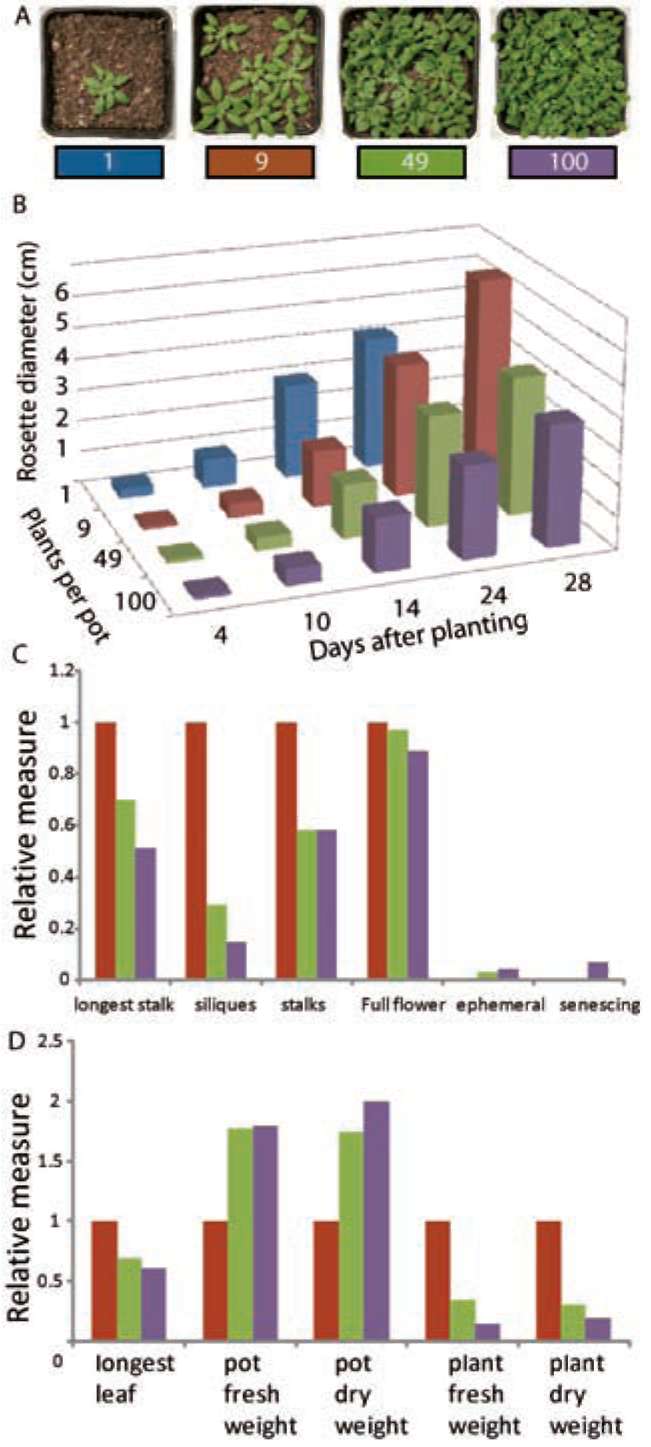
Seeds of Arabidopsis thaliana ecotype Columbia were sowed in potting soil (Miracle-Gro® Moisture Control® Potting Mix; made from peat moss, coconut fibers, com­post, perlite, and slow release fertilizer). Soil nutrients (from manufacturer's specifications) were 0.12% ammo­nium, 0.08% nitrate, 0.07% available phosphate, 0.14% soluble potash, and coated slow release components pro­vided 0.15% nitrogen, 0.03% phosphate, and 0.08% pot­ash. Each pot was 6cm x 8cm x 8cm with 380 ml volume of soil. Pots were well watered (daily or every other day) so that the soil was not allowed to dry out. At the time of RNA harvest, none of the pots were fully colonized (roots had not appeared at bottom of the pot). Four planting den­sities were applied: isolated (1 plant per pot), low (9 plants per pot), medium (49 plants per pot) and high (100 plants per pot) density (Figure 1A). There were three replicate pots per density giving a total of 12 pots. The "low pot" depicted contains 7 plants due to seedling death prior to day 10, and was included in the biometric measurements
(see below). A replicate "low pot" containing 9 evenly spaced plants was used for RNA extraction (see below). Following Alwerdt et al. (2006), we expected to observe competitive effects at and above 9 plants per pot. A plas­tic sheet with a regular grid of holes (3x3, 7x7, or 10x10 grids per sheet) was used in planting to assure the seeds were sown equidistant from each other and from the pot edge. In the pots where plants were grown in isolation the rosette covered the entire pot at maturity. At low density, leaves between plants began to touch and overlap shortly after the 14th day after planting, while at medium and high density, plants had overlapping leaves after 4-6 days. Pots were placed in a growth chamber (Percival) with constant humidity (60-70%) and temperature ((22C), 16 hour days and low ambient light level (100 faM). Replicate pots with different levels of competition were interspersed within the growth chamber using a completely randomized design to prevent a location effect on growth. The remaining plants were allowed to complete their life cycle for additional biometric measurements (Figure 1C and D). Note that all plants grown at a density of 1 per pot were harvested, and thus no additional biometric data was collected for these. The entire experiment (i.e. 12 pots) was repeated twice with essentially identical results.
Biometric measurements
In order to compare vegetative growth, rosette diameter was measured on the 4th, 10th, 14th, 24th, and 28th days after planting. On the final day, fresh biomass and dry biomass of a plant, fresh and dry pot biomass (all aboveground organs) were measured. The fresh and dry pot biomass of the plants were based on the average weight of ten plants and the average fresh and dry weight of each plant in the pot based on the number of plants surviving to adulthood. Biomass measurements were taken from both vegetative and reproductive plant material. Dry biomass was obtained by collecting all aerial parts of the plants in each pot and placing them in a paper sack in a drying oven at 40°C for 3 days.
To compare reproductive growth, the height of the lon­gest inflorescence stalk (i.e. stem), total number of siliques (per plant) and total number of inflorescence stalks (per plant) were measured. It was noted that in the low - high density pots, a number of flowers produced no siliques and a number of the stalks produced no flowers. At medium and high densities several plants (classified as ephemeral) did not bear any seeds and some had begun pre-mature senescence (chlorosis and necrosis evident in all aerial organs). Biometric data on rosette diameter were analyzed using a repeated measures mixed model in SAS 9.1.3 (Proc Mixed, SAS Institute Inc, 2002-2003) with days since planting as the within-subject factor, density as the be-tween-subject factor, experimental pot as the subject, and a spatial power law designated for the covariance structure to account for unequally spaced repeated measures (Littell et al., 2006). Post-hoc means separation tests of significant treatment effects (i.e., density) were conducted on least-squares means. One-way ANOVA were used to test for the
GEISLER et al. ― Arabidopsis intraspecific competition
87
effects of density on longest leaf length at final harvest.
RNA extraction
Total RNA was extracted from the aboveground parts of several pooled plants from one pot (for a total of about 1 gram tissue) grown 27 days at each density using a method modified from Carpenter and Simon (1999). RNA qual­ity was verified using spectrophotometric absorbtion and looking for rRNA band integrity on a horizontal agarose gel. Pooled RNAs were sent (shipped on dry ice) for mi-croarray analysis using the Arabidopsis microarray service at the Department of Plant Sciences in the University of Arizona (http://ag.arizona.edu/microarray/).
Microarray
The RNA was hybridized to a 29,110 longmer probe Arabidopsis oligonucleotide microarray (using Operon AROS Version 3.0; 70mer oligos) on two double dye chips (mild density vs single plant; strongstrong density vs single plant) at the microarray facility in the University of Arizona. The Array-Ready Oligo SetTM for the A. thaliana genome array (version 3.0, Operon) represents 26,173 protein-encoding genes, 28,964 protein-coding gene tran­scripts, and 87 microRNA genes from A. thaliana col. Pseudogenes are not included in the oligo design. This is the most comprehensive plant microarray yet available, and represents every known Arabidopsis gene, and pro­vides a complete picture of the Arabidopsis transcriptome. We were able to profile the transcriptomes of Arabidopsis plants grown at 3 planting densities (1, 9, 100 plants per pot), and found a striking and consistent pattern of induced and suppressed genes.
Transcriptomic data analysis
Chip image analysis was done by the facility using Gene-Pix Pro software, and subsequent analysis was done by the authors using TIGR Multi-array Viewer (MeV 4.0; Saeed et al. 2003) and MS Excel to calculate median spot intensities and the probability (P) value for differential expression. Individual spot intensities were globally nor­malized, and the M-value (logarithm base 2 of the ratio) of intense and low density vs. isolated plants was calcu­lated and globally centered. This normalization assumed expression m-values were normally distributed, and that most genes did not change expression. To verify these as­sumptions, a histogram of gene expression was plotted, and both intense vs. isolated and low (without background subtraction) vs. isolated looked normally distributed with a clear single peak (normalized and raw intensity data in Supplemental file 1 and 2).
Background intensities on the microarray with RNA from plants grown at low density were high due to poor washing of cy3 dye from the regions between spots on the chip; however the spots themselves looked normal, so a second median spot intensity was calculated without background subtraction as suggested by Wit and McClure (2004). Subtracting the high background from the low
vs. isolated flattened and distorted the histogram, and po­tentially useful data from many genes vanished. Analysis proceeded using both unaltered and background subtracted values for low density.
Meta-comparison of stress response transcrip-tomic data
Transcriptomics data were taken from the Nottingham Arabidopsis Science Centre (www.arabidopsis.info) and globally normalized, scaled and statistically analyzed for detectable expression (t-test vs. negative control) and sig­nificant ratios (t-test vs. control experiment). in particular, we compared analytically our competition transcriptome profiles with those in Arabidopsis in nutrient deficiency (low N, low K, low P; experiments NASC022, NASC105, NASC136), -pathogen stress (bacterial, fungal; NASC123, NASC340), light stress (light quantity; NASC), water stress (drought, salt, mannitol; NASC141, NASC140, NASC139), other abiotic stresses (heat, peroxide, touch; NASC146, NASC338, NASC145), hormone applications (SA, JA, ABA, BR, ET, IAA, GA, CK; NASC177-188, NASC081), early flowering mutants and different photo-periods (SD, LD, circadian clock, NASC153, NASC124, NASC108).
Our analysis tools included (1) Analysis of microarray dataset by linear regression (Pearson's correlation), (2) Cluster analysis of genes responding to mild and intense competition, (3) Placement of genes into regulons (sub­sets of co-expressed genes) and analysis of metabolic and tissue/cell specific compartments used the software tool MapMan (Thimm et al., 2004). Cluster analysis was done by using Hierarchical and k-means expression clustering and cluster analysis of different stress types, which other stress (stresses) best resemble competition stress in terms of genome expression profile in Cluster 3.0 (Eisen et al., 1998; De Hoon et al., 2004). Placement of regulons ren­dered the information of metabolic and developmental pathways where competition expressed genes fell into and what pathways have been shut down (i.e. suppressed) by intraspecific competition stress.
Transcriptomic data display in metabolic path­ways and processes
MapMan (Thimm et al., 2004) was used to display our transcriptomic data and meta-comparison of stress re­sponse transcriptomic data onto currently known diagrams of metabolic pathways and biological processes. Two color scale schemes were used to display suppression (red) or induction (blue). MapMan ImageAnnotator (version 2.1.1) was used to generate images from gene expression data.
RESULTS
The phenotype of crowding: morphological changes due to competition
After sowing imbibed and vernalized seeds of wild type Arabidopsis plants (Columbia-0 ecotype) in damp soil,
88
Botanical Studies, Vol. 53, 2012
the growth and overall phenotype of plants were recorded over a 6 week growing period. The soil chosen for this ex­periment was a typical potting soil and had a combination of rich mineral and organic nutrient sources (see methods) and slow release fertilizer beads which provide soil ni­trogen, phosphorus and potassium. There was no obvious difference in germination, and no obvious difference in early growth or morphology of young seedlings among densities. Density treatments significantly affected vegeta­tive growth as measured by rosette diameter (Density x time interaction, Fs"= 3.44, p = 0.0097) (Figure 1B) and longest leaf length ^=10.90, p = 0.0034) (Figure 1C). By 10 days after planting, there was significant reduction in growth of plants at low density and higher in compari­son to isolated plants (lsmeans, td^2=4.58, p = 0.0002). By the end of the experiment, most plants had produced inflorescences with siliques, although there were obvious differences in inflorescence shape, number and size in the crowded pots. Inflorescences on the plants in the most crowded pots tended to have few or no branches (Figure 1C), were smaller and thinner in diameter, but remained vertical. In low density pots or when grown in isolation,
Figure 1. Intraspecific competition effect on Arabidopsis growth. A: Arabidopsis plants at 27 days imaged prior to RNA harvest. Numbers indicate seeds sown on day 1 on a regular grid. B: Average rosette diameter for 4 different planting densities. Individual average measurements per plant taken at 54 days post germination in C and D. Measurements are scored on a relative scale in comparison to 9 plants per pot (red bars). These mea­surements include length of longest stalk, number of siliques and stalks per plant, percentage of full flowering plants, those that are ephemeral or senescing in C. Length of longest leaf of the rosette, fresh and dry weight of all aboveground biomass of all plants in each pot, and the average plant aboveground biomass in D. Some pots have fewer plants than the indicated by "seed sown number" due to seedling death.
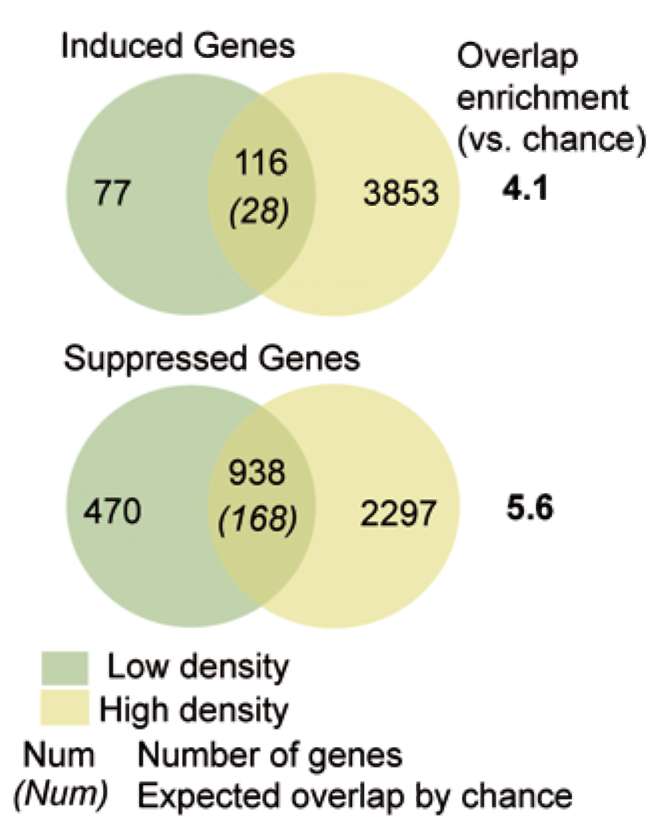
Figure 2. Overlap of genes induced and suppressed by low and high intraspecific competition in Arabidopsis. Upper panel: numbers indicate total genes induced (2 fold or greater vs. iso­lated plants) by plants in low (9 plants per pot; green circle) and high (100 plants per pot; yellow) density. Numbers in overlap­ping region indicate observed genes common to both low and high density, and the expected overlap due to chance alone (ital­ics). Bold numbers to the right are the ratios of observed overlap divided by expected. Lower panel: 2-fold suppressed genes.
GEISLER et al. ― Arabidopsis intraspecific competition
89
inflorescences were highly branched, thicker in diameter, and tended to lodge due to the weight of the branches. A harvesting of all aboveground tissue and final measure­ments were taken at 54 days post-planting. The total fresh biomass of all plants in the pot reached a maximum where the combined mass of plants in the medium density pots was roughly 6.4 times larger than that of plants grown at low density. Individually these crowded plants were about 10 times smaller than those grown in isolation (Figure 1D). The population of plants in each crowded pot was not homogeneous, many of the plants in these pots remained very small and produced ephemeral inflorescences with no viable seeds, others produced sharply reduced yields of seeds, which were smaller, darker in color and more dust-like than seeds grown by non-crowded plants. Not all plants survived in each treatment, and there was no re­planting of dead plants. Plant mortality was significant at medium and high density, where up to 15% of plants died before setting seed.
Genes expressed during competition
The global transcriptional response of Arabidopsis plants to intraspecific competition was evaluated using full genome oligo-based microarrays at low density (i.e. 9 plants per pot). 222 genes were identified as strongly (>2 fold) and significantly (Bonferroni corrected P-value <0.05) induced, and 751 genes were similarly suppressed.
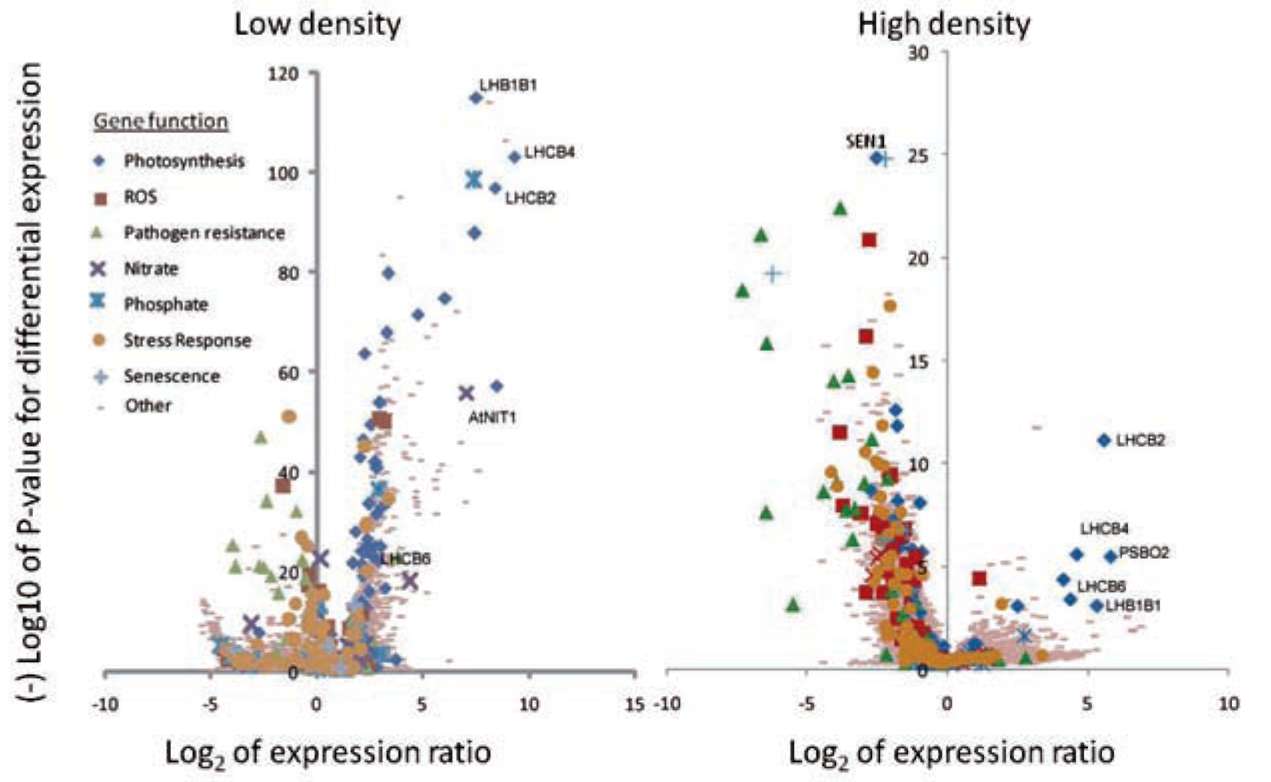
At high density (100 plants per pot), many of the same genes were similarly but more strongly regulated (i.e. greater M-values), especially those genes suppressed by competition (Table 1). Genes induced and genes sup­pressed (>2 fold) by light and strong competition signifi­cantly overlapped when compared to randomly selected genes (Figure 2, full transcriptome data in Supplementary file 3). The m-values of all genes in low and high densities were plotted as X vs. Y, and showed a strongly significant linear correlation, with a Pearson regression coefficient (R value) of 0.56. Such an overlap of genes is similar to that found in weak vs. strong abiotic stresses, and would be expected if the genes involved in recognition of crowd­ing and any subsequent adaptive strategy were similar but activated to different degrees. The 116 genes induced and 938 genes suppressed in both densities represent the regu-lon (group of co-regulated genes) of the transcriptional reaction to intraspecific competition. A significant num­ber of the genes most strongly and significantly induced were involved in photosynthesis in the light harvesting complex (CAB genes), the Calvin cycle, and carbonic anhydrases involved in the metabolism of dissolved car­bonate (Table 1; Figure 3, right half of volcano). Genes involved in abiotic stress and reactive oxygen signaling, pathogen defense, and wall modification were significantly suppressed in both densities (Table 1), with significantly increased suppression at high density (Table 1; Figure 3,
Table 1. Log ratio (M-value) of top 10 genes induced or suppressed by intraspecific competition in Arabidopsis.
Identifier
Description
Low mvalue
High mvalue
At5g01530
chlorophyll A-B binding protein CP29 (LHCB4)*
6.4
5.2
At3g50820
extrinsic subunit of photosystem II*
5.1
5.7
At3g27690
Lhcb2.4. light-harvesting antenna*
5.2
5.5
At3g44310
NIT1; indole-acetic acid biosynthesis
2.6
6.7
At2g34430
Type I chlorophyll a/b-binding protein*
4.6
4.5
At5g03240
ubiquitin UBQ3
2.7
6.2
At2g18020
EMBRYO DEFECTIVE 2296; ribosome L8-1
4.7
4.2
At2g05070
Lhcb2.2. light-harvesting antenna*
4.7
4.1
At4g38550
phospholipase-like
1.8
6.4
At2g26560
lipid acyl hydrolase accumulates upon infection by fungal and bacterial pathogensj
-2.7
-4.0
At4g02520
glutathione transferase (phi class)
-2.3
-4.4
At5g07000
sulfotransferase family
-2.4
-4.6
At2g38530
Lipid transfer proteins. Stress and pathogen-induciblej
-3.4
-4.4
At2g26010
plant defensin 1.3J
-3.6
-5.4
At4g35770
Senescence-associated genej
-3.1
-6.2
At5g44430
plant defensin 1.2cJ
-3.4
-6.4
At2g26020
plant defensin 1.2bJ
-3.4
-6.4
At1g75830
Cysteine-rich antifungal protein 1 precursor (AFP1) J
-3.3
-6.6
At5g44420
ethylene- and jasmonate-responsive plant defensin:
-3.9
-7.2
*Genes involved in photosynthesis, J Genes involved in biotic/abiotic stress defense. Mvalue is log base 2 of the ratio of low or high density plants vs. isolated plants.
90
Botanical Studies, Vol. 53, 2012
Figure 3. Volcano plots of the transcriptome of Arabidopsis plants. Low (9 plants per pot) and high (100 plants per pot) intraspecific competition. Each point represents a single gene which is suppressed (left of Y-axis) or induced (right of Y-axis). Genes involved in known biological processes from the Gene Ontology database were given special symbols as shown in the legend. Expression ratio (X-axis) was calculated as expression value in competing plants over that in isolated plants (1 plant per pot). The P-value for differ­ential expression significance was calculated from a one tailed T-test of the pixel brightness for 80 pixels scored on each microarray corresponding to that gene. Key genes discussed in the text: LHC = light harvesting complex; PSB= photosystem subunit; AtNIT = nitrilase; SEN1 = senescence associated gene 1.
left half of volcano plot). Notably, SEN1 (At4g35770) and several members of the plant defensin (PDF) gene family PDF1.1 (At1g75830), PDF1.2 (At5g44420), PDF1.2b (At2g26020), PDF1.2c (At5g44430) and PDF1.3 (At2g26010). Genes involved in nitrogen uptake and me-tabolism were slightly induced in low density, but strongly suppressed at high densities, genes involved in phosphate uptake and metabolism were not significantly affected.
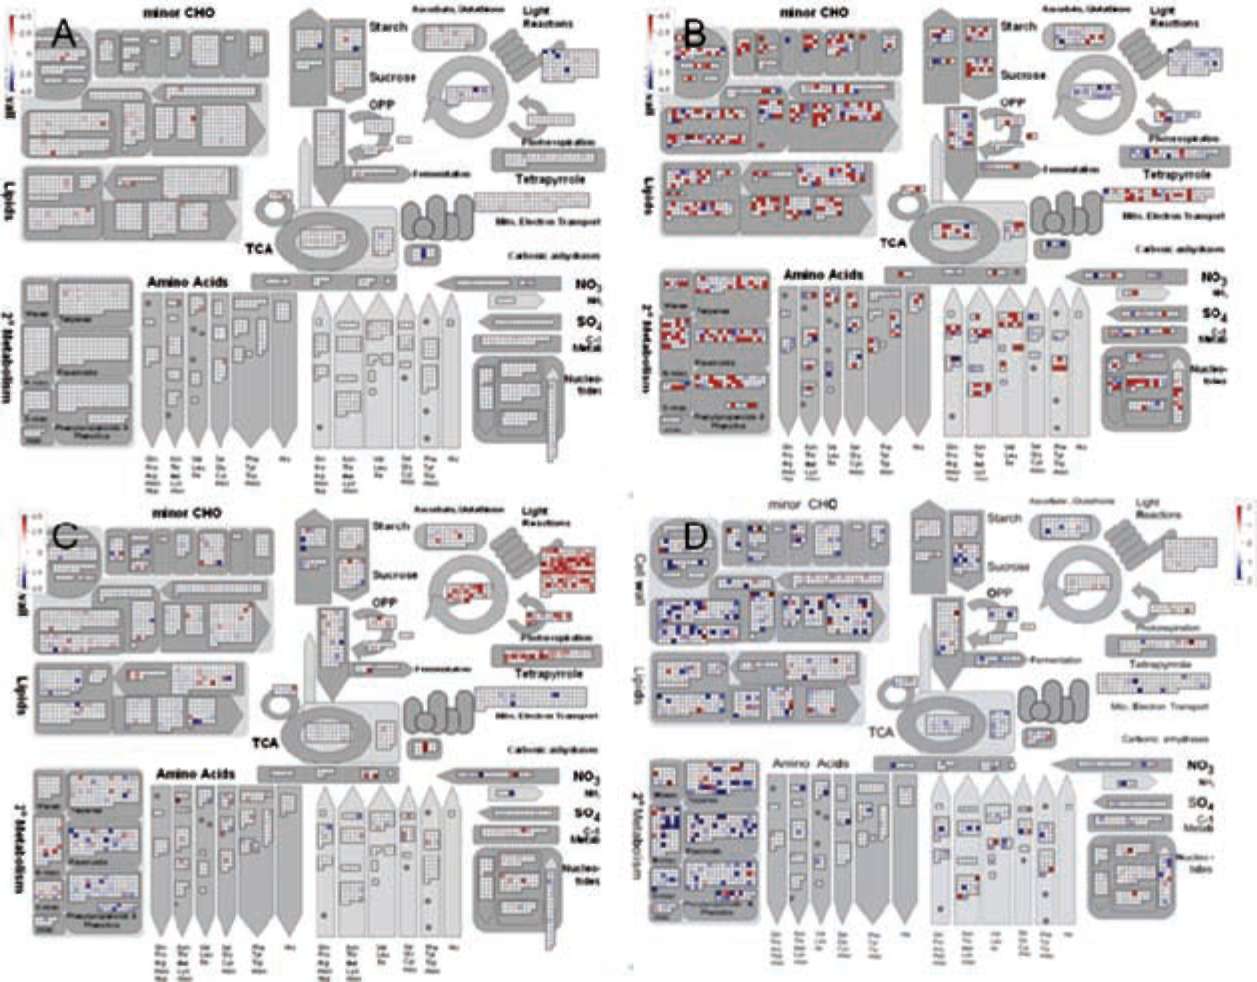
Genes were grouped into 861 different biological roles using MAPMAN (version 2.1.1; Thimm et al., 2004). Only 19 of these groups showed significant differential regulation using the wilcoxon rank sum test (Figure 4). Groups of genes involved in photosynthesis, ABC type and metal ion transporters were significantly upregulated. Genes involved in the regulation of active oxygen spe­cies (peroxides and superoxides) and the mitochondrial electron transport machinery (which is a major source of active oxygen) were strongly and almost universally sup­pressed in both low and high densities. Pathways involved in hormone mediated biotic and abiotic stress perception were significantly suppressed in low density, and strongly regulated (different genes strongly induced or suppressed) in high density plants indicating that some stress pathways were being activated.
Comparison of intraspecific competition to other biotic and abiotic stresses
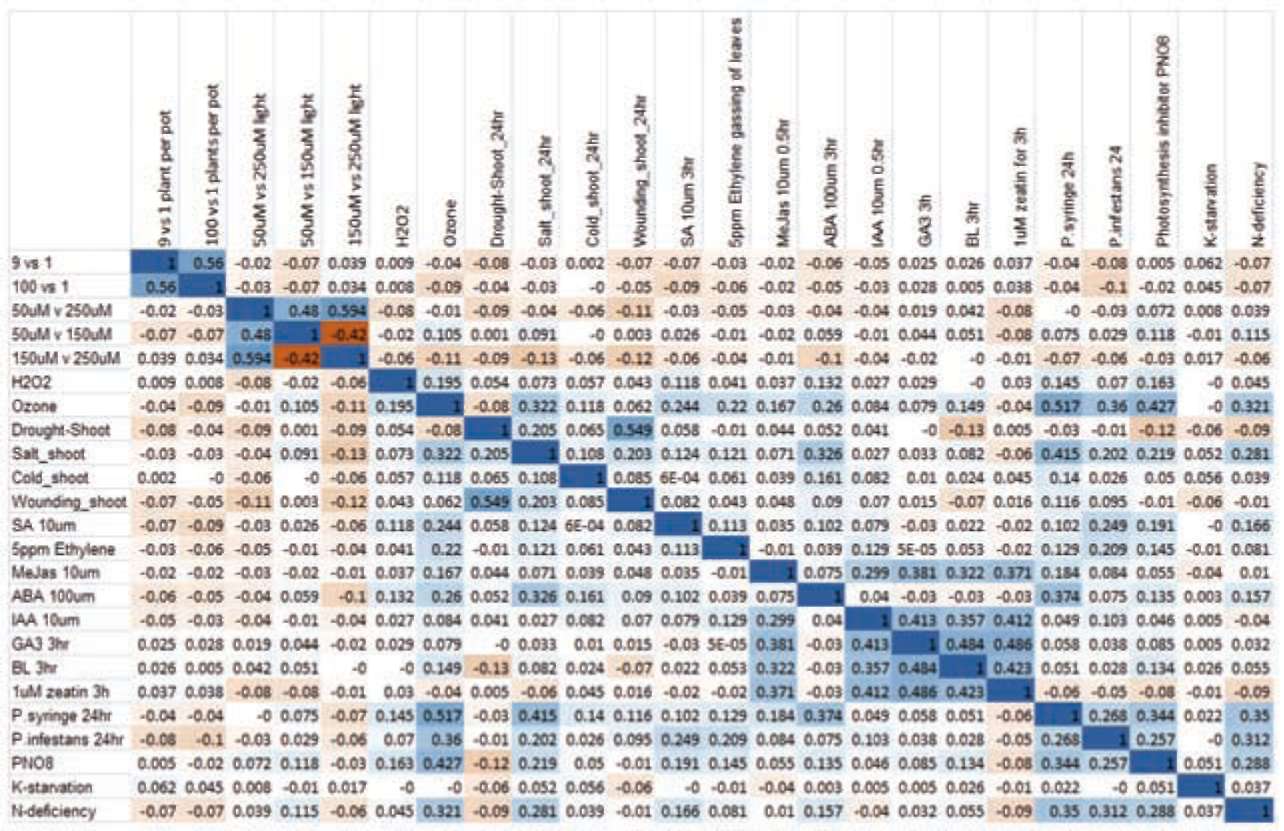
Plants in the same physical environment will presum­ably begin to compete for resources such as water, soil nutrients and light. Similarly, plants sensing each other's presence might activate a mechanism similar to that of a biotic stress, i.e. activating JA and SA pathways and producing allelopathic secondary compounds. We com­pared gene expression profiles of plants experiencing a wide range of individual biotic and abiotic stresses from previously published results including plants experienc­ing energy (sunlight) and mineral nutrient starvation, heat, wounding and cold stress, and pathogen infection (Figure 5). The expression profiles were globally normalized and an m-value was generated for each gene from each mi-croarray in a large matrix. Each pair wise combination of microarrays was plotted (not shown) and linear regression was used to calculate the Pearson correlation coefficient for each treatment pair. Only genes which were present on all microarrays were retained (21618 genes total). A number of stresses produced overlapping transcriptomes as shown by a significant correlation coefficient (Figure 5, blue shading). For example, N-deficiency is positively cor­related with "ozone treatment", "salt treatment -shoots-24 hrs", "P syringe treatment 24 hrs", "P infestans treatment
GEISLER et al. ― Arabidopsis intraspecific competition
91
24hrs" and "Photosynthesis inhibitor PNO8". The genes differentially expressed by plants undergoing intraspecific completion however (9 and 100 plants per pot) were not significantly correlated with any other analyzed transcrip-tome; however in contrast to other abiotic and biotic stress responses, the correlation matrix revealed high correlation (Pearson regression coefficient R value = 0.56) between low (9 plants per pot) and high (100 plants per pot) compe­tition treatments (Figure 5; Figure 2). Similar results were seen with "50 um vs. 100 um light" and "50 um vs. 250 um light―the stress treatments were positively correlated to each other but not any other analyzed transcriptome. In­terestingly, "K-starvation" was not significantly correlated with any other analyzed transcriptomes.
Stress perception and response pathways, normally upregulated by biotic and abiotic stress were actively shut down in plants experiencing strong intraspecific competi­tion, along with much of secondary metabolism and oxida-tive stress repair (Figure 4). There was strong induction of genes involved in both light capture and carbon fixing
pathways of photosynthesis, including chlorophyll antenna genes, and carbonic anhydrase (Figure 4). These genes are usually down-regulated by biotic and abiotic stresses, and taken together this suggests a strategy of outgrowing intraspecific competitors rather than treating competition like a typical plant stress.
DISCUSSION
We show that the degree of crowding of Arabidopsis plants is important as there was a difference in the pheno-types of isolated plants and plants grown at low, medium, and high densities confirming our earlier study (Alwerdt et al., 2006) and those of others (Cahill et al., 2005). Perhaps most surprising were the biological roles of the genes that were differentially expressed in intraspecifically compet­ing plants. Rather than mimicking a biotic stress or a nu­trient deprivation response, plants competing, even those dying of competition stress, underwent a strong metabolic reprogramming geared to maximize photosynthesis and
Figure 4. A comparison of major metabolic pathway expression using MapMan. A: Planting density of 9 plants per pot. B: 100 plants per pot. C: Nitrogen starved. D: Shoots sampled 24 hrs after wounding. Red squares indicate genes suppressed in comparison to iso­lated or untreated plants. Blue squares indicate genes induced. Genes belonging to different biological processes are located in differ­ent regions of the metabolism map as indicated. MapMan ImageAnnotator version 2.1.1 was used to generate these images from gene expression data.
92
Botanical Studies, Vol. 53, 2012
Figure 5. Comparison of competitive stress to other biotic and abiotic stresses. Each row and column represents a microarray based experiment in which plants were subjected to different planting densities (e.g. 1,9,100 plants per pot in this experiment), different light levels (50, 150, 250 uM), abiotic stresses (peroxide, ozone, drought, salt, cold, wounding, etc), biotic stresses (Pseudomonas syringe or Phytopathora infestans infection), the phytohormones abscisic acid, auxin, gibberilin, brassinolide, cytokinin, ethylene, jasmonic acid, and salicylic acid, or starvation of potassium and nitrogen. Microarray experiments used for comparison were taken from public archives, and globally normalized for cross-microarray comparison (see methods). The numbers in each cell represent a pair wise cal­culation of the Pearson correlation coefficient for the expression of all genes in each transcriptome. High positive numbers (>0.1; blue shading) represent statistically significant positive correlation between the two stresses effects on gene expression, while high negative numbers (<-0.1; orange shading) represents significant negative correlation.
growth at the expense of many other genes being down-regulated. Since the soil used in our experiment contained large amounts of readily available and slow release fer­tilizers, it is perhaps not so surprising that genes did not respond as they would to a soil nutrient deprivation. Still, that a competitive response under these crowding condi­tions does not activate the usual suite of "stress response" genes was intriguing. Even more surprising was that genes normally upregulated by wounding, abiotic stress and pathogen attack were suppressed well below normal "un­stressed" levels in strongly competing plants. The plant de-fensins PDF 1.1, PDF1.2a, PDF1.2c, PDF1.3 and PDF1.2b were typical examples of this pattern of response; they act as anti-fungal defense proteins, and are induced by patho­genic fungal attack. These genes are also significantly down regulated in the A. thaliana flowering mutants co, fca, fd and fe (Wilson et al., 2005). FLOWERING LOCUS C (FLC) is a MADS-domain transcription factor. The ex­pression of FLC correlates with flowering time, with high levels of FLC mRNA being associated with late flowering (Michaels and Amasino, 1999). CONSTANS (CO) is a zinc finger transcription factor (Putterill et al., 1995). CO
correlates with flowering, co mutants have delayed flow­ering. FD is a bZIP protein involved in the photoperiod pathway that triggers floral induction (Wigge et al., 2005). FE gene product is unknown but involved within the pho-toperiod pathway. A link between pathogen infection and early flowering has been suggested, and the transition from vegetative growth and flowering involves significant re-programming of primary metabolism and source-sink re­lationships. The SEN1 gene is strongly suppressed in both mild and severe competition. The SEN1 promoter responds to both the salicylic (SA) and jasmonic acid (JA) signal­ing pathways (Schenk et al., 2005). The sen1-1 knock-out mutant lacks a clear "senescence-related" phenotype, it is thought to be a link between senescence and pathogen related gene expression. In strongly competing plants, the downregulation of defense response genes may be simi­larly linked to reprogramming of metabolic activity and a shift in source-sink relationships, possibly to maximize growth and ensure that the plant can deploy photosynthetic surfaces near or above the canopy of its competitors. Such competition for light is generally asymmetric involving a major allocation of resources to aboveground growth, i.e.,
GEISLER et al. ― Arabidopsis intraspecific competition
93
height, by the plant to ensure that it overtops its neighbors (Connolly and Wayne, 1996).
Competitive stress does not produce the same gene ex­pression pattern in leaves and shoots as does the limitation of resources including water and nitrogen, and light level (controlled at the light source). The lack of induction of genes involved in anthocyanin synthesis (Peng et al., 2008; Peng et al., 2007) and cab biosynthesis suggest that "high competition" in which plant mortality is observed in stan­dard potting soil does not trigger a typical nitrogen limita­tion response at the genetic level. The overall correlation of gene expression between competition and nutrient de­privation and abiotic stresses is low, while the correlation within stresses and deprivation is high. Nitrogen depriva­tion and competition stress seem to have opposite effects on the expression of genes involved in photosynthesis (light reactions and Calvin cycle), carbonic anhydrase, and secondary metabolism (Figure 4). Overall, these results suggest that while some sets of core stress-response genes can be identified (Kilian et al., 2007), this may not be the case for the more complex response to intraspecific com­petition seen here for Arabidopsis. It would be of value to similarly identify how the suites of genes and changes in gene expression involved in other complex stresses such as the response to mechanical stimuli (thigmomorphogenesis) (Cahill et al., 2002; Cehab et al., 2009) and self-nonself discrimination in roots (O'Brien and Brown, 2009; Falik et al., 2003) change under competitive interactions.
The intraspecific competitive response that we observed in terms of gene regulation involved a downregulation of defense genes, an upregulation of photosynthetic genes, but no upregulation of genes involved in nutrient uptake. This differential gene expression suggests that, in Arabi-dopsis at least, intraspecific competition involves more than the mechanisms to preempt acquisition of a limited intermediary resource (light in this case) suggested by many models of competition (Craine, 2005). Why defense genes are down-regulated is unknown. Our results would indicate that Arabidopsis plants in a crowded pot should be more vulnerable to pathogens and abiotic stresses due to the suppression of defense genes. Similarly, microar-ray analysis of drought stress has been shown to decrease transcription of photosynthetic genes and upregulate heat-shock protein genes in natural populations of the prairie grass Andropogon gerardii (Travers et al., 2007). It is possible that photosynthesis and defense are simply cross-wired at the regulatory level, or that the plant in shutting down defense is trying to free up resources (i.e. energy, RNA polymerase activity, ribosome activity) in an effort to focus cellular activity towards a particular goal. Our gene expression data is derived from above-ground organs, primarily rosette leaves and the shoot apex. By contrast, Broz et al. (2008) looked at 1254 genes in tetraploid Cen-taurea maculosa roots in inter-specific competition experi­ments using a cross-hybridization technique. They did not see any change in genes involved in nutrient transport or abiotic stress, and concluded as we do that the genomic
response to competition is different from that of a resource deprivation, or else is influenced more strongly by non-re-source aspects of competition. Broz et al. (2008) found no significant functional grouping of the 36 differentially reg­ulated genes they observed (which is probably too small a sample size to see significant grouping), but they did see differences in the response between weak and strong com­petitor species. Plant-plant interactions, including competi­tion and facilitation (Brooker et al., 2008), involve a cost-benefit allocation of limited resources to growth that we show here is predicated upon specific differences in gene expression related to critical plant functions.
Our results also have relevance for the conduct and design of molecular physiology experiments involving Arabidopsis. In a typical experiment in which Arabidopsis plants are grown on soil, a phenotype is measured, and RNA or proteins are extracted. Little consideration is usu­ally given to the size of pot, or the presence of neighbor­ing plants which potentially sense each other and begin to compete for resources, altering the outcome of whatever experimental variable is being measured. Our results show that misleading interpretation of gene expression would be obtained unless the density of Arabidopsis plants is taken into account in these experiments. At the very least, inves­tigators should report the plant density. Preferably, experi­ments should be conducted at a standard density, or make interpretations based on experiments conducted on both isolated and crowded plants.
Acknowledgements. This research was supported by SIUC faculty startup funds (MG) and the US National Sci-ence Foundation DTB-0516429 (DG). Part of this research was an undergraduate independent research project taken for academic credit as the 'PLB391 Special problems in plant biology' course at SIUC (KL). We would like to thank Dr. Jane Geisler-Lee for providing the Chinese translation of the abstract.
LITERATURE CITED
Alwerdt, J.A., D.J. Gibson, S.D. Ebbs, and A.J. Wood. 2006. Interspecific interactions in Arabidopsis thaliana and the stomatal mutants tmml_l and sddl-2. Biol. Plant. 50: 205-209.
Bonser, S.P. and R.J. 1995. Plant competition and herbivory in relation to vegetation biomass. Ecology 76: 2176-2183.
Brooker, R.W., F.T. Maestre, R.M. Callaway, C.L. Lortie, L.A.
Cavieres, G. Kunstler, P. Liancourt, K. Tielborger, J.M.J. Travis, F. Anthelme, C. Armas, L. Coll, E. Corcket, S. Del-zon, E. Forey, Z. Kikvidze, J. Olofsson, F. Pugnaire, C.L. Quiroz, P. Saccone, K. Schiffers, M. Seifan, B. Touzard, and R. Michalet. 2008. Facilitation in plant communities: the past, the present, and the future. J. Ecol. 96: 18-34.
Broz, A.K., D.K. Manter, R.M. Callaway, M.W. Paschke, and J.M. Vivanco. 2008. A molecular approach to understanding plant-plant interactions in the context of invasion biology.
94
Botanical Studies, Vol. 53, 2012
Funct. Plant Biol. 35: 1123-1134.
Cahill, J.F., J.P. Catelli, and B.B. Casper. 2002. Separate effects
of human visitation and touch on plant growth and her-bivory in an old-field community. Amer. J. Bot. 89: 1401­1409.
Cahill, J.F., S.W. Kembel, and D.J. Gustafson. 2005. Differential
genetic influences on competitive effect and response in Arabidopsis thaliana. J. Ecol. 93: 958-967.
Carpenter, C.D. and A.E. Simon. 1999. Preparation of RNA. In J. Martinez-Zapater and J. Salinas (eds.), Methods in Molecu­lar Biology. Vol. 82. Arabidopsis Protocols. Humana Press Inc, pp. 85-89.
Cehab, E.W., E. Eich, and J. Braam. 2009. Thigmomorphogen-esis: a complex plant response to mechano-stimulation. J.
Exp. Bot. 60: 43-56.
Clements, F.E., J.E. Weaver, and H.C. Hanson. 1929. Plant com­petition: an analysis of community functions Carnegie Insti­tution, Washington DC, USA.
Connolly, J. and P. Wayne. 1996. Asymmetric competition be­tween plant species. Oecologia 108: 311-320.
Craine, J.M. 2005. Reconciling plant strategy theories of Grime
and Tilman. J. Ecol. 93: 1041-1052.
Craine, J.M. 2009. Resource Strategies of Wild Plants. Princeton University Press.
De Hoon, M.J.L., S. Imoto, J. Nolan, and S. Miyano. 2004. Open source clustering software. Bioinform. 20: 1453-1454.
Eisen, M.B., P.T. Spellman, P.O. Brown, and D. Botstein. 1998.
Cluster analysis and display of genome-wide expression
patterns. Proc. Natl. Acad. Sci. USA 8: 14863-14868.
Falik, O., P. Reides, M. Gersani, and A. Novoplansky. 2003. Self/non-self discrimination in roots. J. Ecol. 91: 525-531.
Gibson, D.J. 2002. Methods in Comparative Plant Population Ecology. Oxford, UK: Oxford University Press.
Gibson, D.J., J. Connolly, D.C. Hartnett, and J.D. Weidenham-mer. 1999. Designs for greenhouse studies of interactions between plants. J. Ecol. 87: 1-16.
Goldberg, D.E. and D.E. Barton. 1992. Patterns and consequenc­es of interspecific competition in natural communities: a re­view of field experiments with plants. Amer. Nat. 139: 771­801.
Goldberg, D.E. and K. Landa. 1991. Competitive effect and re­sponse: hierarchies and correlated traits in the early stages
of competition. J. Ecol. 79: 1013-1030.
Grace, J.B. and D. Tilman (eds.). 1990. Perspectives on Plant Competition. San Diego: Academic Press.
Grime, J.P. 1979. Plant Strategies and Vegetation Processes. Chichester, UK: John Wiley and Sons.
Keddy, P.A. 2001. Competition (2nd Edition). Dordrecht: Klu-wer Academic Publishers.
Kilian, J., D. Whitehad, J. Horak, D. Wanke, S. Weinl, O. Batis-
tic, C. D'Angelo, E. Bornberg-Baur, J. Kudla, and K. Har-ter. 2007. The AtGenExpress global stress expression data set: protocols, evaluation and model data analysis of UV-B
light, drought and cold stress responses. Plant J. 50: 347­363.
Leakey, A.D.B., E.A. Ainsworth, S.M. Bernard, R.J. Cody Markelz, D.R. Ort, S.A. Placella, A. Rogers, M.D. Smith, E.A. Sudderth, D. J. Weston, S.D. Wullschleger, and S. Yuan. 2009. Gene Expression profiling: Opening the black box of plant ecosystem responses to global change. Global Change Biol. 15: 1201-1213.
Littell, R.C., G.A. Milliken, W.W. Stoup, R.D. Wolfinger, and O.
Schabenberger. 2006. SAS for Mixed Models, 2nd edition. SAS Institute, Cary, NC.
Michaels, S.D. and R.M. Amasino. 1999. FLOWERING LOCUS C encodes a novel MADS domain protein that acts as a re­pressor of flowering. Plant Cell 11: 949-956
Mutic, J.J. and J.B. Wolf. 2007. Indirect genetic effects from ecological interactions in Arabidopsis thaliana. Mol. Ecol.
12: 2371-2381.
O'Brien, E. and J.H. Brown. 2009. Games roots play: effects of soil volume and nutrients. J. Ecol. 96: 438-446.
Ohto, M., K. Onai, Y. Furukawa, E. Aoki, T. Araki, and K. Naka-mura. 2001. Effects of sugar on vegetative development and floral transition in Arabidopsis. Plant Physiol. 127: 252­261.
Peng, M., C. Hannam, H. Gu, Y.-M. Bi, and S.J. Rothstein. 2007. A mutation in NLA, which encodes a RING-type ubiquitin ligase, disrupts the adaptability of Arabidopsis to nitrogen
limitation. Plant J. 50: 320-337.
Peng, M., D. Hudson, A. Schofield, R. Tsao, R. Yang, H. Gu,
Y.-M. Bi, and S.J. Rothstein. 2008. Adaptation of Arabidop-
sis to nitrogen limitation involves induction of anthocyanin synthesis which is controlled by the NLA gene. J. Expt. Bot.
59: 2933-2944.
Purves, D.W. and R. Law. 2002. Experimental derivation of functions relating growth of Arabidopsis thaliana to neigh­bour size and distance. J. Ecol. 90: 882-894.
Putterill, J., F. Robson, K. Lee, R. Simon, and G. Coupland.
1995. The CONSTANS gene of Arabidopsis promotes
flowering and encodes a protein showing similarities to zinc finger transcription factors. Cell 80: 847-857
Saeed, A.I., V. Sharov, J. White, J. Li, W. Liang, N. Bhagabati,
J. Braisted, M. Klapa, T. Currier, M. Thiagarajan, A. Sturn, M. Snuffin, A. Rezantsev, D. Popov, A. Ryltsov, E. Kostuk-ovich, I. Borisovsky, Z. Liu, A. Vinsavich, V. Trush, and J. Quackenbush. 2003. TM4: A free, open source system for microarray data management and analysis. Biotechniques
34: 374-378.
SAS Institute Inc. 2002-2003. The SAS system for Windows, Ver 9.1. SAS Institute Inc, Cary, NC, USA.
Schenk, P.M., K. Kazan, A.G. Rusu, J.M. Manners, and D.J. Maclean. 2005. The SEN1 gene of Arabidopsis is regulated by signals that link plant defence responses and senescence.
Plant Physiol. Biochem. 43: 997-1005.
Schmidt, S. and J.T. Baldwin. 2009. Down-regulation of sys-temin after herbivory is associated with increased root
GEISLER et al. ― Arabidopsis intraspecific competition
95
allocation and competitive ability in Solanum nigrum.
Oecologia 159: 473-482.
Thimm, O., O. Blaesing, Y. Gibon, A. Nagel, S. Meyer, P. Kruger, J. Selbig, L.A. Muller, S.Y. Rhee, and M. Stitt. 2004. MAPMAN: a user-driven tool to display genomics data sets onto diagrams of metabolic pathways and other biological processes. Plant J. 37: 914-39.
Thomas, M.A. and R. Klaper. 2004. Genomics for the ecological
toolbox. Trends Ecol. Evol. 19: 439-445.
Tilman, D. 1982. Resource competition and community structure Princeton University Press, Princeton, NJ, USA.
Tow, P.G. and A. Lazenby. 2001. Competition and succession in pastures - some concepts and questions. In P. G. Tow and A. Lazenby (eds.), Competition and succession in pastures,
1-14. CABI Publishing, Wallingford, Oxon, UK, pp. 1-14.
Travers, S.E., M.D. Smith, J. Bai, S.H. Hulbert, J.E. Leach, P.S. Schnable, A.K. Knapp, G.A. Milliken, P.A. Fay, A. Saleh,
and K.A. Garrett. 2007. Ecological genomics: making the leap from model systems in the lab to native populations in the field. Front. Ecol. Environ. 5: 19-24.
Travers, S.E., Z. Tang, D. Caragea, K.A. Garrett, S.H, Hulbert, J.E. Leach, J. Bai, A. Saleh, A. K. Knapp, P.A. Fay, J. Nip-pert, P.S. Schnable, and M.D. Smith. 2009. Variation in gene expression of Andropogon gerardii in response to altered environmental conditions associated with climate change. J.
Ecol. 98: 374-383.
Weigelt, A., J. Schumacher, T. Walther, M. Bartelheimer, T. Steinlein, and W. Beyschlag. 2006. Identifying mechanisms of competition in multi-species communities. J. Ecol. 95:53-64.
Wigge, P.A., M.C. Kim, K.E. Jaeger, W. Busch, M. Schmid, J.U. Lohmann, and D. Weigel. 2005. Integration of spatial and temporal information during floral induction in Arabidopsis. Science 309: 1056-1059.
Wilson, I.W., G.C. Kennedy, J.W. Peacock, and E.S. Dennis. 2005. Microarray analysis reveals vegetative molecular phenotypes of Arabidopsis flowering-time mutants. Plant
Cell Rep. 46: 1190-1201.
Wit, E. and J.D. McClure. 2004. Statistics for Microarrays: Design, Analysis and Inference. John Wiley & Sons, Chich-ester, UK.
96
Botanical Studies, Vol. 53, 2012
光合作用基因的表現量增加,及防禦基因的表現量下降, 是阿拉伯芥地上部面臨種內競爭的反應
Matt GEISLER, David J. GIBSON, Kenneth J. LINDSEY, Katherine MILLAR, and Andrew J. WOOD
Department of Plant Biology, Center for Ecology, Southern Illinois University-Carbondale, Carbondale, IL 62901-6509, USA
植物彼此競爭光,水和土壤的養分。當植物面臨不同非生物因素(abiotic) 或生物因素(biotic) 的競
爭壓力時,到底哪一基因系列表現量(gene expression) 會增加或減少,這個研究主題從未被瞭解過。然
而,當使用模式植物系統(model organisms;如阿拉伯芥Arabidopsis thaliana) 作實驗時,植物間彼此
競爭中,某一系列基因表現量增加或減少,會大大影響植物 - 植物間的相互作用,以及影響研究人員
實驗設計的準確度。通常在阿拉伯芥研究中,研究表現型和生理特性時,是以單一植株或低密度種植;
用於收集大量組織和種子,是以中等密度種植; 用於篩選變異植株時,是以高密度種植。可是,用生
物辨識系統(biometric measures)研究阿拉伯芥的生長和產量時,花序的高度,叢生葉直徑(rosette leaf
diameter),生物量(biomass),和種子產量,都會隨著阿拉伯芥生長於中,高密度時而遞減;並且在高密
度時,瀕臨所用的盆子的承擔受量(carrying capacity)。收集地上部的莖葉,萃取它們的核糖核酸(RNA)
以分析基因轉錄(transcriptomic analysis)。我們發現到:隨著阿拉伯芥 生長密度的調高,光合作用相關
的基因表現量明顯增加;然而那些因環境壓力,植物二級代謝物(plant secondary metabolites),和植物
防禦反應(plant defense)相關的基因表現量卻被大大抑制。無論生長在低和高密度,它們基因表現量和
相關性有明顯的重疊。阿拉伯芥面臨種內競爭(intraspecific competition) 的生存策略,似乎和面臨資源
被剝奪(resource deprivation)的影響– 無論非生物因素或生物因素資源–完全不同 。所以,我們的結論
是:在典型的生長箱(growth chamber)中,當植物處於種內競爭時,光合作用的基因表現量明顯增加
(upregulation),而和環境壓力和植物防禦反應相關的基因表現將被抑制停止(downregulation)。
關鍵詞:阿拉伯芥;基因系列表現量;基因轉錄;種內競爭;光合作用相關的基因;代謝網路重新編
程。