Botanical Studies (2012) 53: 265-274.
SYSTEMATICS
DNA barcoding of Nyssaceae (Cornales) and taxonomic issues
Nian WANG1,2,6, Frederic M.B. JACQUES3, Richard I. MILNE4, Chang-Qin ZHANG1,2 *, and
Jun-Bo YANG5
1Kunming Botanic Garden, Kunming Institute of Botany, Chinese Academy of Sciences, Kunming 650204, China
2Key Laboratory of Resource Plants and Biotechnology, Kunming Institute of Botany, Chinese Academy of Sciences, Kun-
ming650204, China
3Key Laboratory of Tropical Forest Ecology, Xishuangbanna Tropical Botanical Garden, Chinese Academy of Sciences,
Mengla 666303, China
4Institute of Molecular Plant Sciences, University of Edinburgh, Edinburgh EH9 3JH, UK
5The Germplasm Bank of Wild Species in Southwest China, Kunming Institute of Botany, Chinese Academy of Sciences,
Kunming 650201, China
(Received June 2, 2011; Accepted December 22, 2011)
ABSTRACT. DNA barcoding, as a tool for species discrimination, has been efficiently used in animals. However, there are still debates on which DNA region (s) can be adopted as the standard barcode (s) for land plants. In the present study, we evaluated the four proposed barcoding loci (matK, rbcL, trnH-psbA and ITS) on nine species of Nyssaceae. The results showed that ITS was the best performing single locus, although matK + rbcL might be used as the core barcodes for land plants. The chloroplast regions have low resolution compared with ITS. The low efficiency of these candidate barcodes in Nyssaceae might be caused by a poor taxonomy, especially within the genus Nyssa. The results also indicated that species status of N. shangszeen-sis, N. sinensis, N. shweliensis and N. wenshanensis requires to be reevaluated based on more morphological characters combined with rapidly evolving loci.
Keywords: DNA barcoding; ITS; matK; Nyssaceae; rbcL; trnH-psbA.
INTRODUCTION
DNA barcoding refers to the use of standardized DNA sequence as a tag for rapid and accurate species identifica­tion (Herbert et al., 2003, 2004; Savolainen et al., 2005; Kress et al., 2007; Sundberg et al., 2010). DNA barcoding based on a fragment of cytochrome c oxidase I gene (COI) was successfully used to discriminate animal species (Her­bert et al., 2004; Kress et al., 2005; Chase et al., 2005; Ward et al., 2005; Fazekas et al., 2008; Lakra et al., 2011). However, the application of DNA barcoding to plants has been impeded due to problems such as difficulties with amplification and sequencing, and relatively lower diver-gence between than within species (Kress et al., 2005; Liu et al., 2010). Hence, a multi-locus approach based on the chloroplast genome has been proposed, and is increasingly accepted as an effective strategy for barcoding land plants
(Newmaster et al., 2008; Kress and Erickson, 2007; CBOL Plant Working Group, 2009). As the Barcoding of Life Da­tabase has an increasing number of data entries (Ratnas-ingham and Hebert, 2007), barcoding undoubtedly plays an increasingly important role when it comes to species that are difficult to identify. Although the power of DNA barcoding is challenged by taxonomically closely related species (Newmaster et al., 2008; Newmaster and Ragupa-thy, 2009), it remains promising in distinguishing cryptic species (Ragupathy et al., 2009).
Nyssa L. is a genus in which few characters separate many of the species, leading to taxonomic ambiguity, es­pecially for those distributed in eastern Asia. Since current classification is mainly based on morphological characters and the geographical ranges of taxa, views on its taxono­my differ between authors. Initially, two species were pro­posed for eastern Asia, N. sinensis and N. javanica (Eyde, 1963). Subsequently, five further species were described, i.e. N. shweliensis (Airy Shaw, 1969), N. shangszeensis, N. leptophylla and N. wenshanensis (Fang and Song, 1975), and N. yunnanensis (Wu and Fan, 1977). All seven species were recognized by Qin and Phengklai (2007); however, Wen and Stuessy (1993) treated N. yunnanensis, N. wen-shanensis and N. leptophylla as part of N. javanica species complex (and hence synonymous) with N. javanica, based

6Present Address: School of Biological and Chemical Sci­ences, Queen Mary University of London, Mile End Road, London E1 4NS, United Kingdom. E-mail: wangnian@ mail.kib.ac.cn.
*Corresponding author: E-mail: zhangchangqin@mail.kib. ac.cn; Tel: +86-871-5223630; Fax: +86-871-5216345.
266
Botanical Studies, Vol. 53, 2012
on morphological similarities. Hence classifications dis­agree on how many species are present in East Asia, and molecular data provides a means of assessing the accuracy of the two taxonomic treatments.
Given the uncertainty regarding the number of taxo-nomic species in eastern Asian Nyssa, a DNA-based ap­proach seems appropriate. Therefore, the objectives of this study are to: 1) test the efficiency of the four loci (matK, rbcL, trnH-psbA and ITS) as barcodes for Nyssaceae; and 2) use data from these to reevaluate the taxonomic issues.
MATERIALS AND METHODS
Plant materials
To gain a more comprehensive understanding, we sampled the species as recorded in Flora of China. Mate­rial of N. leptophylla Fang et Soong could not be obtained because insufficient information on its distribution (Sun, 2008) prevented us from locating it in the field. From the other six species, between three and five accessions were collected per species (Figure 1; Table S1). In addition, three accessions of one of the American species, N. sylvat-ica, were obtained from the Arnold Arboretum of Harvard University. Three and four accessions each of species from two other genera of Nyssaceae, Camptotheca acuminata and Davidia involucrata were also included (Table S1). Hence a total of 32 accessions from nine species were used to evaluate the candidate barcodes.
Material of N. yunnanensis and N. javanica was collect­ed from one locality each (Table S1) and could be assigned to these species based on morphology. However, past taxo-nomic confusion combined with morphological similarity made identification of the other four species uncertain. Each of N. shangszeensis and N. wenshanensis have only ever been collected from their type localities (Table S1), and in each case no other Nyssa species has ever been recorded from the vicinity of their type locality. Our own
field observations confirmed the presence of a species matching the type description, and no other, at each type locality. Therefore, material from the type locality of each species was assigned to that species in each case. Simi­larly, material from a locality where N. sinensis (and no other species) and N. shweliensis (and no other species) had previously been recorded was examined, confirmed to match descriptions of each species, and therefore assigned to N. sinensis and N. shweliensis respectively. From each wild population of each species, each individual sampled was at least 30 meters from the nearest sampled accession. In addition, one cultivated accession of N. sinensis from Kunming was examined.
DNA extraction, PCR amplification and sequencing
Genomic DNA was extracted from 30-50 mg of silica-gel dried leaves of all accessions using a modified CTAB (cetyl trimethyl ammonium bromide) method (Doyle and Doyle, 1987). The extracted total DNA was diluted to a final concentration of 50-80 ng/[il for subsequent use. Am-plifications of the target gene regions were performed via the polymerase chain reaction (PCR) in a GeneAmp PCR System 9700 DNA Thermal Cycler (PerkinElmer, USA) or Eppendorf (Hamburg, Germany).
Nuclear ribosomal ITS and three chloroplast genes (matK, rbcL and psbA-trnH) were amplified (White et al. 1990; Tate and Simpson, 2003; Dunning and Savolainen, 2010; Ivanova et al., 2008). The PCR amplifications were carried out in 25 [il mixtures contained 0.3 U AmpliTaq polymerase, 10 x buffer, 1.5 mmol/L MgCl?, 0.2 mmol/L dNTP, 0.5 imol/L primer and 30-50 ng genomic DNA. The PCR conditions consisted of an initial denaturation at 95°C for 2-3 min, followed by 32-34 cycles of 1 min at 94°C, 50 sec at 52°C, 1.5 mm at 72°C, and ended with an extension step of 7 min at 72°C. The PCR products were purified using the GELase Agarose (Epicentre Technolo­gies, Madison, WI, USA) according to the manufacturer's protocol for sequencing PCR reactions. Sequencing reac­tions were performed using PRISM Dye Terminator Cycle Sequencing Ready Reaction kit (Applied Biosystems, Foster City, Calif.). The sequencing products were run on an ABI 3700 automated sequencer (Perkin Elmer). All sequences were deposited in GenBank with the accession numbers listed in Table S1.
Data analysis
Sequences from each DNA region were aligned using the CLUSTAL X version 1.83 (Thompson et al., 1997) then refined manually. The inter- and intraspecific diver­gences of each barcoding region was computed by calcu­lating Kimura 2-parameter (K2P) distances in MEGA 4 (Tamura et al., 2007). The significance of divergence was then assessed by Wilcoxon signed rank and Wilcoxon two-sample tests (http://www.fon.hum.uva.nl/Service/Statis-tics.html). The neighbor-joining (NJ) method was used to construct phylogenetic trees in PAUP 4.0b10 (Swofford et
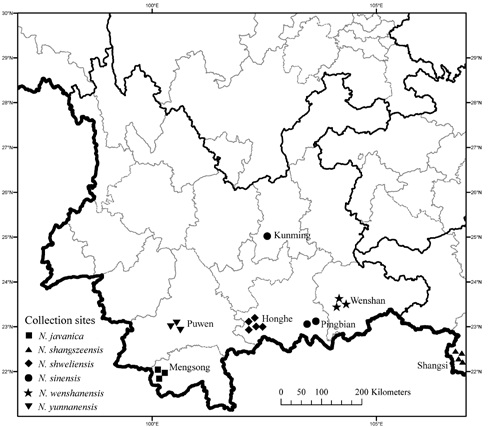
Figure 1. The localities of Nyssa species used in this study.
WANG et al. ― DNA barcoding of Nyssaceae
267
al., 2002) due to its accuracy for smaller data sets and its computational speed (Tamura et al., 2004). The K2P model was adopted because it performs best for low value genetic distances, and is therefore popularly used for species-level analysis (Nei and Kumar, 2000). Branch support for NJ was assessed with 1000 bootstrap replicates.
RESULTS
Successful PCR amplification rate and se­quence quality
The amplification success rates vary among the four
loci, with 92% in ITS, 89.5% in rbcL, 86.9% in trnH-psbA and 80.5% in matK. High quality bidirectional sequences were obtained from rbcL and trnH-psbA. The remaining two loci required more manual editing in Nyssa species. The greatest problems in obtaining bidirectional sequences with few ambiguous bases were encountered with matK; this was in part attributable to mononucleotide repeats dis­rupting individual sequencing reads.
Genetic divergence between and within species
The Wilcoxon signed-rank test demonstrated that ITS exhibited the highest divergence at the interspecific level
Supplementary Table 1. Detailed information on samples used in this study.

Specimen

Locality

Voucher No.


GenBank Accession No.


ITS

matK

rbcL

trnH-psbA

N. yunnanensis 1

Puwen, Yunnan

SBL 2006030901

JQ280773

JQ280869

JQ280837

JQ280805
N. yunnanensis 2
Puwen, Yunnan
SBL 2006030303
JQ280774
JQ280870
JQ280838
JQ280806
N. yunnanensis 3
Puwen, Yunnan
SBL 2006030302
JQ280775
JQ280871
JQ280839
JQ280807
N. yunnanensis 4
Puwen, Yunnan
SBL 2006030304
JQ280776
JQ280872
JQ280840
JQ280808
N. javanica 1
Mengsong, Yunnan
SBL 2007040302
JQ280777
JQ280873
JQ280841
JQ280809
N. javanica 2
Mengsong, Yunnan
SBL 2005040601
JQ280778
JQ280874
JQ280842
JQ280810
N. javanica 3
Mengsong, Yunnan
SBL 2005032703
JQ280779
JQ280875
JQ280843
JQ280811
N. sinensis 1
Pingbian, Yunnan
SBL 2007041802
JQ280759
JQ280855
JQ280823
JQ280791
N. sinensis 2
Pingbian, Yunnan
SBL 2007041803
JQ280760
JQ280856
JQ280824
JQ280792
N. sinensis 3
Kunming, Yunnan
SBL 2007041801
JQ280758
JQ280854
JQ280822
JQ280790
N. shangszeensis 1
Shangsi, Guangxi
SBL 2007041001
JQ280764
JQ280860
JQ280828
JQ280796
N. shangszeensis 2
Shangsi, Guangxi
SBL 2007041002
JQ280765
JQ280861
JQ280829
JQ280797
N. shangszeensis 3
Shangsi, Guangxi
SBL 2007041003
JQ280767
JQ280863
JQ280831
JQ280799
N. shangszeensis 4
Shangsi, Guangxi
SBL 2007041004
JQ280766
JQ280862
JQ280830
JQ280798
N. shweliensis 1
Honghe, Yunnan
SBL 2007040207
JQ280768
JQ280864
JQ280832
JQ280800
N. shweliensis 2
Honghe, Yunnan
SBL 2007040213
JQ280769
JQ280865
JQ280833
JQ280801
N. shweliensis 3
Honghe, Yunnan
SBL 2007040318
JQ280770
JQ280866
JQ280834
JQ280802
N. shweliensis 4
Honghe, Yunnan
SBL 2007040201
JQ280772
JQ280868
JQ280836
JQ280804
N. shweliensis 5
Honghe, Yunnan
SBL 2007040204
JQ280771
JQ280867
JQ280835
JQ280803
N. wenshanensis 1
Wenshan, Yunnan
SBL 2007041304
JQ280761
JQ280857
JQ280825
JQ280793
N. wenshanensis 2
Wenshan, Yunnan
SBL 2007041303
JQ280762
JQ280858
JQ280826
JQ280794
N. wenshanensis 3
Wenshan, Yunnan
SBL 2007041302
JQ280763
JQ280859
JQ280827
JQ280795
N. sylvatica 1
Arnold Arboretum
SBL 2007041901
JQ280755
JQ280851
JQ280819
JQ280787
N. sylvatica 2
Arnold Arboretum
SBL 2007041902
JQ280756
JQ280852
JQ280820
JQ280788
N. sylvatica 3
Arnold Arboretum
SBL 2007041903
JQ280757
JQ280853
JQ280821
JQ280789
C. acuminata 1
Puwen, Yunnan
SBL 2007033001
JQ280783
JQ280879
JQ280847
JQ280815
C. acuminata 2
Puwen, Yunnan
SBL 2007033002
JQ280784
JQ280880
JQ280848
JQ280816
C. acuminata 3
Puwen, Yunnan
SBL 2007033003
JQ280785
JQ280881
JQ280849
JQ280817
C. acuminata 4
Puwen, Yunnan
SBL 2007033004
JQ280786
JQ280882
JQ280850
JQ280818
D. involucrata 1
Punwen, Yunnan
SBL 20070418011
JQ280780
JQ280876
JQ280844
JQ280812
D. involucrata 2
Punwen, Yunnan
SBL 20070418021
JQ280781
JQ280877
JQ280845
JQ280813
D. involucrata 3
Kunming, Yunnan
SBL 20070418031
JQ280782
JQ280878
JQ280846
JQ280814

268
Botanical Studies, Vol. 53, 2012
(P < 1.757x10-07) (both between and within genera; Table 1). Within Nyssa, the next highest divergences were for rbcL, trnH-psbA and matK respectively, though all were an order of magnitude less than for ITS (Table 1). Be­tween genera, matK gave the highest distances after ITS, followed by trnH-psbA and rbcL (Table 1). The four loci showed no significant differences in intraspecific diver­gence (Table S2), with no divergence detected at all for ITS (Table 1). For each gene, the interspecific divergence significantly exceeded the corresponding intraspecific di­vergence (Table S3).
Taxon discrimination
Even compared to the three cpDNA genes combined, ITS has the highest discriminatory power (Table 3). All species other than N. shweliensis are monophyletic in the ITS NJ trees, with >99% bootstrap support for monophyly of N. sylvatica, N. wenshanensis, N. yunnanensis, Camp-totheca acuminata and Davidia involucrata, 85% and 65% support for N. javanica and N. sinensis respectively, but no support for N. shangszeensis. However, N. shweliensis, appears polyphyletic, though this is not supported.
Of the three cpDNA genes (Table 3), rbcL (44.4%) ranks second to ITS in discriminatory power, followed by matK (33.3%) and trnH-psbA (22.2%) (Table 3). Combin-ing these three gives a similar discriminatory power to rbcL alone, whereas combining one or more cpDNA genes with ITS gives a lower power than ITS alone, or a similar score in the case of ITS + matK (Table 3).
The three combined cpDNA genes distinguish four groupings within Nyssa: N. sylvatica (99% support), the N. yunnanensis plus two accessions of N. javanica (92%), N. sinensis (57%) and a clade of N. shweliensis, N. shang-
szeensis, and N. wenshanensis (54%). However, a third accession of N. javanica is positioned among the latter three clades, making that species appear paraphyletic for cpDNA.
DISCUSSION
Ease of amplification of candidate genes for DNA barcodes in Nyssa
DNA bacording aims to identify species rapidly and ac­curately by adopting a standardized DNA locus as a tag. Finding an ideal region in plants, i.e. which is sufficiently variable to discriminate among all the species and con­served enough to be less variable within species, is a real challenge (Kress et al., 2007). Thus, many studies have been carried out to evaluate different loci and test their ef­ficiency as DNA barcodes (Kress et al., 2007; Chen et al., 2010; Liu et al., 2010).
PCR and sequencing success are key criteria for DNA barcoding (Kress and Erickson, 2007; Hollingsworth et al., 2009). ITS, rbcL and trnH-psbA performed well regard­ing this aspect. The locus matK could not be sequenced for some accessions of Nyssa species because of the downstream of mononucleotide repeats which can disrupt individual sequencing reads. Similar problems have been reported before for matK (Sass et al., 2007; Fazekas et al., 2008; Hollingsworth et al., 2009), making it a difficult lo­cus to work with for land plant barcoding.
Discriminatory power of single barcodes
The power to discriminate species is a crucial criterion to select suitable DNA barcodes (CBOL Plant Working
Table 1. Analysis of interspecific and intraspecific divergence of four DNA barcodes for the nine taxonomic species.

Potential barcodes

Interspecific distance1


Intraspecific distance1

Within Nyssa

Between genera

Within species

matK

0.0016 ± 0.0016

0.02 89 ± 0.0037


0.0003 ± 0.0007
rbcL
0.0025 ± 0.0021
0.0099 ± 0.0013
0.0002 ± 0.0007
trnH-psbA
0.0021 ± 0.0023
0.0591 ± 0.0125
0.0006 ± 0.0012
ITS
0.0242 ± 0.0152
0.1631 ± 0.0292
0.0000 ± 0.0000

1 Interspecific distance and intraspecific distance were calculated based on Kimura 2-parameter (Nei and Kumar, 2000).
Supplementary Table 2. Wilcoxon signed-rank tests of intraspecific divergence among loci for the nine taxonomic species.

W+

W-

Relative ranks

n

P value

Result

W+

W-

matK

rbcL

7

3

4

< 0.625

matK = rbcL
matK
trnH-psbA
0
3
2
< 0.5
matK = trnH-psbA
matK
ITS
10
0
4
< 0.125
matK = ITS
rbcL
ITS
3
0
2
< 0.5
rbcL = ITS
trnH-psbA
ITS
10
0
4
< 0.125
trnH-psbA = ITS
trnH-psbA
rbcL
10
0
4
< 0.125
trnH-psbA = rbcL

WANG et al. ― DNA barcoding of Nyssaceae
269
Group 2009). Given this criterion, ITS performed best as a single barcode out of the four loci tested in this study. Eight out of nine taxonomic species (88.9%) were well defined. This locus was first promoted as a plant barcode by Kress et al. (2005), due to its high amount of interspe­cific variation. It functioned well in some taxa and was highly recommended for barcoding applications (Sass et al., 2007). However, several characteristics of ITS make it
a potentially problematic barcode, such as gene duplica­tion, incomplete concerted evolution, pseudogenes and the presence of paralogs (King and Roalson, 2008; Starr et al., 2009). These problems were not encountered in the pres­ent study.
The remaining loci showed incomplete taxon discrimi­nation with matK identifying three species (33%); rbcL discriminated four (44%); trnH-psbA two (22%). Two loci,
Table 2. Wilcoxon signed-rank tests of interspecific divergence among loci for the nine taxonomic species.

W+

W-

Relative ranks1

n

P value

Result1

W+

W-

matK

rbcL

288

63

26

< 0.0044

matK > rbcL
matK
trnH-psbA
36
429
30
< 5.547x10-05
matK < trnH-psbA
matK
ITS
0
666
36
< 1.757x10-07
matK < ITS
rbcL
ITS
0
666
36
< 1.757x10-07
rbcL < ITS
trnH-psbA
ITS
0
666
36
< 1.757x10-07
trnH-psbA < ITS
trnH-psbA
rbcL
469
92
33
< 0.0008
trnH-psbA > rbcL

1The symbols "W+" and "W-" represent the sum of all of the positive values and the sum of all of the negative values in the Signed Rank column, respectively. Symbol ">" is used if the interspecific divergence for a locus significantly exceeds that of another lo­cus.
Table 3. Bootstrap values of nine species based on single or combined DNA loci.
No. of accessions

smatK
3

65
4

X
3

X
3

X
4

X
5

X
3

X
4

100
3

100
-

33.3
rbcL
88
X
X
69
X
X
X
97
99
44.4
trnH-psbA
X
X
X
X
X
X
X
100
100
22.2
ITS
99
100
86
100
78
X
99
100
100
88.9
matK + rbcL
99
X
X
54
X
X
X
100
100
44.4
matK + trnH-psbA
81
X
X
X
X
X
X
100
100
33.3
matK + ITS
100
100
91
64
73
X
99
100
100
88.9
rbcL + trnH-psbA
93
X
X
55
X
X
X
100
100
44.4
rbcL + ITS
100
100
X
87
85
X
98
100
100
77.8
trnH-psbA + ITS
100
100
X
64
76
X
99
100
100
77.8
matK + rbcL + trnH-psbA
99
X
X
54
X
X
X
100
100
44.4
matK + rbcL + ITS
100
100
X
86
83
X
99
100
100
77.8
matK + trnH-psbA + ITS
100
100
X
63
70
X
99
100
100
77.8
rbcL + trnH-psbA + ITS
100
100
X
86
85
X
98
100
100
77.8
matK + rbcL + trnH-psbA + ITS
100
100
X
86
80
X
99
100
100
77.8

Values in all but the last column represent percentage bootstrap support for monophyly of all accessions for that taxon that were examined; x indicates that the taxon was not monophyletic for that marker/set of markers. Discrimination (%) represents the per­centage of species recognized as monophyletic with >50% bootstrap support by each locus or combination of loci.
270
Botanical Studies, Vol. 53, 2012
matK and rbcL, were proposed as the core barcodes for land plants (CBOL Plant Working Group, 2009). However, their evolution may be too slow for Nyssa, with a resulting incomplete taxon assignment (Table 3).
The trnH-psbA intergenic spacer is one of the most variable regions of the plastid genome (Shaw et al., 2007). However, much of its variability occurs as insertions and deletions, which makes sequence alignment a difficult task (Ford et al., 2009). Although this is considered disadvan­tageous for barcode application (CBOL Plant Working Group, 2009), the insertion/deletion mutations were also seen as an advantage of trnH-psbA due to their diagnostic nature (Kress and Erickson, 2007). In the present study, trnH-psbA is not proposed as a satisfactory barcode for Nyssaceae due to its low species discriminatory power (Table 3).
Overall, ITS had greater discriminatroy power than all three cpDNA genes combined, successfully separating al­most all species examined.
A multi-locus barcoding system for Nyssaceae
The multi-locus barcoding system has been suggested for land plants because no single locus is satisfactory on its own. Within this kind of system, a locus with low evolution rate discriminates individuals at the genus level
and above, while more rapidly evolving loci delineates species within genera (Newmaster et al., 2006; Kress and Erickson, 2007). Combining barcoding markers has shown benefits for species delimitation (Fazekas et al., 2008) because multi-locus combinations can result in increased robustness, as revealed by high clade support values. The combinations of rbcL + matK and rbcL + trnH-psbA were recommended as two-locus systems for land plants (CBOL Plant Working Group, 2009; Kress and Erickson, 2007). Within Nyssaceae, however, even the three genes com­bined (rbcL + matK + trnH-psbA) had limited discrimina­tory power, separating only three clades among the six eastern Asian Nyssa species examined (Figure 3). Combin­ing any or all of these with ITS did not improve upon the discrimination obtained from ITS alone.
Supplementary Table 3. Wilcoxon two-sample test based on interspecific versus intraspecific Kimura 2-distances of the four loci.

Loci

Wilcoxon two-sample test

matK

#A = 451, #B = 43, W = 3414.5, P < 6.503e-16
rbcL
#A = 447, #B = 43, W = 2643.5, P < 4.634e-19
trnH-psbA
#A = 453, #B = 43, W = 4231.5, P < 6.771e-13
ITS
#A = 456, #B = 43, W = 1010.5, P < 4.643e-27


Figure 2. Neighbor-joining tree based on Kimura 2-parameter using ITS. The branch support was assessed with 1000 replicates. The support values above 50% were shown.
WANG et al. ― DNA barcoding of Nyssaceae
271
Taxonomic implications for Nyssa
The present taxonomy of Nyssa, based on a limited number of morphological characters, is confusing and controversial (Sun, 2008). Based on 18 morphological
characters collected from herbarium specimens, Wen and Stuessy (1993) supported the recognition of four Nyssa species present in eastern Asia: N. sinensis, N. javanica, N. shangszeensis and N. shweliensis. Because the differ­ences among N. javanica, N. yunnanensis, N. wenshan-ensis and N. leptophylla appear minor, mainly regarding several morphological characters (shape, size and textures of leaves, number of veins, length of petiole, pubescence on leaves and infloresences, length of pedicels, and size of fruits), they were treated as the N. javanica complex (Wen and Stuessy, 1993). However, our DNA results contradict this view: based on ITS, N. javanica is clearly distinct from N. yunnanensis and N. wenshanensis; indeed, N. javanica and N. yunnanensis are by some margin the most distinct species according to ITS data. The other four species formed a well-supported clade, within which the monophyly of N. sinensis, N. wenshanensis and N. shangszeensis, but not N. shweliensis, was supported. However, ITS data alone did not provide strong support for species status for these taxa: only N. wenshanensis had strong (99%) bootstrap support for its monophyly, and the interspecific divergence values among these species were 0.7% or less (Table S4). If a threshold of 1.0% genetic distance is taken as the minimum to differentiate species (following Ratnasingham and Hebert, 2007), then N. wen-shanensis, N. shangszeensis and N. shweliensis were not
Supplementary Table 4. The pair-wise distance between the nine taxonomic species revealed by ITS.
N. sylvatica
N. sinensis
0.024
N. wenshanensis
0.026
0.007
N. shangszeensis
0.022
0.002
0.007
N. shweliensis
0.018
0.005
0.007
0.004
N. yunnanensis
0.035
0.045
0.047
0.043
0.039
N. javanica
0.026
0.037
0.039
0.035
0.031
0.009
D. involucrata
0.123
0.136
0.138
0.134
0.129
0.133
0.129
C. camptotheca
0.178
0.194
0.196
0.192
0.189
0.182
0.175 0.219


Figure 3. Neighbor-joining tree based on Kimura 2-parameter using combined chloroplast loci (matK + rbcL + trnH-psbA). The branch support was assessed with 1000 replicates. The support values above 50% were shown.
272
Botanical Studies, Vol. 53, 2012
recognized as distinct species from N. sinensis. However, distance thresholds undoubtedly differ between organisms (Pettengill and Neel, 2010), so this 1% threshold can only serve as an approximate guideline, and other explanations for low divergence must be considered.
Three possible explanations are: first, inaccurate tax­onomy (i.e. they are not truly distinct); second, very recent speciation (where insufficient time has passed to accumu­late sequence differentiation); and third, past or present hybridization. Hybridization appears unlikely because no two Nyssa species are known to occur in sympatry in east­ern Asia, except for N. javanica and N. sinensis (N. Wang, personal observation). However, one accession of N. javanica has a cpDNA type that is in a different position on the NJ tree from the other two (Figure 3), despite this species being monophyletic for ITS (Figure 2). This could indicate possible chloroplast capture via ancient introgres-sion; however, the difference within N. javanica is only one bp, so homoplasy is also a possible explanation.
Recent speciation is plausible for Nyssa, irrespective of whether current taxonomy is accurate. Although Nyssa is an old genus with a long Tertiary history (Edye, 1963; Wen and Stuessy, 1993), this is not incompatible with recent speciation in eastern Asia. For example, Rhododen­dron is 60 million years old (Milne, 2004), but contains clades of species that are not distinguishable based on ITS sequences (e.g. R. decorum and R. irroratum; Wang, 2010) or particular cpDNA sequences (Milne et al., 2010). Fur­thermore, Tertiary relict floras contain numerous examples of clades of morphologically similar species within which are nested clades of more distinctive species (Milne and Abbott, 2002); Nyssa fits this pattern. Hence it is likely that N. sinensis, N. shangszeensis, N. shweliensis and N. wenshanensis diverged recently, perhaps as a result of qua­ternary climatic oscillations.
With this being the case, recognition of these four spe­cies as distinct from one another must depend upon other factors, such as morphology. Although all four were recog­nized by both Wen (1993) and Qin and Phengklai (2007),
our data indicates that some re-evaluation of these taxa might be necessary. The non-monophyly of N. shweliensis for ITS might indicate that this comprises two cryptic spe­cies, but the cpDNA provides no evidence either way so this possibility in particular requires further investigation.
Regarding biogeography, both cpDNA and ITS data indicate that East Asian Nyssa do not form a monophyletic group, because N. javanica and N. yunnanensis are basal in both ITS and cpDNA analyses, with the American N. sylvatica sister to the remaining species. This correlates well with the analysis of Eyde (1963) who concluded based on fossil morphology that N. sinensis was more closely-related to N. sylvatica than N. javanica. Clearly the inclusion of only one non-Asian species in our analysis limits what can be inferred, but the simplest explanation for these results would be that Nyssa originated in eastern Asia and that subsequently one (or more) lineages moved into the Americas.
Conclusion
Our data indicates that Nyssa in eastern Asia comprises three relatively old lineages, i.e. N. javanica, N. yunnanen-sis and all other species (bearing in mind that relationships of N. leptophylla remain uncertain), and that recent diver­sification within the latter clade has given rise to much of the morphological diversity now evident in eastern Asian Nyssa. Our data hence rejects the grouping together of N. yunnanensis, N. wenshanensis and N. javanica as a spe­cies complex, and instead indicates that N. wenshanensis, N. shangszeensis, N. shweliensis, N. sinensis and possibly N. leptophylla might form a complex, either of recently diverged species or of taxa that are not truly distinct at specific level.
In spite of potential taxonomical problems in Nyssa, among the studied loci, ITS appeared to be the best bar­code candidate for Nyssaceae. To get a whole picture of the taxonomy of Nyssa, a detailed morphological study of Nyssa combined with more rapidly evolving loci is need­ed.
Acknowledgements. We sincerely thank Yu-Xiao Zhang and Zhao-Ming Cai, at Kunming Institute of Botany, Chi­nese Academy of Sciences (CAS), for their help with labo­ratory work and data analysis. The research was funded by the Natural Science Foundation of China (No. 30770139), the Bureau of Science and Technology of Yunnan, China (No. 2009BB001), the Large-Scale Scientific Facilities of the Chinese Academy of Sciences (No. 2009-LSF-GBOWS-01), GBOWS and by CAS Young Scientists Fel-lowship (2009YB1-13) and NSFC Research Fellowship for International Young Scientists (40950110338) to F. M. B. Jacques.
LITERATURE CITED
Airy Shaw, H.K. 1969. An overlooked Chinese Nyssa. Kew Bull. 23: 311.
CBOL Plant Working Group. 2009. A DNA barcode for land plants. Proc. Nat. Acad. Sci. USA 106: 12794-12797.
Chase, M.W., N. Salamin, M. Wilkinson, J.M. Dunwell, R.P. Ke-sanakurthi, N. Haidar, and V. Savolainen. 2005. Land plants and DNA barcodes: short-term and long-term goals. Phil. Trans. R. Soc. Lond. B. 360: 1889-1895.
Chen, S.L., H. Yao, J.P. Han, C. Liu, J.Y. Song, L.C. Shi, Y.J. Zhu, X.Y. Ma, T. Gao, X.H. Pang, K. Luo, Y. Li, X.W. Li,
X.C. Jia, Y.L. Lin, and C. Leon. 2010. Validation of the
ITS2 region as a novel DNA barcode for identifying me­dicinal plant species. PloS One. 5: 1-8.
Cronquist, A. 1981. An Integerated System of Classification of Flowering Plants. Columbia University, New York.
Doyle, J.J. and J.L. Doyle. 1987. A rapid DNA isolation proce-dure for small quantities of fresh leaf tissue. Phytochem. Bull. 19: 11-15.
Dunning, L.T. and V Savolainen. 2010. Broad-scale amplifica-
WANG et al. ― DNA barcoding of Nyssaceae
273
tion of matK for DNA barcoding plants, a technical note.
Bot. J. Linn. Soc. 164: 1-9.
Eyde, R.H. 1963. Morphological and paleobotanical studies of the Nyssaceae. A survey of the modern species and their
fruits. J. Arnold Arbor. 44: 328-376.
Fang, W.P. and Z.P. Song. 1975. Praecursors Florae Nyssace-arum Sinensium. Acta. Bot. Sin. 2: 83-89.
Fazekas, A.J., K.S. Burgess, P.R. Kesanakurti, S.W. Graham, S.G. Newmaster, B.C. Husband, D.M. Percy, M. Hajiba-baei, and S.C.H. Barrett. 2008. Multiple multilocus DNA
barcodes from the plastid genome discriminate plant species
equally well. PLoS One 3: e2802. Ford, C.S., K.L. Ayres, N. Toomey, N. Haider, J. Van A. Stahl,
L.J. Kelly, N. Wikstrom, P.M. Hollingsworth, R.J. Duff, S. Hoot, R.S. Cowan, M.W. Chase, and M.J. Wilkinson. 2009. Selection of candidate coding DNA barcoding regions for use on land plants. Bot. J. Linn. Soc. 159: 1-11.
Hebert, P.D.N., N.A. Cywinska, S.L. Ball, and J.R. Ward. 2003. Biological identifications through DNA barcodes. Phil. Trans. R. Soc. Lond. B. 270: 313-321.
Hebert, P.D.N., M.Y. Stoeckle, T.S. Zemlak, and C.M. Francis.
2004. Identification of birds through DNA barcodes. PLoS
Biol. 2: 1657-1663.
He, Z., J.Q. Li, and H.C. Wang. 2004. Karyomorphology of Da-vidia involucrata and Camptotheca acuminata, with special reference to their systematic positions. Bot. J. Linn. Soc.
144: 193-198.
Hollingsworth, M.L., A.A. Clark, L.L. Forrest, J. Richardson,
R.T. Pennington, D.G. Long, R. Cowan, M.W. Chase, M.
Gaudeul, and P.M. Hollingsworth. 2009. Selecting barcod-ing loci for plants: evaluation of seven candidate loci with species-level sampling in three divergent groups of land
plants. Mol. Ecol. Res. 9: 439-457.
King, M.G. and E.H. Roalson. 2008. Exploring evolutionary dy­namics of nrDNA in Carex subgenus Vignea (Cyperaceae). Syst. Bot. 33: 514-524.
Ivanova, N.V., N.J. Fazekas, and P.D.N. Hebert. 2008. Semi-
automated, membrane-based protocol for DNA isolation
from plants. Plant Mol. Biol. Rep. 26: 186-198. Kress, W.J., K.J. Wurdack, E.A. Zimmer, L.A. Weigt, and D.H.
Janzen. 2005. Use of DNA barcodes to identify flowering plants. Proc. Nat. Acad. Sci. USA 102: 8369-8374.
Kress, J.W. and D.L. Erickson. 2007. A two-locus global DNA
barcode for land plants: the coding rbcL gene complements the non-coding trnH-psbA spacer region. PLoS One 2:e508.
Lakra, W.S., M.S. Verma, M. Goswami, K.K. Lal, V. Mohindra, P. Punia, A. Gopalakrishnan, K.V. Singh, R.D. Ward, and P. Hebert. 2011. DNA barcoding Indian marine fishes. Mol. Ecol. Res. 11: 60-71.
Liu, Y., H.F. Yan, T. Cao, and X.J. Ge. 2010. Evaluation of 10
plant barcodes in Bryophyta (Mosses). J. Syst. Evol. 48: 36­46.
Meier, R., G.Y. Zhang, and F. Ali. 2008. The use of mean instead
of smallest interspecific distances exaggerates the size of the "barcoding gap" and leads to misidentification. Syst.
Biol. 57: 809-813.
Milne, R.I. 2004. Phylogeny and biogeography of Rhododendron subsection Pontica, a group with a Tertiary relict distribu­tion. Mol. Phyloge. Evol. 33: 389-401.
Milne, R.I., C. Davies, R. Prickett, L.H. Inns, and D.F. Cham­berlain. 2010. Phylogeny of Rhododendron subgenus Hy-menanthes based on chloroplast DNA markers: between-lineage hybridisation during adaptive radiation? Plant Syst. Evol. 285: 234-244.
Milne, R.I. and R.J. Abbott. 2002. The origin and evolution of tertiary relict floras. Adv. Bot. Res. 38: 282-309.
Nei, M. and S. Kumar. 2000. Molecular Evolution and Phyloge-netics. Oxford University Press, Oxford.
Newmaster, S.G. and S. Ragupathy. 2009. Testing plant barcod-ing in a sister species complex of pantropical Acacia (Mi-mosoideae, Fabaceae). Mol. Ecol. Res. 9: 172-180.
Newmaster, S.G., A.J. Fazekas, R.A.D. Steeves, and J. Janovec. 2008. Testing candidate plant barcode regions in the Myris-
ticaceae. Mol. Ecol. Res. 8: 480-490.
Pennisi, E. 2007. Wanted: a barcode for plants. Science 318:
Pettengill, J.B. and M.C. Neel. 2010. An evaluation of candidate plant DNA barcodes and assignment methods in diagnosing 29 species in the genus Agalinis (Orobanchaceae). Amer. J.
Bot. 97: 1391-1406.
Qin, H.N. and C. Phengklai. 2007. Nyssaceae. In Z.Y. Wu, P.H. Raven and D.Y. Hong (eds.), Flora of China 13. Science Press, Beijing; Missouri Botanical Garden Press, St. Louis,
pp. 300-303.
Ragupathy, S., S.G. Newmaster, V. Balasubramaniam, and M. Murugesan. 2009. DNA barcoding discriminates a new cryptic grass species revealed in an ethnobotany study by the hill tribes of the Western Ghats in southern India. Mol. Ecol. Res. 9: 439-457.
Ratnasingham, S. and P.D.N. Hebert. 2007. BOLD: the Barcode of Life Data System (http://wwwbarcodinglifeorg). Mol. Ecol. Notes 7: 355-364.
Sass, C., D.P. Little, D.W. Stevenson, and C.D. Specht. 2007. DNA barcoding in the Cycadales: testing the potential of proposed barcoding markers for species identification of cycads. PLoS ONE 2: e1154.
Savolainen, V., R.S. Cowan, A.P. Vogler, G.K. Roderick, and R. Lane. 2005. Towards writing the encyclopedia of life: an introduction to DNA barcoding. Phil. Trans. R. Soc. Lond. B. 360: 1850-1811.
Shaw, J., E.B. Lickey, E.E. Schilling, and R.L. Small. 2007.
tortoise and the hare III. Amer. J. Bot. 94: 275-288.
Starr, J.R., R.F.C. Naczi, and B.N. Chouinard. 2009. Plant DNA barcodes and species resolution in sedges (Carex, Cyper-
aceae). Mol. Ecol. Res. 9: 151-163.
274
Botanical Studies, Vol. 53, 2012
Sun, B.L. 2008. Taxonomy of Nyssa L. (Nyssaceae) and con­servation biology of Nyssa yunnanensis, a critically en­dangered species. Ph.D. Dissertation. Kunming: Kunming Institute of Botany, Chinese Academy of Sciences.
Sundberg, P., E.T. Vodoti, and M. Strand. 2010. DNA barcod-ing should accompany taxonomy - the case of Cerebratulus spp. (Nemertea). Mol. Ecol. Res. 10: 274-281.
Swofford, D.L. 2002. PAUP: phylogenetic analysis using parsi­mony, version 4.0b10. Sinauer, Sunderland, Massachusetts, USA.
Tamura, K., J. Dudley, M. Nei, and S. Kumar. 2007. MEGA4:molecular evolutionary genetics analysis (MEGA) software version 4.0. Mol. Biol. Evol. 24: 1596-1599.
Tamura, K., M. Nei, and S. Kumar. 2004. Prospects for infer­ring very large phylogenies by using the neighbor-joining method. Proc. Nat. Acad. Sci. USA 101: 11030-11035.
Thompson, J.D., T.J. Gibson, F. Plewniak, F. Jeanmougin, and D.G. Higgins. 1997. The Clustal X windows interface: flex­ible strategies for multiple sequence alignment aided by
quality analysis tools. Nucl. Acids Res. 24: 4876-4882.
Tate, J.A. and B.B. Simpson. 2003. Paraphyly of Tarasa (Mal­vaceae) and diverse origins of the polyploid species. Syst. Bot. 28: 723-737.
Wang, N. 2010. Natural hybrid origin of Rhododendron irrora-tum Franch. (Ericaceae) in Yunnan, China. MSc Thesis. Kunming: Kunming Institute of Botany, Chinese Academy of Sciences.
Ward, R.D., T.S. Zemlak, B.H. Innes, P.R. Last, and P.D.N. He-
bert. 2005. DNA barcoding Australia's fish species. Phil.
Trans. R. Soc. Lond. B. 360: 1847-1857.
Wen, J. and T.F. Stuessy. 1993. The phylogeny and biogeography of Nyssa (Cornaceae). Syst. Bot. 18: 68-79.
Wu, C.Y. and J.R. Fan. 1977. Nyssaceae. In C.Y. Wu (ed.), Flora Yunnanica, Vol. 1. Science Press, Beijing, pp. 288-293.
Wu, C.Y., A.M. Lu, Y.C. Tang, Z.D. Chen, and D.Z. Li (eds.).
2003. The families and genera of angiosperms in China: A comprehensive analysis. Science Press, Beijing.
DNA條碼在藍果樹科(Nyssaceae)植物中的應用及分類探討
王 年1,2 Frédéric M.B. JACQUES3  Richard I. MILNE4 張長芹 楊俊波
1中國科學院昆明植物硏究所
2中國科學院植物硏究所植物資源與生物技術重點實驗室
3中國科學院地理與古植物硏究所古植物與孢!粉學硏究室
4英國愛丁堡大學植物分子生物學硏究室
5中國科學院昆明植物硏究所中國西南野生植物種植資源庫
DNA條碼,作為物種鑒別工具,在動物中得到廣泛應用。然而對於植物,其標準DNA條碼仍
沒確定。在本研究中,我們評價了四個候選條碼
(matK, rbcL, trnH-psbAITS)在九種藍果樹科
(Nyssaceae)植物中的應用。結果表明,作為陸地植物核心條碼matK + rbcL在該科中表現不佳而ITS
表現最好。與ITS相比,這幾個葉綠體基因的鑒別率較低,可能由於該科藍果樹屬(Nyssa)存在種間
分類問題。研究還表明,上思藍果樹
(N. shangszeensis)、中華藍果樹 (N. sinensis)、瑞麗藍果樹(N.
shweliensis
)以及文山藍果樹 (N. wennshhannennsis) 是否成立有待結合形態學及進化速率較快的基因進一
步確定。
關鍵詞:DNA條碼;ITS matK ;藍果樹科;rbcL trnH-psbA 。