Botanical Studies (2012) 53: 363-376.
GENETIC DIVERSITY
Genetic diversity of rice germplasm used in Taiwan breeding programs
Hung-Ying LIN1, Yong-Pei WU2, Ai-Ling HOUR3, Sheng-Wei HO1, Fu-Jin WEI1' 4, Yue-Ie C. HSING1,4, and Yann-Rong LIN1*
1Department of Agronomy, National Taiwan University, Taipei 106, Taiwan
2Department of Agronomy, Chiayi Agricultural Experiment Station, Taiwan Agricultural Research Institute, Chiayi 600,Taiwan
3Department of Life Science, Fu-Jen Catholic University, Xinzhuang Dist., New Taipei City 242, Taiwan
4Institute of Plant and Microbial Biology, Academic Sinica, Nankang, Taipei 115, Taiwan
(Received February 16, 2012; Accepted May 25, 2012)
ABSTRACT. Rice is one of the most important cereal crops in the world and is the major crop in Taiwan. Assessment of genetic diversity of rice germplasm is imperative for conservation and breeding. We used 114 simple sequence repeat (SSR) and 5 sequence tagged site (STS) markers with 80 common rice varieties, in­cluding 52 japonica and 28 indica varieties used in Taiwan breeding programs, and detected 395 alleles. The mean number of alleles per marker was 3.5, range 2 to 7. The mean polymorphism information content (PIC) for each marker was 0.43 (range 0.04-0.76). The japonica and indica varieties were obviously separated into clusters by the distance-based unweighted pair-group method with averages (UPGMA) and principal coordi­nate analysis (PCoA). Taiwan and Japanese japonica varieties aggregated in the same clusters because of their highly similar genetic background. The genetic diversity was greater for indica than japonica varieties. The genetic diversity of Taiwan cultivars was relatively narrow, specifically in japonica varieties, and introduced exotic elite cultivars exhibited enriched alleles. The differentiation of domestic and introduced indica cultivars was moderate (Fst =0.25), which was the same revealed japonica cultivars (Fst =0.15). However, there was no significant differentiation between Taiwan and Japanese japonica cultivars as supported by the small Fst (0.05); thus, introducing exotic germplasm other than from Japan should enlarge the gene pool of Taiwan cul-tivars. This DNA polymorphism analysis revealed genomic relationships in Taiwan rice germplasm, and the database on 'The Resource of Rice Genetic Markers in Taiwan' is useful for cultivar identification, local ger-mplasm conservation and breeding programs.
Keywords: Genetic diversity; Rice (Oryza sativa); SSR markers; Taiwan rice cultivar.
INTRODUCTION
distinct morphologic features of indica and japonica rice, they were recorded as Hsien and Keng, respectively, dur­ing the Han dynasty in China (Chou, 1948). Later, five separate groups were classified, and the evolutionary re­lationship was found closely between the indica and aus groups, and among tropical japonica, temperate japonica, and aromatic groups by analyses of genetic diversity and population structure (Garris et al., 2005).
Rice is one of the most important cereal crops in the world and provides more than 50% of the calories con­sumed by humans in Asia (Khush, 1997). The two culti­vated rice species are Oryza sativa, widely grown in Asia and other countries, and O. glaberrima, grown in Africa only. O. sativa evolved from perennial or annual types of O. rufipogon and diversified into two subspecies, indica and japonica (Oka, 1974; Chang, 1985). Ancient indica and japonica diversified at estimated 200,000~440,000 and 86,000~200,000 years ago according to the nuclear genome and chloroplast DNA sequence, respectively (Ma and Bennetzen, 2004; Vitte et al., 2004). Two possible centers of domestication are proposed: japonica arising in the Yangtze and Yellow River Basin of China, and indica arising in South Asia (Khush, 1997). On the basis of the
Many rice genotypes have evolved to adapt to vari­ous environments, including irrigated, rain-fed lowland, and upland ecosystems between 55 N° and 36 S° latitude (Khush, 1997). More than 780,000 varieties have been collected worldwide; 109,136 varieties are deposited in the International Rice Genebank of the International Rice Research Institute (IRRI), and more than 80,000 and 70,000 varieties have been collected in India and China (FAO, 2009). The genetic diversity of rice germplasm was assessed by use of molecular markers, such as Restric­tion Fragment Length Polymorphism (RFLP), Random Amplified Polymorphic DNA (RAPD), and Simple Se-

*Corresponding author: E-mail: ylin@ntu.edu.tw; Tel: +886­2-33664763; Fax: +886-2-23620879.
364
Botanical Studies, Vol. 53, 2012
quence Repeats (SSRs). SSRs have been frequently used in genetic and breeding research because of relatively high allelic polymorphism and easy genotyping by PCR. Moreover, approximately 20,000 SSR markers were mined from the genome sequence of japonica cv. Nipponbare and are publicly accessible (IRGSP, 2005). Thus, SSR mark­ers have been extensively used in evaluating the genetic diversity of wild relatives, landraces, and cultivars of rice (Ram et al., 2007; Pusadee et al., 2009; Thomson et al., 2007, 2009). For example, SSRs were used to cluster rice landraces collected from Yunnan into 7 subgroups corre­sponding to subspecies, soil-watery species, and seasonal ecotype (Zhang et al., 2007). As well, the genetic diversity of rice was not decreased when comparing the major rice varieties planted in the 1950s and the past decade in China with use of SSRs (Yuan et al., 2007). SSRs were used in identifying varieties and authenticating polished rice sold in markets in Taiwan (Chuang et al., 2011).
By pedigree analysis, 99 varieties released before 1988 were bred by using germplam introduced largely from Japan, and 10 major parental varieties, except one Taiwan landrace Oloan-chu, were from Japan (Lin, 1991a). Im­proving grain quality has been a high priority; therefore, elite Japanese cultivars with good grain appearance and eating quality have been used in modern rice-breeding programs. Because 85% of Taiwan varieties descended from Japanese varieties, the genetic diversity of modern cultivars was expected to be very narrow (Wu and Lin, 2008). Nevertheless, germplasm introduced from IRRI the Philippines and other countries has been incorporated into rice breeding programs to increase the gene pool of cul-tivars and to breed new varieties with resistance to biotic and abiotic stresses later on.
In this study, we employed molecular markers rather than pedigree analysis to evaluate the genetic diversity of modern elite cultivars and common germplasm used in rice breeding programs in Taiwan. We used 80 varieties geno-typed with 119 PCR-based markers to reveal the genetic relationship based on phylogenetic tree analysis, genetic diversity, and principal coordinate analysis (PCoA). This study provides substantial information to maintain and use rice genetic resources in breeding and in researches of ge­netic diversity and linkage analysis.
During domestication, some key agronomy traits, such as grain shattering, grain dormancy, and grain size, were strongly selected, which led to greatly diminished genetic diversity in rice. The rice genome encountered a severe early domestication bottleneck; thus, landraces represent only small proportion of the genetic variation of wild rice (Kovach and McCouch, 2008). Moreover, modern breed­ing programs continuously select desirable characters under highly controlled conditions to achieve an ideotype, which exacerbates the reduction in gene pool of cultivars (McCouch, 2004). The genetic diversity of japonica and indica cultivars is only 10% and 20% of wild rice; japon-ica encountered greater bottleneck stringency than did indica (Caicedo et al., 2007). In Taiwan, the genetic diver­sity of japonica varieties was relative narrow, which was revealed by two varieties had great genetic contribution to the varieties released between 1940 and 1987 and by the field uniformity of japonica rice (Lin, 1991a, b).
MATERIALS AND METHODS
Plant materials
We used 80 rice varieties (Oryza sativa), encompass­ing modern elite cultivars, and domestic and imported germplasm in Taiwan, to evaluate genetic diversity: 52 japonica varieties, including 24 from Taiwan and 28 from abroad; and 28 indica varieties, including 10 from Taiwan and 18 from abroad (Table 1). To achieve a breeding goal of grain quality, most of the varieties selected have good taste or aroma; examples are Taikeng 2, Taikeng 8, Kaoh-siung 139, Kaohsiung 145, Taitung 30, and Tainung 71. The other Taiwan varieties have resistance to brown plant hopper and rice blast (Table 1). The introduction of exotic germplasm and elite cultivars has been routine work by introgressing useful genes and enlarging genetic diversity in rice breeding recently. To improve grain quality, several varieties were introduced from Japan, including the lead­ing varieties, Koshihikari, and Kinuhikari. To improve insect and disease resistance, several varieties were intro­duced from IRRI. Some exotic varieties possess abiotic resistant genes or high yield (Table 1). In addition, we included japonica cv. Nipponbare and indica 93-11, whose genomes have been sequenced for basic scientific research (IRGSP, 2005; Yu et al., 2002).
To breed new varieties for facing the effects of global climate change, the gene pool of cultivars must be broad­ened by introducing wild species, landraces, and exotic germplasm into breeding programs. Wild species, resistant to biotic and abiotic stresses, are an important genetic resource (Khush, 1997). However, the incompatibility of wild species with cultivars delimits the introgression of wild species' genes to cultivars (Brar and Khush, 1997). Landraces whose seeds are maintained by farmers still contain useful genes (Jackson, 1997; Thomson et al., 2007; Pusadee et al., 2009). Many genes conferring resistance to abiotic and biotic stresses, such as salinity, rice stripe virus, and rice blast, are preserved and are used in mod­ern breeding programs (Shi et al., 2010). Nevertheless, inferior genes might be introgressed along with favorable genes because of linkage drag, which impedes breeding efficiency to obtain elite varieties. To avoid the shortage of introgressing genes from wild rice and landraces, the intro­duction of exotic elite cultivars is common to increase the gene pool of domestic cultivars, which has been routinely used in rice breeding programs in Taiwan.
Assessment of molecular marker genotypes
The extraction of rice nuclear genomic DNA was as de­scribed (Lin et al., 2011). We used 119 molecular markers, including 114 SSRs with the prefix RM and 5 STSs with the prefixes C, E, S, and STS to evaluate genetic diversity.
LIN et al. ― Genetic diversity of rice-breeding germplasm in Taiwan
365
Table 1. The origins and major important traits of 80 rice varieties.

Varietya

Subspecies

Origin

Major important trait

Chianung 242 (CN 242)

japonica

Taiwan

Rice blast resistance
Hsinchu 64 (HC 64)
japonica
Taiwan
Brown planthopper resistance
Hualien 19 (HL 19)
japonica
Taiwan
Rice blast resistance
Kaohsiung 139 (KH 139)
japonica
Taiwan
Rice blast resistance
Kaohsiung 143 (KH 143)
japonica
Taiwan
Good taste quality
Kwangfu 1 (KF 1)
japonica
Taiwan
Rice blast resistance
Taichung 65 (TC 65)
japonica
Taiwan
Photoperiod insensitivity
Taikeng 2 (TK 2)
japonica
Taiwan
Brown planthopper resistance
Taikeng 8 (TK 8)
japonica
Taiwan
Good taste quality
Taikeng 14 (TK 14)
japonica
Taiwan
High yield
Taikeng 16 (TK 16)
japonica
Taiwan
Brown planthopper resistance
Taikeng 17 (TK 17)
japonica
Taiwan
Good taste quality
Taikeng Glutinous1 (TKG 1)
japonica
Taiwan
Good taste quality
Tainan 5 (TN 5)
japonica
Taiwan
Good taste quality
Tainung 67 (TNG 67)
japonica
Taiwan
High yield
Tainung 69 (TNG 69)
japonica
Taiwan
Rice blast resistance
Tainung 70 (TNG 70)
japonica
Taiwan
Rice blast resistance
Tainung 71 (TNG 71)
japonica
Taiwan
Taro aroma
Tainung 72 (TNG 72)
japonica
Taiwan
Good taste quality
Taitung 29 (TT 29)
japonica
Taiwan
Rice blast resistance
Taitung 30 (TT 30)
japonica
Taiwan
Brown planthopper resistance
Taoyuan 1 (TY 1)
japonica
Taiwan
Good taste quality
Taoyuan Glutinous 2 (TYG 2)
japonica
Taiwan
Cold tolerance
Tung Lu 1 (TL 1)
japonica
Taiwan
Rice blast resistance
Akitakomachi (ATM)
japonica
Japan
Good taste quality
Chiyonisiki (CNK)
japonica
Japan
Lodging resistance
Fukunikari (FNR)
japonica
Japan
Good taste quality
Hoshiyutaka (HYK)
japonica
Japan
High amylose content
Kinuhikari (KHR)
japonica
Japan
Good rice appearance
Koshihikari (KHR)
japonica
Japan
Good taste quality
Nipponbare (NB)
japonica
Japan
Lodging resistance
Todorokiwase (TRW)
japonica
Japan
Cold tolerance
Toyonishiki (TNK)
japonica
Japan
Early maturity
Tsukinohikari (TNK)
japonica
Japan
Good taste quality
Milagrosa
japonica
Philippines
Aroma
Milfor
japonica
Philippines
High yield
Della
japonica
U.S.A
Aroma
L202
japonica
U.S.A
Lodging resistance
M103
japonica
U.S.A
Salt tolerance
M202
japonica
U.S.A
Early maturity
M401
japonica
U.S.A
High yield

366
Botanical Studies, Vol. 53, 2012
Table 1. (Continued)

Varietya

Subspecies

Origin

Major important trait

Nortai

japonica

U.S.A

Low protein content
S301
japonica
U.S.A
High protein content
Giza 4120-205
japonica
Egypt
Rice blast resistance
Gz 5379
japonica
Egypt
Good taste quality
MGG
japonica
Haiti
Start Bomet
japonica
Haiti
Basmati 370
japonica
India
Aroma
Basmati T3
japonica
India
Aroma
Parkistam Basmati
japonica
Pakistan
Aroma
Khao-kueng
japonica
Thailand
Ku79-2
japonica
Chianung Sen 11 (CNS 11)
indica
Taiwan
Rice blast resistance
Kaohsiung Sen 7 (KHS 7)
indica
Taiwan
Sheath blight resistance
Tai Sen 2 (TS 2)
indica
Taiwan
Rice blast resistance
Tai Sen Glutinous 2 (TSG 2)
indica
Taiwan
Cold tolerance
Taichung Sen 3 (TCS 3)
indica
Taiwan
Rice blast resistance
Taichung Sen 10 (TCS 10)
indica
Taiwan
Sheath rot resistance
Taichung Sen 17 (TCS 17)
indica
Taiwan
Lodging resistance
Tainung Sen 14 (TNS 14)
indica
Taiwan
Rice blast resistance
Tainung Sen 19 (TNS 19)
indica
Taiwan
Rice blast resistance
Tainung Sen 20 (TNS 20)
indica
Taiwan
Rice blast resistance
Khosakau
indica
Japan
PsBRc4
indica
Philippines
Green rice leafhopper resistance
PsBRc10
indica
Philippines
Green rice leafhopper resistance
PsBRc18
indica
Philippines
Green rice leafhopper resistance
PsBRc20
indica
Philippines
High yield
IR29
indica
IRRI
Bacterial leaf blight resistance
IR30
indica
IRRI
Bacterial leaf blight resistance
IR36
indica
IRRI
Brown planthopper resistance
IR64
indica
IRRI
Brown planthopper resistance
IR72
indica
IRRI
Brown planthopper resistance
IR1545-339
indica
IRRI
Bacterial leaf blight resistance
IR1552
indica
IRRI
Manganese resistance
IR2105
indica
IRRI
High yield
93-11
indica
China
Brown planthopper resistance
Huakeng 74 (HK 74)
indica
China
Bacterial leaf blight resistance
FKR19
indica
Burkina Faso
High yield
ASD16
indica
India
Brown planthopper resistance
Pokhareli
indica
Nepal
Low amylose content

aThe abbreviation of each variety is indicated in parentheses.
LIN et al. ― Genetic diversity of rice-breeding germplasm in Taiwan
367
All primer sequences and other information for SSRs can be accessed from Gramene (http://www.gramene.org). Four of the 5 STSs with prefixes C, E, and S were ob­tained from the Rice Genome Research Project (http://rgp. dna.affrc.go.jp, Inoue et al., 1994). The last STS marker, STS208 (F: 5'-CAAAGGTATGATGAGGATAAGG-3', R: 5'-TAGATTCGTCTCGCAGTTTAC-3') was designed as described (Wu et al., 2010). All markers displayed primary polymorphism between indica and japonica (Wu et al., 2010; Lin et al., 2011). PCR reactions and amplification were as described (Lin et al., 2011). The PCR products un­derwent electrophoresis on 2.5% of Super Fine Resolution (SFR) agarose (Amresco, Solon, Ohio, USA) by Rapid Agarose Electrophoresis (RAGE, Cascade Biologics, Port­land, Oregon, USA) in 1x TAE at 250 V for 20 mm. The resolution of the gel system was approximately 5 bp.
locus ranged from 2 to 7, and most markers, 43 (36.13%), revealed 3 alleles. The PIC value for each marker was used to assess the polymorphic level. The mean PIC value for markers was 0.43 with the range of 0.04 (RM6407) to 0.76 (RM481). According to the definition of informative level (Botstein et al. 1980), 35 (29.41%) and 76 (63.87%) mark-ers were highly and reasonably informative, respectively; only 8 (6.72%) were slightly informative. Overall, 119 markers provided sufficient informative polymorphism to evaluate genetic diversity of these 80 varieties.
Analysis of genetic distance
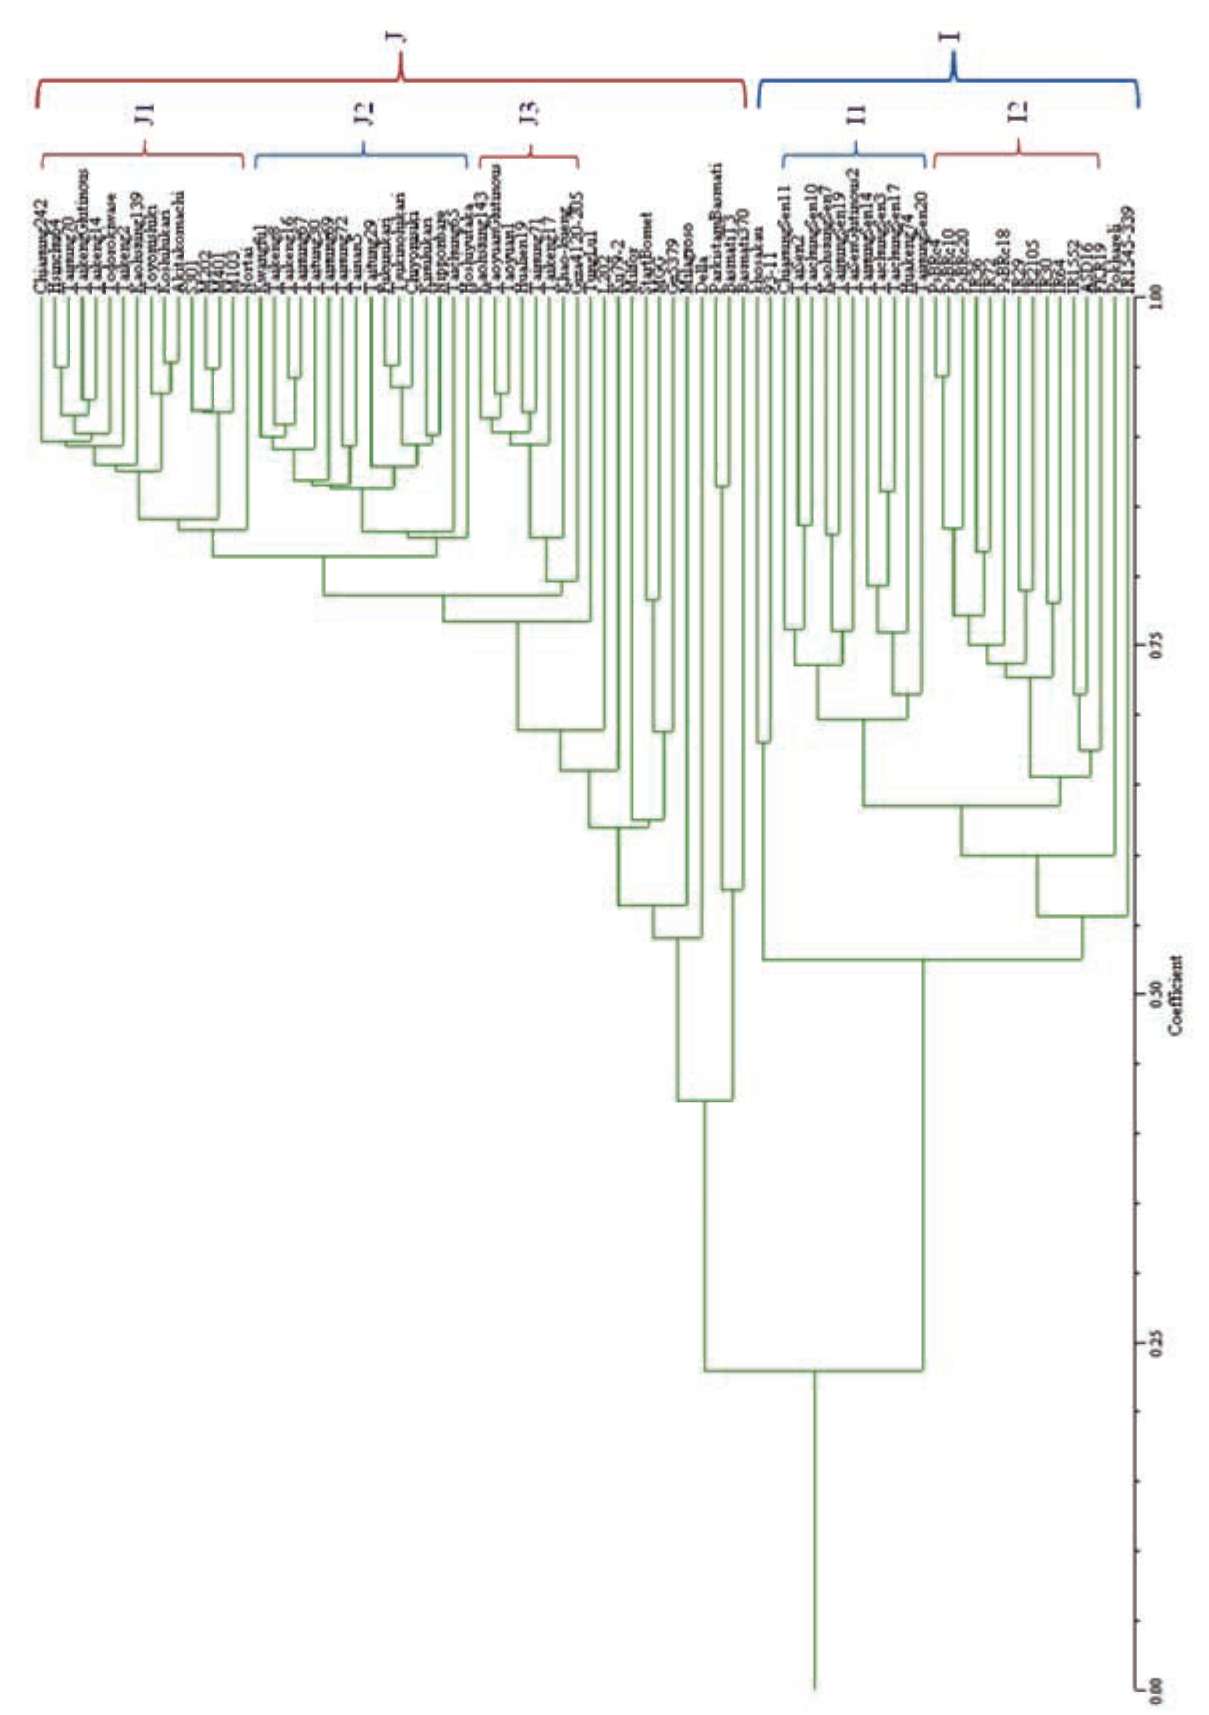
The Dice coefficient was used to assess genetic similar­ity between two varieties (Dice, 1945), which was conse­quently subjected to clustering analysis based on UPGMA to construct a dendrogram (Figure 1). The japonica and indica varieties were distinguishably separated into two major different groups with a similarity coefficient of 0.23. Subgroups of japonica and indica varieties further identified by high genetic similarity were classified into 3 clusters (clusters J1 to J3) and 2 clusters (clusters I1 and I2) with a similarity coefficient of 0.78 and 0.63, respec­tively. However, 12 japonica varieties and 4 indica variet­ies originated from several countries share great genetic dissimilarity, which were miscellaneous and not easily classified to suitable clusters. According to the Dice coeffi­cient, most japonica varieties, clusters J1 to J3, had greater genetic similarity than did indica clusters (Figure 1).
Data analysis
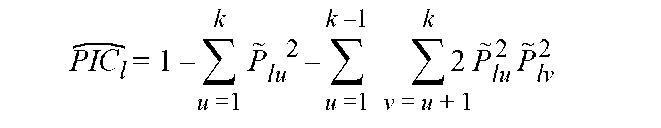
Because cultivated rice is inbred, one homozygous al-lele is revealed by one DNA band after gel electrophoresis, and one marker represents one locus for the 119 markers used in this study. Presence or absence of a specific allele was indicated as 1 or 0, respectively, and the matrix of 1 and 0 data underwent analysis by polymorphic informa­tion content (PIC), genetic similarity and Fst. The PIC was estimated as follows:
All Taiwan and Japanese japonica varieties were grouped into 3 clusters, clusters J1 to J3, and each clus­ter contained varieties from these two countries. Koshi-hikari, a leading Japanese variety well known to possess good grain quality, is closely related to Kaohsiung 139 from Taiwan, also with good grain quality. Several va­rieties released recently, Taikeng 8, Taikeng 16, Taitung 30, Tainung 69, Tainung 72, and Tainan 5, showed high genetic similarity and were grouped together in cluster J2 with Tainung 67, an elite germplasm that has under­gone modern rice breeding (Figure 1). Tung Lu 1, an old upland variety known as tropical japonica, showed little genetic similarity to the other temperate japonica varieties by UPGMA analysis and was not grouped into the other three major japonica clusters. Varieties introduced from the United States, such as M103, M202, M401, and S301, share a genetic background with a similarity coefficient of 0.91 and were clustered together in cluster J1 (Figure 1). Most varieties introduced from the other countries ex­hibited larger genetic distance than those introduced from Japan and the United States, which were classified as in japonica group but not easily separated as distinct clusters (Figure 1). Nevertheless, three aromatic varieties, Pakistan Basmati, Basmati T3, and Basmati 370, were in the same cluster, which was distinguished from the other japonica varieties.
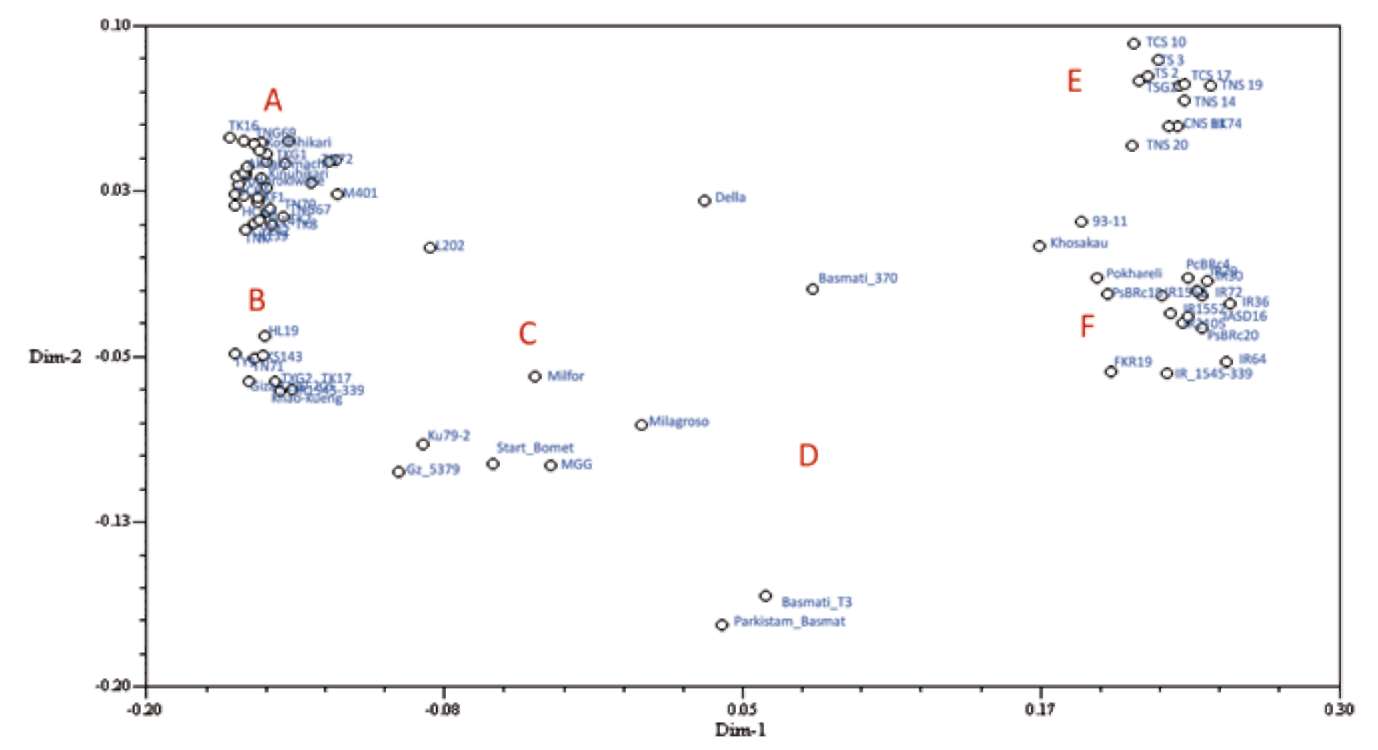
where l is locus; k is the number of alleles of locus l; Plu is the frequency of allele u; Plv is the frequency of allele v (Botstein et al., 1980). The PIC value for each marker was used to justify the polymorphic information, and the mean PIC value for a group of individuals implies the genetic di­versity within the group. Both the PIC for each marker and mean PIC for each group were determined by use of Pow-erMarker (Liu and Muse, 2005). Genetic similarity and dissimilarity were evaluated by modified Rogers' distance (Goodman and Stuber, 1983). We used sequential agglom-erative hierarchic non-overlapping (SAHN) clustering and then unweighted pair-group method with arithmetic mean (UPGMA) dendrogram to infer genetic relationships and construct a phylogenetic tree. Decnter and Eigene modules were used to transform and calculate two dimension of principle coordinate analysis (PCoA, Gower, 1966). UPG-MA and PCoA analysis involved use of NTSYS-pc v.2.21 (Rohlf, 2005).
RESULTS
Polymorphic levels of molecular markers
Using 114 SSR and 5 STS markers to analyze the ge­netic diversity of 80 modern cultivars and germplasm used in Taiwan rice-breeding programs, we found 395 alleles with a mean of 3.5 alleles (Table 2). The allele number per
All 28 indica varieties formed the indica group with 2 distinct clusters, clusters I1 and I2 (Figure 1). All Taiwan indica varieties shared high genetic similarity with the oth-
368
Botanical Studies, Vol. 53, 2012
Table 2. Polymorphic levels of 119 markers for genotyping 80 rice varieties.

Chr.

Markera

PIC

Chr.

Marker

PIC

Chr.

Marker

PIC

Chr.

Marker

PIC

1

RM3252 (6)

0.42

3

RM251 (5)

0.49

6

RM225 (3)

0.49

8

RM447 (3)

0.46
1
RM001 (4)
0.45
3
RM282 (2)
0.36
6
RM6734 (4)
0.49
9
S12569 (3)
0.59
1
RM243 (5)
0.34
3
RM016 (2)
0.36
6
RM253 (3)
0.52
9
RM3912 (2)
0.37
1
RM580 (6)
0.51
3
RM5626 (2)
0.15
6
RM276 (7)
0.67
9
RM257 (5)
0.60
1
RM009 (6)
0.50
3
RM135 (5)
0.54
6
RM527 (3)
0.41
9
RM278 (3)
0.39
1
RM246 (3)
0.43
3
RM168 (3)
0.31
6
RM3330 (3)
0.39
9
RM201 (4)
0.43
1
RM3411 (3)
0.39
3
RM186 (3)
0.28
6
RM541 (3)
0.39
9
RM3744 (2)
0.36
1
RM302 (4)
0.38
3
RM143 (5)
0.59
6
RM003 (4)
0.48
9
RM205 (3)
0.37
1
RM212 (2)
0.37
3
RM085 (3)
0.35
6
RM162 (4)
0.54
10
RM222 (3)
0.37
1
RM1387 (5)
0.59
4
RM551 (4)
0.35
6
RM528 (5)
0.53
10
C51124 (2)
0.37
1
RM104 (2)
0.37
4
RM518 (3)
0.55
6
RM030 (2)
0.34
10
RM3311 (2)
0.23
1
RM6407 (2)
0.04
4
RM5687 (3)
0.45
6
RM3138 (4)
0.47
10
RM1375 (7)
0.72
2
RM154 (4)
0.39
4
RM1359 (5)
0.50
6
RM340 (5)
0.62
10
RM258 (4)
0.45
2
RM211 (4)
0.35
4
RM252 (5)
0.47
7
RM481 (7)
0.76
10
RM6673 (5)
0.52
2
RM5780 (4)
0.52
4
RM470 (3)
0.39
7
RM125 (5)
0.39
10
RM333 (6)
0.72
2
RM145 (4)
0.44
4
RM6089 (2)
0.37
7
RM214 (3)
0.49
10
RM496 (4)
0.42
2
RM5356 (3)
0.42
4
RM567 (3)
0.18
7
RM6767 (3)
0.52
11
RM286 (3)
0.52
2
RM324 (4)
0.49
5
RM1024 (3)
0.38
7
RM011 (3)
0.42
11
RM167 (2)
0.36
2
RM341 (4)
0.40
5
RM267 (2)
0.37
7
RM010 (3)
0.51
11
RM536 (3)
0.50
2
RM475 (3)
0.57
5
E3528 (3)
0.37
7
RM3826 (3)
0.45
11
RM287 (2)
0.30
2
RM263 (3)
0.40
5
RM289 (3)
0.36
7
RM234 (4)
0.41
11
RM021 (4)
0.59
2
RM1367 (4)
0.45
5
RM3838 (3)
0.15
7
RM420 (2)
0.38
11
RM206 (7)
0.61
2
RM240 (3)
0.38
5
RM430 (4)
0.51
8
RM152 (4)
0.54
11
RM224 (5)
0.57
2
RM250 (2)
0.37
5
RM161 (2)
0.35
8
RM1376 (2)
0.26
12
RM019 (3)
0.42
2
RM207 (7)
0.64
5
STS208 (2)
0.36
8
RM025 (2)
0.15
12
RM101 (2)
0.37
3
RM022 (2)
0.36
5
RM480 (3)
0.47
8
RM072 (4)
0.61
12
RM247 (4)
0.47
3
RM6038 (3)
0.38
5
E1113 (2)
0.34
8
RM331 (2)
0.36
12
RM270 (2)
0.38
3
RM545 (5)
0.52
6
RM508 (3)
0.52
8
RM515 (3)
0.45
12
RM235 (5)
0.51
3
RM517 (2)
0.17
6
RM190 (3)
0.53
8
RM223 (3)
0.38
12
RM017 (3)
0.34
3
RM218 (5)
0.63
6
RM584 (3)
0.43
8
RM256 (2)
0.11


aThe number in parentheses indicates the number of alleles of markers detected in the 80 varieties.
ers introduced from abroad, which led to their grouping in one cluster by UPGMA analysis. Taichung Sen 3 and Tai-chung Sen 17, with a similarity coefficient of 0.86, were more related to each other than to the others in cluster I1. All varieties introduced through IRRI and the Philippines, except for IR1545-339 with rice blast resistance, were in the same cluster, which revealed high genetic similarity with a similarity coefficient of 0.73. Two varieties, 93-11
from China and Khosakau from Japan, showed great dis­similarity to the other indica varieties and clustered each other (Figure 1). One unexpected clustering result was Huakeng 74, a Chinese japonica variety, related to Taiwan indica varieties.
The genetic relationship among these 80 varieties was assessed by PCoA based on the modified Roger's dis­tance (Goodman and Stuber, 1983). The first and second
LIN et al. ― Genetic diversity of rice-breeding germplasm in Taiwan
369
Figure 1. Dendrogram of 80 rice varieties in Taiwan based on unweighted pair-group method with averages. Two major groups corre­sponding to japonica and indica rice were indicated as J and I, respectively. The three distinct clusters of japonica group were assigned as cluster J1, J2, and J3; the two distinct clusters of indica group were assigned as cluster I1 and I2. The X axis indicates the Dice simi­larity coefficient.
370
Botanical Studies, Vol. 53, 2012
Table 3. The clusters formed by principal coordinate analysis.

Cluster

Variety

A

Akitakomachi, Chianung 242, Chiyonisiki, Fukunikari, Hoshiyutaka, Hsinchu 64, Kaohsiung 139, Khosakau,
Kinuhikari, Koshihikari, Kwangfu 1, M103, M202, M401, Nipponbare, Nortai, S301, Taichung 65, Taikeng 14,
Taikeng 16, Taikeng 2, Taikeng 8, Taikeng Glutinous 1, Tainan 5, Tainung 67, Tainung 69, Tainung 70, Tainung 72,
Taitung 29, Taitung 30, Todorokiwase, Toyonishiki, Tsukinohikari, Tung Lu 1
B
Giza 4120-205, Hualien 19, Kaohsiung 143, Khao-kueng, Taikeng 17, Tainung 71, Taoyuan 1, Taoyuan Glutinous 2
C
Della, Gz5379, Ku79-2, L202, MGG, Milagroso, Milfor, Start Bomet
D
Basamati 370, Basmati T3, Pakistam Basmati
E
Chianung Sen 11, Huakeng 74, Tai Sen 2, Tai Sen Glutinous 2, Taichung Sen 10, Taichung Sen 17, Taichung Sen 3, Tai-
nung Sen 14, Tainung Sen 19, Tainung Sen 20
F
93-11, ASD16, FKR19, IR1545-339, IR1552, IR2105, IR29, IR30, IR36, IR64, IR72, Khosakau, Pokhareli, PsBRc10,
PsBRc18, PsBRc20, PsBRc4

dimensions of PCoA explained 18.03% and 1.87% of the genetic diversity, respectively. In total, 52 japonica va­rieties showed close distribution and were classified into four clusters (Table 3; Figure 2). All japonica varieties introduced from Japan were aggregated in cluster A, and most Taiwan japonica varieties were also in cluster A; 6 varieties were separate from the others and formed another cluster, cluster B. Four American varieties shared genetic similarity and were in cluster A. These 2 clusters, clusters A and B, were corresponded to the 3 clusters, clusters J1, J2, and J3, of UPGMA dendrogram. The other japonica varieties introduced from other countries were scattered on the PCoA plot, which indicated relative genetic diver-
sification among them. Nevertheless, the three aromatic varieties still were located nearby (Table 3; Figure 2). Both the PCoA plot and UPGMA dendrogram revealed approximately the same genetic relationship among these japonica varieties.
The indica varieties were grouped into two clusters by PCoA. All Taiwan indica varieties were grouped in one cluster, cluster E, and all varieties introduced from IRRI and the Philippines were grouped in cluster F (Table 3; Figure 2). Two varieties, 93-11 and Khosakau, were sepa­rated into a unique cluster by UPGMA with a similarity coefficient of 0.68 and dispersed in cluster F with some genetic distance by PCoA (Table 3; Figure 2).
Figure 2. Two-dimension plot of principal coordinate analysis for all 80 rice varieties in Taiwan. The first and second dimensions ex­plained 18.03% and 1.87%, respectively, of the genetic diversity.
LIN et al. ― Genetic diversity of rice-breeding germplasm in Taiwan
371
Genetic diversity and genetic differentiation within and between subgroups
DISCUSSION
Assessment of the polymorphic levels of SSR markers uncovered in this study
We divided the germplasm into several subgroups to evaluate genetic diversity by mean allele number per locus, major allele frequency, mean gene diversity, and mean PIC value, and genetic differentiation between two subgroups by FST (Table 4). The genetic diversity for the indica group, including all 28 varieties, was greater than that for the japonica group, of 52 varieties, as revealed by smaller major allele frequency and larger mean gene diver­sity and mean PIC value (Table 4). The same phenomenon was observed in comparing Taiwan indica and japonica groups, too. Taiwan indica varieties exhibited slightly less genetic diversity as compared with introduced indica va­rieties. In contrast, the mean gene diversity and mean PIC value were lower for Taiwan japonica varieties than the 28 introduced japonica varieties but did not differ from those of the 10 Japanese japonica varieties (Table 4). Thus, the genetic diversity of Taiwan and Japanese japonica culti-vars was narrow.
SSR markers have been commonly used in evaluat­ing genetic diversity and phylogenetic analysis because of their abundance in genomes and high allelic polymor­phism, co-dominance, and easy manipulation by PCR. Gel electrophoresis with agarose, polycrylamide, and capillary gel can be used to observe allelic variation of SSR markers caused by various repeat numbers of one type of SSR or SSR with at least two types of SSRs even with embedded single nucleotide polymorphism (SNP) and/or indels. We used 2.5% SFR agarose, which could resolve the DNA fragments with a difference of 5 bp, and revealed 395 alleles by using 119 markers with 80 rice varieties; the mean allele number per locus was 3.5 (Table 2, 4). The mean allele number we found was lower than that for SSRs labeled with fluorescence and separated by capillary gel electrophoresis, which is expensive (Jain et al., 2004; Thomson et al., 2007). One reason for the dif­ference may be the lower resolution in separating SSR al-leles in agarose gel than in capillary gel. As well, we used cultivars rather than landraces and wild relatives because of less allelic variation in cultivars in general (Ram et al., 2007; Thomson et al., 2007; Yuan et al., 2007; Pusadee et al., 2009). However, our result was comparable to the mean of 4.5 alleles per locus found in 35 Asian cultivars and 2.0-5.5 alleles per locus found with different kinds of
Overall, the differentiation between the indica groups and japonica groups was high, with FST values of 0.58 and 0.50 for all 80 varieties and 34 Taiwan varieties, re­spectively (Table 4). Genetic differentiation was moderate between Taiwan domestic varieties and introduced variet­ies for both indica and japonica groups, with FST values of 0.25 and 0.15, respectively. However, Taiwan and Japa­nese japonica varieties showed very low genetic differen­tiation (Fst =0.05, Table 4).
Table 4. Genetic diversity and differentiation within and between subgroups of 80 rice varieties.

Subgroups

Sample size

Mean no. alleles/locus

Major allele frequency

Mean gene diversity

Mean PIC value

Fst

All 80 varieties

80

3.50

0.61

0.50

0.43

0.58
indica
28
2.91
0.74
0.35
0.31
japonica
52
2.96
0.80
0.29
0.26
Taiwan varieties
34
2.72
0.70
0.41
0.35
0.50
indica
10
1.89
0.80
0.25
0.21
japonica
24
1.79
0.89
0.15
0.13
indica varieties
28
2.91
0.74
0.35
0.31
0.25
Taiwan
10
1.89
0.80
0.25
0.21
introduced
18
2.91
0.71
0.38
0.34
japonica varieties
52
2.96
0.80
0.29
0.26
0.15
Taiwan
24
1.79
0.89
0.15
0.13
introduced
28
2.82
0.75
0.35
0.31
japonica varieties
34
1.84
0.89
0.15
0.13
0.05
Taiwan
24
1.79
0.89
0.15
0.13
Japan
10
1.30
0.85
0.17
0.16

372
Botanical Studies, Vol. 53, 2012
microsatellites (Cho et al., 2000; Pervaiz et al., 2009).
ies (Table 3; Figures 1, 2). Overall, clustering analyses of these 80 rice germplasm used in Taiwan were consistent with the new classification of sub-groups of Asian rice, O. sativa.
PIC values, which could avoid the bias estimation with major alleles, are also a good indicator of the polymor­phic levels of molecular markers. The PIC values were high and varied, with a mean of 0.43 and range 0.04-0.76 (Table 2). The PIC values we estimated were comparable to those from previous studies of SSR markers used with rice cultivars (Lu et al., 2005; Pervaiz et al., 2009) but were lower than those with rice landraces (Thomson et al., 2007; Pervaiz et al., 2010).
According to the pedigree analysis of 99 Taiwan japon-ica varieties released between 1940 and 1987, 85% of the parentages of the varieties were introduced from Japan. Especially, Shinriki and Kameji, the two major parents of Taichung 65 which was the first reported photoperiod-in-sensitive temperate japonica variety, showed great genetic contribution to genomes, 21.3% and 16.7%, respectively (Lin, 1991a). As a consequence, 24 Taiwan and 10 Japa­nese varieties shared highly similar genetic background, which was supported by both UPGMA and PCoA (Table 3; Figures 1, 2). Since the prime rice-breeding goal of yield shifted to rice grain quality, several elite Japanese cultivars such as Koshihikari and Kinuhikari were introduced and are being extensively used in regular rice-breeding pro­grams. These cultivars, with good grain appearance and eating quality, were grouped in clusters J1 and J2 by UP-GMA or cluster A by PCoA (Tables 1, 3; Figures 1, 2).
Only 8 of 119 markers (6.72%), with PIC values < 0.25, were considered slightly informative; the other 111 mark­ers were reasonably to highly informative (Table 2). The 5 STS markers we used were reasonably and highly infor­mative, with PIC values 0.34 (E1113) to 0.59 (S12569), which could offer allelic variation for analysis of genetic diversity. Nevertheless, informative polymorphism was greater for SSRs than indels in general; for example, 4 SSRs revealed 7 alleles with PIC value up to 0.76 (Table 2). The allelic information for the 119 markers with the 80 varieties and the polymorphic markers between any 2 varieties can be accessed from the website for 'The Re-source of Rice Genetic Markers in Taiwan' (http://rice. sinica.edu.tw, Lin et al., 2008). The polymorphic markers we uncovered could be applied to genetic linkage analysis, quantitative trait locus (QTL) mapping, and marker as-sisted selection (MAS) to improve rice breeding efficiency. Moreover, some variety-specific alleles can be exploited in DNA fingerprinting to variety identification (Chuang et al., 2011).
All Taiwan indica varieties share a similar genetic background and formed one cluster and exhibited higher genetic distance than the newly introduced indica variet­ies (Table 3; Figures 1, 2). Many indica landraces, brought and cultivated by Chinese people when they migrated from Guangdong and Fujian provinces of mainland China about 300 years ago, might have been incorporated in early modern indica rice breeding. The indica varieties from the IRRI and the Philippines were closely related because of selection under similar environments for specific breeding aims. Nevertheless, the other indica varieties originating from other than the Philippines showed relative genetics distance as well.
Clusters of Taiwan rice-breeding germplasm based on genetic distance
We identified two major groups corresponding to ssp. japonica and indica by both cluster analyses, UPGMA and PCoA, on the basis of genetic distance of the Dice similar­ity coefficient among the 80 varieties used in rice breeding programs (Figures 1, 2). By the classification of Garris et al. (2005), the subspecies japonica could be distinguished as tropical japonica, temperate japonica, and aromatic groups, and ssp. indica could be distinguished as indica and aus groups. Because most popular rice varieties in Tai­wan were temperate japonica, the common japonica ger-mplasm used in breeding belonged to temperate japonica, except for Tung Lu 1, which is a domestic tropical japoni-ca and showed little similarity to the other japonica variet­ies and had some genetic distances to the other temperate japonica by UPGMA but still was grouped in cluster A by PCoA. We included only 3 Basmati varieties belonging to the aromatic group; therefore, they could not form a dis­tinct group and also exhibited genetic dissimilarity to the imported japonica varieties other than those introduced from Japan (Table 3; Figures 1, 2). The aus, closely related to indica, was considered to be ssp. indica and is habitu­ated along the Himalayan hills. Pokhareli introduced from India might contain the genetic background of aus, which displayed large genetic distance to the other indica variet-
Genetic diversity and differentiation among subgroups of germplasm for the 80 varieties
Japonica and indica rice are easy to distinguish by obvious distinct morphologic and physiologic charac­ters (Oka and Morishima, 1982). The F1 seeds of inter-subspecific crosses always exhibit low fertility and hybrid breakdown in successive selfed generations because of the accumulation of genetic differentiation; these two subspe­cies had undergone divergence and adaptation to various environments and domestication. The genetic divergence could also be detected by DNA sequences of nuclear DNA and chloroplast genes (Vitte et al., 2004; Londo et al., 2006). With our analysis of Fst, an index of divergent level between two subpopulations, the indica varieties greatly differentiated from japonica varieties. As compared with other studies of worldwide collections (Fst =0.43) and In­donesian germplasm (Fst =0.38) and landraces (Fst =0.59) (Garris et al., 2005; Thomson et al., 2007, 2009), we ob-served a certain degree of differentiation for all indica va-rieties vs. japonica varieties (Fst =0.58) herein (Table 4). Even different germplasm collections might account for the different outcomes; the high Fst value for cultivated
LIN et al. ― Genetic diversity of rice-breeding germplasm in Taiwan
373
indica and japonica varieties might be associated with strongly diversified selection for different breeding goals during breeding processes. Furthermore, this phenomenon was supported by the high differentiation in Taiwan indica and japonica cultivars (Fst =0.50; Table 4) under intensive selection for specific breeding goals, high yield for indica cultivars and grain quality for japonica cultivars.
netic bases of commercial cultivars. The genetic diversity of rice cultivars in Taiwan is very narrow, as determined by pedigree analysis or molecular marker assay, because of the high selection pressure for good grain quality and repeated use of a few germplasm in breeding programs. To broaden the gene pool of current cultivars, exotic elite cultivars were recently introduced from various countries besides Japan (Table 1). Those introduced cultivars pro­vide beneficial genes for Taiwan cultivars, such as those for biotic and abiotic resistance, aroma, and high yield (Table 1). The genomes of introduced exotic germplasm broadened the gene pool of Taiwan cultivars, as revealed by increased mean number alleles per locus, mean gene diversity, and mean PIC value, and lower major allele frequency (Table 4). Nevertheless, the genetic diversity of cultivars is greatly reduced during systematicly extensive selection for a few target traits. Enlarging the gene pool of current cultivars for new challenges of unknown biotic and abiotic stresses due to global warming is a crucial task in modern breeding programs. Investigating untapped natural diversity in landraces or wild relative rice, O. rufipogon and O. nivara, is ongoing (Thomson et al., 2007, 2009; Kovach and McCouch, 2008; Pusadee et al., 2009). Previ-ous assessment of genetic diversity of Taiwan landraces and cultivars of rice found landraces with greater variation in allele richness by SSR markers (Y.-R. Lin, Y.-P. Wu, and Su-Huang Chang, unpublished data). How to eliminate inferior alleles from landraces and wild relative rice while introgressing useful genes in cultivars is critical. Marker-assisted selection (MAS) for precise selection of favorable genotypes will accelerate current breeding and increase gene pyramiding in rice modern breeding.
Asian rice, O. sativa L., encountered a severe early domestication bottleneck, which led to narrower genetic diversity than its perennial ancestor, O. rufipogon, and an­nual ancestor, O. nivara (Kovach and McCouch, 2008). Because of different geographic distribution and selection, ssp. japonica rice experienced more severe bottleneck than ssp. indica rice did as indicated by bottleneck stringency K values (Zhu et al., 2007). The genetic diversity and gene richness was lower for japonica rice than indica rice col­lected from many countries and worldwide in general, as revealed by STS or SSR markers (Yang et al., 1994; Ni et al., 2002; Garris et al., 2005; Caicedo et al., 2007). From the major allele frequency and high mean gene diversity and mean PIC value in indica rice from all 28 varieties and 10 Taiwan varieties (Table 4), our results also reflected the evolutionary processes and agreed with previous findings. Furthermore, the genetic diversity was lower for Taiwan cultivars than introduced cultivars, not only indica but also japonica rice (Table 4), because of limited genetic bases.
In Taiwan, indica rice was the major staple food before the 21st century and is commonly used in making rice noo­dles, rice cake, and other derived products. The breeding goals for indica rice differ slightly from those for japonica rice: high yield and resistance to biotic and abiotic stress­es. Because yield and resistance are affected by many factors, the 10 Taiwan indica varieties became genetically diverse but could still maintain the considerable level as the varieties introduced from abroad, as indicated by the lower major allele frequency, mean gene diversity, and mean PIC value (Table 4). Furthermore, Taiwan domestic and introduced indica varieties showed moderate differen­tiation (Fst =0.25; Table 4).
Acknowledgements. This work was supported by in part grant from the National Science and Technology Program for Agricultural Biotechnology, Taiwan (Y.-I. C. Hsing). We also appreciate Yuan-Chen Huang and Chien-Hsin Chang for technical assistance.
The current Taiwan japonica cultivars have a very nar­row gene pool because of relatively little germplasm used in breeding programs and field uniformity (Lin, 1991a, b; Wu and Lin, 2008). The mean genetic diversity and PIC value were lower for Taiwan japonica than introduced japonica varieties and even lower than for introduced Jap­anese japonica varieties (Table 4). Taiwan and Japanese japonica varieties did not differ greatly in genetic diversity (Fst =0.05). In addition, clustering analyses based on ge­netic distances revealed Taiwan modern japonica cultivars highly related to introduced Japanese japonica cultivars, which was consistent with results by pedigree analysis (Lin, 1991a; Wu and Lin, 2008). The breeding goal has been grain quality for better selling price since 1980; the tradeoff has been a great reduction in genetic diversity of cultivated rice.
LITERATURE CITED
Botstein, D., R.L. White, M. Skolnick, and R.W. Davis. 1980.
Construction of a genetic linkage map in man using restric­tion fragment length polymorphisms. Am. J. Hum. Genet. 32: 314-331.
Brar, D.S. and G.S. Khush. 1997. Alien introgression in rice. Plant Mol. Biol. 35: 35-47.
Caicedo, A.L., S.H. Williamson, R.D. Hernandez, A. Boyko,
A. Fledel-Alon, T.L. York, N.R. Polato, K.M. Olsen, R. Nielsen, S.R. McCouch, C.D. Bustamante, and M.D. Purug-ganan. 2007. Genome-wide patterns of nucleotide polymor­phism in domesticated rice. PLoS Genet. 3: 1745-1756.
Chang, T.-T. 1985. Crop history and genetic conservation: rice -a case study. Iowa State J. Res. 59: 425-455.
Cho, Y.G., T. Ishii, S. Temnykh, X. Chen, L. Lipovich, S.R. McCouch, W.D. Park, N. Ayres, and S. Cartinhour. 2000.
The assessment of genetic diversity of germplasm is essential for breeding programs to characterize the ge-
374
Botanical Studies, Vol. 53, 2012
Diversity of microsatellites derived from genomic libraries and GeneBank sequences in rice (Oryza sativa L.). Theor. Appl. Genet. 100: 713-722.
Chou, S.-L. 1948. China is the place of origin of rice. J. Rice Soc. China 7: 53-54.
Chuang, H.-Y., H.-S. Lur, K.-K. Hwu, and M.-C. Chang. 2011.
Authentication of domestic Taiwan rice varieties based on fingerprinting analysis of microsatellite DNA markers. Bot.
Stud. 52: 393-405.
Dice, L.R. 1945. Measures of the amount of ecologic association between species. Ecology 26: 297-302
FAO, Food and Agriculture Organization. 2009. The State of the World's Plant Genetic Resources for Food and Agriculture.
Garris, A.J., T.H. Tai, J. Coburn, S. Kresovich, and S.R. Mc-
Couch. 2005. Genetic structure and diversity in Oryza sa-
tiva L. Genetics 169: 1631-1638.
Goodman, M.M. and C.W. Stuber. 1983. Races of maize. 6: Isozyme variation among races of maize in Bolivia. May-dica 28: 169-187.
Gower, J.C. 1966. Some distance properties of latent root and vector methods used in multivariate analysis. Biometrika
53: 325-338.
Inoue, T., H.S. Zhong, A. Miyao, I. Ashikawa, L. Monna, S. Fukuoka, N. Miyadera, Y. Nagamura, N. Kurata, T. Sasaki, and Y. Minobe. 1994. Sequence-tagged sites (STSs) as stan­dard landmarkers in the rice genome. Theor. Appl. Genet. 89: 728-734.
IRGSP, International Rice Genome Sequencing Project. 2005. The map-based sequence of the rice genome. Nature 436:
793-800.
Jackson, M.T. 1997. Conservation of rice genetic resources: the role of the International Rice Genebank at IRRI. Plant Mol.
Biol. 35: 61-67.
Jain, S., R.K. Jain, and S.R. McCouch. 2004. Genetic analysis of Indian aromatic and quality rice (Oryza sativa L.) germ-plasm using panels of fluorescently-labeled microsatellite
markers. Theor. Appl. Genet. 109: 965-977.
Khush, G.S. 1997. Origin, dispersal, cultivation and variation of
rice. Plant Mol. Biol. 35: 25-34.
Kovach, M.J. and S.R. McCouch. 2008. Leveraging natural di­versity: back through the bottleneck. Curr. Opin. Plant Biol. 11: 193-200.
Lin, M.S. 1991a. Genetic base of japonica rice varieties released in Taiwan. Euphytica 56: 43-46.
Lin, M.S. 1991b. Field uniformity of the japonica rice region of Taiwan as estimated by relative genetic contribution. Theor.
Appl. Genet. 83: 115-118.
Lin, Y.-R., S.-C. Wu, S.-E. Chen, T.-H. Tseng, C.-S. Chen, S.-C. Kuo, H.-P. Wu, and Y.-I. C. Hsing. 2011. Mapping of
quantitative trait loci for plant height and heading date in two inter-subspecific crosses of rice and comparison across Oryza genus. Bot. Stud. 52: 1-14.
Lin, Y.-R., Y.-P. Wu, F.-J. Wei, P.-C. Lu, Y.-C. Huang, C.-H. Chang, A.-L. Hour, S.-C. Kou, J.-S. Hsieh, and Y.-I. C.
Hsing. 2008. Construction of the website 'The Resource of Rice Genetic Markers in Taiwan'. Crop, Environment & Bioinformatics 5: 1-21. (Chinese with English abstract)
Liu, K. and S.V. Muse. 2005. PowerMarker: an intergrated anal­ysis environment for genetic marker analysis. Bioinformat-
ics 21: 2128-2129. Londo, J.P., Y.-C. Chiang, K.-H. Hung, T.-Y. Chiang, and B.A.
Schaal. 2006. Phylogeography of Asian wild rice, Oryza rufipogon, reveals multiple independent domestications of cultivated rice, Oryza sativa. Proc. Natl. Acad. Sci. USA
103: 9578-83.
Lu, H., M.A. Redus, J.R. Coburn, J.N. Rutger, S.R. McCouch,
and T.H. Tai. 2005. Population structure and breeding pat­terns of 145 U.S. rice cultivars based on SSR marker analy­sis. Crop Sci. 45: 66-76.
Ma, J. and J.L. Bennetzen. 2004. Rapid recent growth and diver­gence of rice nuclear genomes. Proc. Natl. Acad. Sci. USA 101: 12404-12410.
McCouch, S.R. 2004. Diversifying selection in plant breeding.
PLoS Biol. 2: e347.
Ni, J., P.M. Colowit, and D.J. Mackill. 2002. Evaluation of ge­netic diversity in rice subspecies using microsatellite mark­ers. Crop Sci. 42: 601-607
Oka, H. 1974. Experimental studies on the origin of cultivated
rice. Genetics 78: 475-486.
Oka, H. and H. Morishima. 1982. Phylogenetic differentiation of cultivated rice, potentiality of wild progenitors to evolve the indica and japonica types of rice cultivars. Euphytica 31:
41-50.
Pervaiz, Z.H., M.A. Rabbani, I. Khaliq, S.R. Pearce, and S.A. Malik. 2010. Genetic diversity associated with agronomic traits using microsatellite markers in Pakistani rice landrac-es. Electron. J. Biotech. 13: 1-12.
Pervaiz, Z.H., M.A. Rabbani, S.R. Pearce, and S.A. Malik. 2009. Determination of genetic variability of Asian rice (Oryza sativa L.) varieties using microsatellite markers. Afr. J. Bio­tech. 8: 5641-5651.
Pusadee, T., S. Jamjod, Y-C. Chiang, B. Rerkasem, and B.A. Schaal. 2009. Genetic structure and isolation by distance in a landrace of Thai rice. Proc. Natl. Acad. Sci. USA 106:
13880-13885.
Ram, S.G., V. Thiruvengadam, and K.K. Vinod. 2007. Genetic diversity among cultivars, landraces and wild relatives of rice as revealed by microsatellite markers. J. Appl. Genet.
48: 337-345.
Rohlf, F.J. 2005. NTSYS-pc: Numerical Taxonomy and Multi-
variate Analysis System, version 2.2, Exeter Software, Ap­plied Biostatistics, Inc., New York, USA.
Shi, X., J. Wang, Y. Bao, P. Li, L. Xie, J. Huang, and H. Zhang.
2010. Identification of the quantitative trait loci in japonica rice landrace Heikezijing responsible for broad-spectrum resistance to rice blast. Phytopathology 100: 822-829.
Thomson, M.J., E.M. Septiningsih, F. Suwardjo, T.J. Santoso,
T.S. Silitonga, and S.R. McCouch. 2007. Genetic diversity
LIN et al. ― Genetic diversity of rice-breeding germplasm in Taiwan
375
analysis of traditional and improved Indonesian rice (Oryza sativa L.) germplasm using microsatellite markers. Theor.
Appl. Genet. 114: 559-568.
Thomson, M.J., N.R. Polato, J. Prasetiyono, K.R. Trijatmiko,
T.S. Silitonga, and S.R. McCouch. 2009. Genetic diversity
of isolated populations of Indonesian landraces of rice (Oryza sativa L.) collected in East Kalimantan on the island
of Borneo. Rice 2: 80-92. Vitte, C., T. Ishii, F. Lamy, D. Brar, and O. Panaud. 2004. Ge-
nomic paleontology provides evidence for two distinct ori­gins of Asian rice (Oryza sativa L.). Mol. Genet. Genomics
272: 504-511.
Wu, W.-C. and M.-S. Lin. 2008. Pedigree analysis of rice variet­ies of Taiwan: I. Relationships among Japanese introduc­tions. Crop, Environment & Bioinformatics 5: 248-257. (Chinese with English abstract)
Wu, Y.-P., P.-Y. Ko, W.-C. Lee, F.-J. Wei, S.-C. Kuo, S.-W. Ho, A.-L. Hour, Y.-I. C. Hsing, and Y.-R. Lin. 2010. Compara­tive analyses of linkage maps and segregation distortion of two F2 populations derived from japonica crossed with indica rice. Hereditas 147: 225-236.
Yang, G.P., M.A.S. Maroof, C.G. Xu, Q. Zhang, and R.M. Bi-
yashev. 1994. Comparative analysis of microsatellite DNA polymorphism in landraces and cultivars of rice. Mol. Gen.
Genet. 245: 187-194 Yu, J., S. Hu, J. Wang, G.K. Wong, S. Li, B. Liu, Y. Deng, L.
Dai, Y. Zhou, X. Zhang, M. Cao, J. Liu, J. Sun, J. Tang, Y.
Chen, X. Huang, W. Lin, C. Ye, W. Tong, L. Cong, J. Geng, Y. Han, L. Li, W. Li, G. Hu, X. Huang, W. Li, J. Li, Z. Liu, L. Li, J. Liu, Q. Qi, J. Liu, L. Li, T. Li, X. Wang, H. Lu, T. Wu, M. Zhu, P. Ni, H. Han, W. Dong, X. Ren, X. Feng, P. Cui, X. Li, H. Wang, X. Xu, W. Zhai, Z. Xu, J. Zhang, S. He, J. Zhang, J. Xu, K. Zhang, X. Zheng, J. Dong, W. Zeng, L. Tao, J. Ye, J. Tan, X. Ren, X. Chen, J. He, D. Liu, W. Tian, C. Tian, H. Xia, Q. Bao, G. Li, H. Gao, T. Cao, J. Wang, W. Zhao, P. Li, W. Chen, X. Wang, Y. Zhang, J. Hu, J. Wang, S. Liu, J. Yang, G. Zhang, Y. Xiong, Z. Li, L. Mao, C. Zhou, Z. Zhu, R. Chen, B. Hao, W. Zheng, S. Chen, W.
Guo, G. Li, S. Liu, M. Tao, J. Wang, L. Zhu, L. Yuan, and H. Yang. 2002. A draft sequence of the rice genome (Oryza sativa L. ssp. indica). Science 296: 79-92.
Yuan, X.P., X.H. Wei, L. Hua, H.Y. Yu, Y.P. Wang, Q. Xu, and
S.X. Tang. 2007. A comparative study of SSR diversity in Chinese major rice varieties planted in 1950s and in the re­cent ten years (1995-2004). Rice Sci. 14: 78-84.
Zhang, H., J. Sun, M. Wang, D. Liao, Y. Zeng, S. Shen, P. Yu, P.
Mu, X. Wang, and Z. Li. 2007. Genetic structure and phylo-geography of rice landraces in Yunnan, China, revealed by
SSR. Genome 50: 72-83. Zhu, Q., X. Zheng, J. Luo, B.S. Gaut, and S. Ge. 2007. Multilo-
cus analysis of nucleotide variation of Oryza sativa and its wild relatives: severe bottleneck during domestication of
rice. Mol. Biol. Evol. 24: 875-888.
376
Botanical Studies, Vol. 53, 2012
臺灣水稻育種種源之遗傳歧異度
林鎵穎1 吳永培2 侯藹玲3 何勝偉1 魏甫錦1,4邢禹依1,4 林彥蓉1
1國立臺灣大學農藝學系
2行政院農業委員會農業試驗所嘉義分所
3天主教輔仁大學生命科學系
4中央研究院植物暨微生物學研究所
水稻是世界最重要的禾穀類作物之一,在臺灣更是主要的栽培作物,因此水稻種原遺傳歧異度
的評估,對於種原之保存及育種上之利用均扮演著重要的角色,故利用114個簡單序列重複分子標
(simple sequence repeat, SSR)5個序列標籤位點 (sequence tagged site, STS) 分子標幟,針對52
梗稻和28個秈稻等80個栽培稻於臺灣育種過程常用之種原進行探討遺傳結構。總共偵測出395
對偶基因,每個分子標幟可偵測27個對偶基因,平均為3.5個;而每個分子標幟之多型性訊息量
(polymorphism information content PIC)介於0.04-0.76 ,平均為0.43 。以遺傳距離為導向之不加權平均
重法 (UPGMA)及主座標分析法 (PCoA)探討80個水稻品種之結構,可將梗稻及秈稻明顯區分在不同群
集,其中臺灣及日本之梗稻分布於相同的群集中,顯示具有高度相似的遺傳背景。秈稻品種之遺傳歧異
度大於梗稻而臺灣栽培稻之遺傳歧異度相對較小,尤其是臺灣梗稻,但國外引進之栽培稻種原則呈
現較豐富遺傳變異。檢視遺傳分化指數 (genetic differentiation index, Fst)分析,發現國內外之秈稻和梗
稻的分化指數僅屬於中等0.15(分別為0.250.15),而由臺灣及日本來源之梗稻間之遺傳分化指數相當小
(Fst =0.05),顯示兩地區來源之水稻梗稻品種未呈現明顯分化,另從日本以外之地區引進臺灣之種原會
有現較大的分化指數,顯示其有擴大臺灣栽培稻基因池之效益。由DNA分子標幟多型性的分析解析了
臺灣水稻種原在基因體上之關係,更建立了臺灣栽培稻之遺傳標幟資料庫,可供未來在不同品種鑑別、
種原保存和育種上進行相關利用。
關鍵詞:遺傳歧異水稻簡單序列重複分子標幟臺灣栽培稻。