|
|||||
Botanical Studies (2010) 51: 89-97
|
ECOLOGY
|
|
|||
|
|||||
|
|||||
Altitudinal distribution patterns of plant species in Taiwan are mainly determined by the northeast monsoon rather than the heat retention mechanism of Massenerhebung
Chyi-Rong CHIOU1, Guo-Zhang Michael SONG1,9,*, Jui-Han CHIEN1, Chang-Fu HSIEH2, Jenn-Che WANG3, Ming-Yih CHEN4, Ho-Yih LIU5, Ching-Long YEH6, Yue-Joe HSIA7, and Tze-Ying CHEN8
|
|||||
|
|||||
1School of Forestry and Resource Conservation, National Taiwan University, Taipei 10617, Taiwan
2Institute of Ecology and Evolutionary Biology, National Taiwan University, Taipei 10617, Taiwan 3Department of Life Science, National Taiwan Normal University, Taipei 10610, Taiwan 4Department of Life Science, National Chung Hsing Unversity, Taichung 40227, Taiwan 5Department of Biological Science, National Sun Yat-sen University, Kaohsiung 80424, Taiwan 6Department of Forestry, National Pingtung University of Science and Technology, Pingtung 91207, Taiwan 7Institute of Natural Resources, National Dong Hwa University, Hualien 94701, Taiwan 8Department of Natural Resources, National Ilan Unversity, Yilan County 26047, Taiwan 9Present address: Institute of Ecology and Evolutionary Biology, National Taiwan University, Taipei 10617, Taiwan |
|||||
|
|||||
(Received October 29, 2008; Accepted July 22, 2009)
ABSTRACT. The objectives of this study are to revisit altitudinal distribution patterns for plant species in the main sections (where the ridges are higher than 2,000 m above sea level) of the Central Mountain Range (CMR) in Taiwan and identify the most influential environmental factor resulting in these patterns. Three east-west oriented sampling belts at regular latitudinal intervals were laid out in the main sections of the CMR. Each belt was further divided into two regions according to the aspect (the east-facing and west-facing aspects). The data of species altitudinal distribution for the six regions were extracted from a dataset of a national vegetation mapping project. On the north and central sampling belts species altitudinal distribution is markedly lower on the east-facing aspect than on the west-facing aspect, whereas on the south belt species altitudinal distribution between the two aspects does not differ significantly. There is an increasing tendency of species altitudinal distribution with the decrease of latitude on the east-facing aspect of the CMR. In contrast, the tendency is barely noticeable on the west-facing aspect. The distinct distribution patterns between the two aspects can be better explained by climatic heterogeneity created by the interaction between the winter northeast monsoon and the topographic effect of the CMR than by the heat retention mechanism of Massenerhebung. The previously-proposed distribution pattern that claimed that species altitudinal distribution descends gradually towards the north and south ends of Taiwan should be revised. On the east-facing aspect of the main sections of the CMR, species altitudinal distribution rises as latitude decreases. On the west-facing aspect, such tendency is not evident.
Keywords: Altitudinal distribution; Central Mountain Range; Latitude gradient; Monsoon; Massenerhebung; Taiwan.
Abbreviations: a.s.l., above sea level; CMR, Central Mountain Range.
|
|||||
|
|||||
INTRODUCTION
Taiwan is a mountainous island with an altitudinal range as great as nearly 4,000 m. The Central Mountain
Corresponding author. E-mail: mikesong@ntu.edu.tw; Tel: +866-2-3366-2474; Fax: +866-2-2366-1444.
|
Range (CMR), stretching from the north to south tips of Taiwan, covers two-third of the island (Figure 1A). It has been repeatedly reported that the altitudinal distribution of identical plant species or similar vegetations varies from location to location on the CMR (e.g. Su, 1984b). At the north and south ends of the CMR, where the ridges are lower than 2,000 m above sea level (a.s.l.) (Figure 1A),
|
||||
|
|||||
|
|||
90
|
Botanical Studies, Vol. 51, 2010
|
||
|
|||
the marked descent of species and vegetation distribution in altitude has been documented (e.g. Hsieh et al., 1996; Lin et al., 2007). In the CMR main sections, where the ridges are higher than 2,000 m a.s.l. (Figure 1A), some ecologists have inferred that identical plant species or similar vegetations distribute highest in the central section and descend towards the both ends of the CMR (e.g. Su, 1984b). However, this is still open to question because the inference is made based on species distribution data collected from a small number of mountains on the west-
facing aspect of the CMR (e.g. Su, 1984b). The pattern
of species altitudinal distribution in Taiwan has to be re-examined based on data with relatively widely-distributed sampling plots.
Two mechanisms have been proposed to explain the altitudinal distribution patterns in Taiwan, including the heat retention mechanism of Massenerhebung (e.g. Su, 1984a, 1984b) and effects of monsoon (e.g. Hsieh et al., 1996). According to the heat retention mechanism, at a given altitude, temperature is lower on small mountains than on large mountains because smaller mountain mass tends to keep less heat from solar radiation (e.g. Holtmeier, 2003). Mountains are less massive and shorter at the north and south ends than in the main sections of the CMR (Figure 1). Consequently, the descent of vegetation altitudinal distribution at the two ends has been attributed to this mechanism because of relatively small mountain mass there (e.g. Su, 1984a, 1984b). It has been documented that effects of the winter northeast monsoon on species
|
distribution are pronounced (Sun et al., 1998). The winter northeast monsoon can markedly reduce local temperature by means of bringing in cold air, increasing cloudiness and wind chilling. Due to the topographic effects of the CMR, the winter northeast monsoon exerts more influences on local climate at the two ends than in the main sections of the CMR (Gallus, 2000). As a result, some ecologists attributed the descent of species distribution at the ends of the CMR to the effects of the winter northeast monsoon (e.g. Hsieh et al., 1996). Nevertheless, these hypotheses remain unexamined due to the lack of proper ground-based species distribution data.
The aims of the present study are to: 1) identify the altitudinal distribution patterns for plant species in the main sections of the CMR; and 2) recognize the most influential environmental factor in species altitudinal distribution.
MATERIALS AND METHODS
Study area
Taiwan Island (21¡C55'-25¡C20, N, 119¡C30'-122¡C00, E) is located at the western edge of the Pacific Ocean, 150 km to the southeast of the Mainland China and 300 km north of the Philippines. Total area of the island with length of 394 km and width of 140 km is 35,800 km2. The altitude ranges from 0 to 3,952 m. The CMR stretching from the north to the south tips of Taiwan (Figure 1) has over 300 summits higher than 3,000 m altitude.
|
||
|
|||
|
|||
|
|||
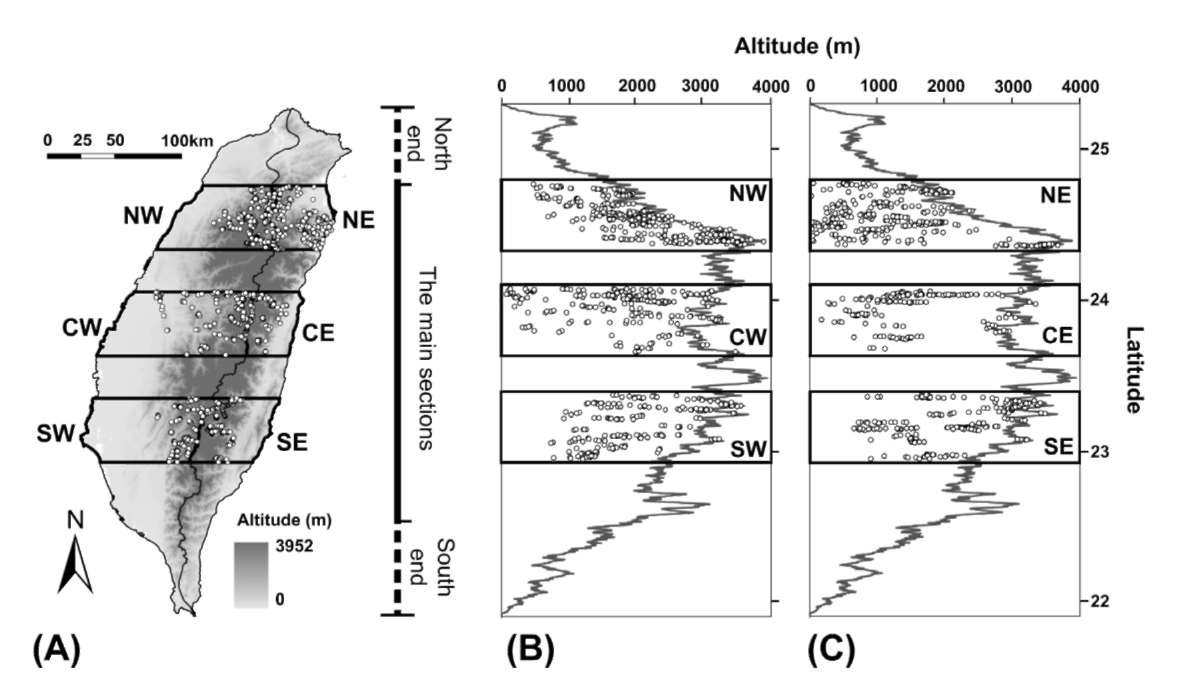
Figure 1. Map of Taiwan, showing the six sampling regions and the distribution of the sampling plots (open dots). (A) the horizontal distribution of the sampling plots; the altitudinal and latitudinal distribution of the sampling plots in the sampling regions (B) on the west-facing aspect and (C) on the east-facing aspect of the Central Mountain Range (CMR). The CMR stretches from the north to the south of Taiwan Island. The winding black solid line in Panel (A) indicates the main ridges of the CMR. The zigzag lines in Panels (B) and (C) indicates the altitude of the main ridges of the CMR along latitude. We only sample regions with at least one summit higher 3,000 m.
|
|||
|
|||
|
|||||||||||||||||||||||||||||||||||||||||||||||||||||||||||
CHIOU et al. ¡X Plant species altitudinal distribution in Taiwan 91
|
|||||||||||||||||||||||||||||||||||||||||||||||||||||||||||
|
|||||||||||||||||||||||||||||||||||||||||||||||||||||||||||
Table 1. General information for the six sampling regions and the mean upper limits of the 76 common species in these six regions.
|
|||||||||||||||||||||||||||||||||||||||||||||||||||||||||||
|
|||||||||||||||||||||||||||||||||||||||||||||||||||||||||||
Altitudinal distribution range of plots Mean upper limits Sample region Latitude range of sampling region Number of plots (m) (m)
|
|||||||||||||||||||||||||||||||||||||||||||||||||||||||||||
|
|||||||||||||||||||||||||||||||||||||||||||||||||||||||||||
|
|||||||||||||||||||||||||||||||||||||||||||||||||||||||||||
|
|||||||||||||||||||||||||||||||||||||||||||||||||||||||||||
T he c l i mate of Taiwan i s ma i nl y governed by the summer southwest monsoon and the winter northeast monsoon (e.g. Su, 1984a; Yen and Chen, 2000). Nevertheless, the winter northeast monsoon is more influential on species altitudinal distribution than the summer southwest monsoon in terms of the prevailing duration and the effects on temperature. The winter monsoon prevails as long as 6 months per year whereas the prevailing duration of the summer monsoon is no longer than 3 months (Wang, 2004). The wind speed of the winter monsoon is higher than that of the summer monsoon (Yen and Chen, 2000). The main effects of the summer monsoon are associated with precipitation. In contrast, in addition to precipitation, the effects of the winter monsoon are associated with coldness and cloudiness (e.g. Yen and Chen, 2000; Chen et al., 2002).
Data processing and analysis
Three east-west oriented sampling belts were laid out at regular latitudinal intervals in the main sections of the CMR. The breadth between the two edges of every sampling belt was 0.428¡C. To reduce the undesired effects of spatial autocorrelation, the intervals between the three belts were kept as great as possible. The intervals between these sampling belts were 0.283¡C. Each belt was further divided into two regions according to the aspect (the east-facing and west-facing aspects). These sampling regions were named according to their relative latitudinal relationship and the aspect they are on, i.e. NW, CW, SW, NE, CE and SE (Figure 1A). For example, the sampling region on the west-facing aspect of the north sampling belt was named as Region NW. The dataset of The National Vegetation Diversity Inventory and Mapping Project that contains floristic data for more than 3,000 20 m x 20 m study plots around Taiwan was used (Chiou et al., 2009). The plots of the dataset located in the six sampling regions were sampled for our analyses (Figure 1, Table 1).
Upper limits of species were used as a measure for species altitudinal distribution in the present study. Most of lowland areas in Taiwan have been turned into agricultural lands. Under this circumstance, lower limits and midpoints of species altitudinal distribution tend to be biased. In our
|
dataset, the number of plots along the altitudinal gradient varied considerably. Midpoints of species altitudinal distribution are likely to be biased by the uneven number of plots along the altitudinal gradient. To reduce bias associated with destruction of lowland natural habitats and uneven sample sizes along the altitudinal gradient, we used the upper limits of species to identify the patterns of species altitudinal distribution.
Only species found in all of the six sampling regions (hereafter common species) were used in our analyses. To assure that the upper limits of common species were not biased by low frequency of occurrence, common species which occurred in fewer than five plots in any of the six sampling regions were excluded from our analyses.
Upper limits of species altitudinal distribution are determined by physiological constraints of the species as well as geometric constraints of habitats (i.e. the height of mountains, the highest altitude of data sampling). The altitude of the highest sampling plots in the six regions is different (Table 1). Under this circumstance, upper limits of species which can survive at high altitudes may be the result of geometric constraint rather than the result of interactions between their physiological limits and environmental stress. To eliminate the undesired effects of geometrical constraint, species with upper limits higher than 3,000 m were excluded from our analyses. After all of these data processing procedures, 76 species were used in our analyses (Appendix 1).
In addition to examining species altitudinal distribution of the 76 common species in groups, we also examined the altitudinal distribution for each single species. There were six altitudinal distribution patterns along the latitudinal gradient on the same aspects of the CMR, i.e. increasing altitudinal distribution with latitude. For ease of expression and quantitative comparison, these six altitudinal distribution patterns were named with a system of three-digit codes. The first digit was assigned to indicate the altitudinal distribution of a species in the north section of the CMR main sections and the second and the third digits represented the altitudinal distribution of the same species in the central and south sections respectively. The values from one to three were used to represent quantitative differences of species altitudinal distribution amongst the
|
||||||||||||||||||||||||||||||||||||||||||||||||||||||||||
|
|||||||||||||||||||||||||||||||||||||||||||||||||||||||||||
|
|||
92
|
Botanical Studies, Vol. 51, 2010
|
||
|
|||
three sections. The value "3" was assigned to the section with the highest upper limit of a species, and the value "1" was assigned to the section with the lowest upper limit of that species. For example, the code "1-3-2" means that a species whose upper limit was highest in the central section and lowest in the north section.
To avoid undesirable problems associated with the violation of the normal distribution requirement of parametric statistical tests, a nonparametric multiple comparison method, the Behrens-Fisher test (Munzel and Hothorn, 2001), was used to detect significant differences of species altitudinal distribution among these six regions
|
(Figure 2). We applied second order polynomial regression to assess the general tendency of the upper limits of 76 common species along the latitudinal gradient on the same aspect (Figure 3). The chi-square goodness-of-fit test was use to test if the proportion distribution of the six altitudinal distribution patterns for every single species was even (Figure 4).
RESULTS
In the north and central sampling belts on the CMR species altitudinal distribution is markedly lower on the east-facing aspect than on the west-facing aspect (Region NE vs. Region NW; Region CE vs. Region CW), whereas on the south sampling belt (Region SE vs. Region SW) the difference of species altitudinal distribution between the two aspects is not significant (Figure 2). Examining species altitudinal distribution on the same aspects, there is a noticeable increasing tendency of species altitudinal distribution with the decrease of latitude on the east-facing aspect of the CMR (Figure 3). In contrast, the difference of species altitudinal distribution along the latitude is insignificant and barely noticeable (Figures 2, 3).
The analysis for the altitudinal distribution patterns along the latitudinal gradient for each of the 76 common species shows consistent results with those in Figure 3. Up to 56.6% of species (43 species) on the east-facing aspect of the CMR exhibits the 1-2-3 distribution pattern (Figure 4B). The Chi-square test indicates that the distribution of the proportions of the six patterns is highly uneven (p < 10-18). In contrast, the distribution of the proportions of the six distribution patterns is just marginally uneven on the west-facing aspect (0.05 < p < 0.01) (Figure 4A). The increasing tendency of the altitude of species distribution from north to south was more noticeable on the east-facing aspect than on the west-facing aspect.
|
||
|
|||
NW CW SW NE CE SE
Sampling regions
Figure 2. Comparisons of the upper limits of the 76 species found in all six sampling regions. Significant of difference is indicated by different letters above boxes (p < 0.01). The Behrens-Fisher test shows that species distribute significantly lower in Regions NE and CE than the other four regions and species altitudinal distribution of the other four regions does not differ significantly.
|
|||
|
|||
|
|||
|
|||
Figure 3. Tendencies of the upper limits of 76 common species along the latitude gradient (A) on the west-facing aspect (Y= -9923.95+1078.27X- 23.91X2, R2= 0.0083) and (B) on the east-facing aspect (Y=105934.16-8446.81X+ 171.19X2, R2=0.1395) of the CMR. Species are distributed higher as latitude decreases on the east-facing aspect, but the tendency is barely noticeable on the west-facing aspect.
|
|||
|
|||
|
|||
CHIOU et al. ¡X Plant species altitudinal distribution in Taiwan
|
93
|
||
|
|||
|
|||
|
|||
Figure 4. Altitudinal distribution patterns along the latitudinal gradient for single species (A) on the west-facing aspect and (B) on the east-facing aspect of the CMR. There is a considerably large proportion of the 76 common species exhibiting the 1-2-3 distribution pattern (the increasing tendency of altitudinal distribution with the decease of latitude) on the east-facing aspect. The proportion distribution in the six patterns is relatively even on the west-facing aspect.
|
|||
|
|||
DISCUSSION
For decades it has been widely accepted by Taiwanese ecologists that altitudinal distribution of species and vegetation was highest in the central section of the CMR and descended gradually towards the both ends of the CMR (e.g. Su, 1984b). However, the previously proposed pattern is not entirely correct according to our results. The present study shows that, in the main sections of the CMR (where the ridges are over 2,000 m), species altitudinal distribution increases as latitude decreases on the east-facing aspect and the increasing tendency is not evident on the west-facing aspect (Figure 3). The incorrect previously-proposed pattern might be attributed to the lack of widely-sampled species distribution data and the method of inference. Due to the facts of marked descent of species altitudinal distribution at the north and south ends of the CMR (e.g. Hsieh et al., 1996; Lin et al., 2007) and the lack of systematic sampling for the main sections of the CMR, it is likely that the previously-proposed pattern was inferred in that way by means of interpolation (e.g.
Su, 1984b).
Heat retention of Massenerhebung is not the mechanism which can best explain the patterns of species altitudinal distribution in Taiwan. Altitudinal limits of species and vegetation are higher on taller, more massive mountains than on smaller mountains. This phenomenon is known as Massenerhebung (e.g. Flenley, 2007). The mechanisms involved in Massenerhebung include heat retention (e.g. Holtmeier, 2003), ultraviolet insolation (e.g. Flenley, 2007), soil condition (e.g. Grubb, 1971; Bruijnzeel et al., 1993), wind sheltering (e.g. Richards, 1952; Holtmeier, 2003), and cloud cover (e.g. Grubb, 1977). The mechanism of heat retention has been considered as the contributory factor for the pattern of species altitudinal distribution in Taiwan (e.g. Su, 1984b). It used to be considered that species altitudinal distribution were highest in the central section of the CMR and descended gradually towards both
|
the north and south ends of the CMR (e.g. Su, 1984b).
Coincidentally, in terms of mountain height, the mountain mass of the CMR decreases towards its both ends (Figure 1). Because large mountains keep more heat than do small mountains, it is fairly reasonable to assume that heat retention is the contributory mechanism for the previously-proposed distribution pattern. However, this mechanism can not explain the distinct distribution patterns between the west-facing and east-facing aspects of the CMR (Figures 2, 3, 4).
The distinct patterns of species altitudinal distribution between the two aspects of the CMR (Figures 2, 3, 4) should be attributed to climatic heterogeneity resulting from the interaction between the winter northeast monsoon and the topographic effect of the CMR. It has been reported that prevailing winds create a colder climate on the windward slopes by means of increasing lapse rates or prolonging snow cover (Richards, 1996; Gansert, 2004). The impacts of the winter northeast monsoon on Taiwan are marked with a sharp drop of surface temperature, an increase of winter precipitation and a steep rise of northerly or northeasterly surface wind speed (e.g. Yeh
and Chen, 1998; Chen et al., 2002). The extent of these
impacts is stronger on the windward side (the east-facing aspect) than on the leeward side of the CMR (the west-facing aspect) (Chen et al., 2002). This contributes to a lower species altitudinal distribution on the east-facing aspect than on the west-facing aspect in the north and central of the CMR main sections (Figure 2). Although all of the east-facing aspect of the CMR is exposed to the winter northeast monsoon, the extent of the influences of the winter northeast monsoon on local climate is not even but decreases from north to south (e.g. Yen and Chen, 2000). That is, in a given altitude, temperature is lowest in the north and highest in the south of the CMR main sections. This contributes to the increasing species altitudinal distribution with the decrease of latitude on the east-facing aspect of the CMR (Figures 3, 4). The flow
|
||
|
|||
|
|||
94
|
Botanical Studies, Vol. 51, 2010
|
||
|
|||
of the winter northeast monsoon is split into two by the CMR when it advances across Taiwan (Chen et al., 2002; Chien and Kuo, 2006). Although the west part of the split flows sweeps through northwestern Taiwan and west-central Taiwan (Chien and Kuo, 2006), the influences of the monsoon are weaker in inland areas than on coasts and theses influences can hardly reach areas at high altitudes (Chen et al., 2002). Compared with the east-facing aspect of the CMR, the extent of the influences of the winter monsoon is lower on the west-facing aspect. As a result, species altitudinal distribution on the west-facing aspect is barely noticeable (Figures 2 and 3).
T he marked descent of the species altitudinal distribution at the north and south ends of the CMR (outside of our sampling areas) (e.g. Hsieh et al., 1996; Lin et al., 2007) should also be attributed to climatic heterogeneity as a result of the interaction between the winter monsoon and the topographic effect of the CMR. A simulation has shown that the flow of the winter monsoon was accelerated around the north and south ends of Taiwan
due to the topographic effect of the CMR (Gallus, 2000).
Ground-based records also showed a similar pattern, which indicated that influences of the winter monsoon were stronger at the two ends of the CMR than in most areas of the CMR main sections (Yen and Chen, 2000). Due to the pronounced modification effects of the CMR on divergence and convergence of atmosphere circulation (e.g. Trier et al., 1990; Wang et al., 2005; Lu et al., 2007), the winter northeast monsoon exerts more effects on the climate at the north and south ends of the CMR than that of the CMR main sections (e.g. Gallus, 2000). Consequently, the altitudinal descent of species and vegetation at the ends of the CMR is the result of the interaction between the winter northeast monsoon and the topography of the CMR. In summary, these altitudinal distribution patterns in Taiwan should be attributed to climatic heterogeneity created by the winter northeast monsoon and the CMR.
Acknowledgements. We thank Dr. Kuo-Jung Chao who provides valuable comments on the manuscript.
LITERATURE CITED
Bruijnzeel, L.A., M.J. Waterloo, J. Proctor, A.T. Kuiters and B. Kotterink. 1993. Hydrological observations in montane rainforests on Gunung Silam, Sabah, Malaysia, with special reference to the Massenerhebung effect. J. Ecol. 81:
145-167.
Chen, T.C., M.C. Yen, W.R. Huang, and W.A. Gallus. 2002. An East Asian cold surge: Case study. Mon. Wea. Rev. 130:
2271-2290.
Chien, F.C. and Y.H. Kuo. 2006. Topographic effects on a wintertime cold front in Taiwan. Mon. Wea. Rev. 134:
3297-3316.
Chiou, C.R., C.F. Hsieh, J.C. Wang, M.Y. Chen, H.Y. Liu, C.L. Yeh, S.Z. Yang, T.Y. Chen, Y.J. Hsia, and G.Z.M. Song.
|
2009. The first national vegetation inventory in Taiwan. Taiwan J. Forest Sci. 24: 295-302.
Flenley, J.R. 2007. Ultraviolet insolation and the tropical rainforest: altitudinal variations, Quaternary and recent change, extinctions, and biodiversity. In M.B. Bush and J.R. Flenley (eds.), Tropical Rainforest Responses to Climatic Change, Springer, Berlin, pp. 219-235.
Gallus, W.A. 2000. The impact of step orography on flow in the Eta Model: Two contrasting examples. Wea. Forecasting 15: 630-637.
Gansert, D. 2004. Treelines of the Japanese Alps - altitudinal distribution and species composition under contrasting winter climates. Flora 199: 143-156.
Grubb, P.J. 1971. Interpretation of the 'Massenerhebung' effect on tropical mountains. Nature 229: 44-45.
Grubb, P.J. 1977. Control of forest growth and distribution on wet tropical mountains - with special reference to mineral-nutrition. Annu. Rev. Ecol. Syst. 8: 83-107.
Holtmeier, F.-K. 2003. Mountain Timberlines: Ecology, Patchi-ness, and Dynamics. Kluwer, Dordrecht, The Netherlands.
437 pp.
Hsieh, C.F., C.C. Liao, and I.L. Lai. 1996. The subtropical and tropical rain forests along a transect in the Nanjenshan preserve, Kenting National Park, the Kenting National Park, Pingtung County, 244 pp. (In Chinese with English Abstract.)
Lin, C.J., Y.Y. Lin, S.F. Lin, C.F. Hsieh, and C.R. Chiou. 2007.
Preliminary analysis of vegetation diversity in Taiwan-Study of altitudinal zones of woody plant communities. In T.H. Lu (ed.), Proceedings of the Fifth Symposium of Vegetation Diversity in Taiwan, Bureau of Forestry, Council of Agriculture, Executive Yuan, Taipei, pp. 66-86. (In Chinese with English Abstract.)
Lu, F.C., H.M.H. Juang, and C.C. Liao. 2007. A numerical case study of the passage of a cold surge across Taiwan. Meteor.
Atmos. Phys. 95: 27-52.
Munzel, U. and L.A. Hothorn. 2001. A unified approach to simultaneous rank test procedures in the unbalanced one-way layout. Biometrical J. 43: 553-569.
Richards, P.W. 1952. The Tropical Rain forest: An Ecological Study, 1st edn. Cambridge University Press, Cambridge,
450 pp.
Richards, P.W. 1996. The Tropical Rain Forest: An Ecological Study, 2nd edn. Cambridge University Press, Cambridge,
575 pp.
Su, H.J. 1984a. Studies on the climate and vegetation types of the natural forests in Taiwan (I): analysis of the variations in climatic factors. Quart. Jour. Chin. For. 17: 1-14.
Su, H.J. 1984b. Studies on the climate and vegetation types of the natural forests in Taiwan (II): altitudinal vegetation zones in relation to temperature gradient. Quart. Jour. Chin.
For. 17: 57-73.
Sun, I.F., C.F. Hsieh, and S.P. Hubbell. 1998. The structure and
species composition of a subtropical monsoon forest in
|
||
|
|||
|
|||
CHIOU et al. ¡X Plant species altitudinal distribution in Taiwan
|
95
|
||
|
|||
southern Taiwan on a steep wind-stress gradient. In F. Dall-meier and J.A. Comiskey (eds.), Forest diversity research, monitering and modeling: conceptial background and old
word case studies, UNESCO, Paris, pp. 563-590.
Trier, S.B., D.B. Parsons, and T.J. Matejka. 1990. Observations of a Subtropical Cold-Front in a Region of Complex Terrain. Mon. Wea. Rev. 118: 2449-2470.
Wang, C. 2004. Features of monsoon, typhoon and sea waves in the Taiwan Strait. Mar. Georesour. Geotechnol. 22: 133150.
|
Wang, C.C., G.T.J. Chen, T.C. Chen, and K. Tsuboki. 2005. A
numerical study on the effects of Taiwan topography on a convective line during the Mei-yu season. Mon. Wea. Rev.
133: 3217-3242.
Yeh, H.C. and Y.L. Chen. 1998. Characteristics of rainfall distributions over Taiwan during the Taiwan Area Mesoscale
Experiment (TAMEX). J. Appl. Meteorol. 37: 1457-1469.
Yen, M.C. and T.C. Chen. 2000. Seasonal variation of the rainfall over Taiwan. Int. J. Climatol. 20: 803-809.
|
||
|
|||
¥xÆW´Óª«ª«ºØ®ü©Þ¤À¥¬¼Ò¦¡¥Dn¬O¥ÑªF¥_©u·³y¦¨¡A¦Ó«D
¤s¶ô»W¼ö¾÷¨î³y¦¨
ªô¬èºa1 §º°ê¹ü1 ²ºÍ²[1 Áªø´I2 ¤ý¾_õ3 ³¯©ú¸q4 ¼B©M¸q5 ¸¼yÀs6
®L¬ê¤E7 ³¯¤l^8
1°ê¥ß¥xÆW¤j¾Ç´ËªLÀô¹Òº[¸ê·½¾Ç¨t
2°ê¥ß¥xÆW¤j¾Ç¥ÍºA¾Ç»Pºt¤Æ¥Íª«¾Ç¬ã¨s©Ò 3°ê¥ß¥xÆW®v½d¤j¾Ç¥Í©R¬ì¾Ç¨t 4°ê¥ß¤¤¿³¤j¾Ç¥Í©R¬ì¾Ç¨t 5°ê¥ß¤¤¤s¤j¾Ç¥Íª«¬ì¾Ç¨t 6°ê¥ß«ÌªF¬ì§Þ¤j¾Ç´ËªL¾Ç¨t 7°ê¥ßªFµØ¤j¾Ç¦ÛµM¸ê·½ºÞ²z¬ã¨s©Ò 8°ê¥ß©yÄõ¤j¾Ç¦ÛµM¸ê·½¾Ç¨t ¥»¬ã¨sªº¥Dn¥Øªº¬O«·s¤ÀªR´Óª«ª«ºØ¦b¥xÆW¤¤¥¡¤s¯ß¤¤¬q¡]¸W½u°ª©ó2,000¤½¤Ø¤§³B¡^ªº¤À¥¬¼Ò
¦¡¡A¨Ã§ä¥X³y¦¨³o¨Ç¤À¥¬¼Ò¦¡ªº³Ì«n¦]¤l¡C§Ú̦b¤¤¥¡¤s¯ß¤¤¬q±q¥_¨ì«n¡A«ö¤@©wªº¶¡¹j¡Aµe¥X¤F¤T ÓªF¦è¦Vªº¼Ë±a¡C¨CӼ˱a¤S®Ú¾Ú©Y¦V¡]ªF¦V©Y¤Î¦è¦V©Y¡^¦A¤À¦¨¨â°Ï¡C§Ú̧Q¥Î¥xÆW°ê®a´Ó¸s½Õ¬dp µeªº¸ê®Æ¨Ó¤ÀªR³o¤»Ó¼Ë°Ï¤ºª«ºØªº¤À¥¬¼Ò¦¡¡Cµ²ªGµo²{¦b¥_Ãä¤Î¤¤¶¡ªº¼Ë±aªF¦V©Yªºª«ºØ¤À¥¬©úÅã¦a ¤ñ¦è¦V©Yªº§C¡A¦ý¦b«nÃ䪺¼Ë±a¨âÓ©Y¦Vª«ºØ®ü©Þ¤À¥¬ªº®t¶Z¨Ã¤£ÅãµÛ¡C¤ÀªR¦P¤@Ó©Y¦V¤W¡Aª«ºØªu½n «×±è«×ªº¤À¥¬ÁͶաA¨äµ²ªGÅã¥Ü¦bªF¦V©Y¡Aª«ºØ®ü©Þ¤À¥¬ÀH½n«×ªº´î¤Ö¦Ó¼W¥[¡F¦Ó¦b¦è¦V©Y¡A³oÓÁÍ ¶Õ¨Ã¤£©úÅã¡C³o¨âÓ©Y¦VºIµM¤£¦Pªº¤À¥¬¼Ò¦¡¡A¥i¥ÎªF¥_©u·»P¤¤¥¡¤s¯ß¦a§Îªº¥æ¤¬§@¥Î¨Ó§´µ½¦a¸Ñ ÄÀ¡A¦ýµLªk¥Î¤s¶ô®ÄÀ³¡]Massenerhebung)¤¤ªº¤s¶ô»W¼ö¾÷¨î¨Ó¸ÑÄÀ¡C¹L¥h»{¬°´Óª«ª«ºØ®ü©Þ¤À¥¬¦b¤¤ ¥¡¤s¯ßªº¤¤³¡³Ì°ª¡A¶V©¹«n¥_¨âºÝ«h¶V§C¡C®Ú¾Ú§Ú̪º¬ã¨s¡A³oÓ»¡ªkÀ³¸Ón×¥¿¦¨¡G¦b¤¤¥¡¤s¯ß¤¤ ¬qªºªF¦V©Y¡Aª«ºØ¤À¥¬¶V©¹«n¶V°ª¡F¦b¦è¦V©Y¡Aª«ºØ¤À¥¬¨Ã¤£¦]½n«×§ïÅܦӦ³©úÅ㪺ÅܤơC |
|||
|
|||
ÃöÁäµü¡G®ü©Þ¤À¥¬¡F¤¤¥¡¤s¯ß¡F½n«×±è«×¡F©u·¡F¤s¶ô®ÄÀ³¡F¥xÆW¡C
|
|||
|
|||
|
|||||||||||||||||||||||||||||||||||||||||||||||||||||||||||||||||||||||||||||||||||||||||||||||||||||||||||||||||||||||||||||||||||||||||||||||||||||||||||||||||||||||||||||||||||||||||||||||||||||||||||||||||||||||||||||||||||||||||||||||||||||||||||||||||||||||||||||||||||||||||||||||||||||||||||||||||||||||||||||||||||||||||||||||||||||||||||||||||||
96
|
Botanical Studies, Vol. 51, 2010
|
||||||||||||||||||||||||||||||||||||||||||||||||||||||||||||||||||||||||||||||||||||||||||||||||||||||||||||||||||||||||||||||||||||||||||||||||||||||||||||||||||||||||||||||||||||||||||||||||||||||||||||||||||||||||||||||||||||||||||||||||||||||||||||||||||||||||||||||||||||||||||||||||||||||||||||||||||||||||||||||||||||||||||||||||||||||||||||||||||
|
|||||||||||||||||||||||||||||||||||||||||||||||||||||||||||||||||||||||||||||||||||||||||||||||||||||||||||||||||||||||||||||||||||||||||||||||||||||||||||||||||||||||||||||||||||||||||||||||||||||||||||||||||||||||||||||||||||||||||||||||||||||||||||||||||||||||||||||||||||||||||||||||||||||||||||||||||||||||||||||||||||||||||||||||||||||||||||||||||||
Appendix 1. List of the 76 common species and their geographical distribution.
|
|||||||||||||||||||||||||||||||||||||||||||||||||||||||||||||||||||||||||||||||||||||||||||||||||||||||||||||||||||||||||||||||||||||||||||||||||||||||||||||||||||||||||||||||||||||||||||||||||||||||||||||||||||||||||||||||||||||||||||||||||||||||||||||||||||||||||||||||||||||||||||||||||||||||||||||||||||||||||||||||||||||||||||||||||||||||||||||||||||
|
||||||||||||||||||||||||||||||||||||||||||||||||||||||||||||||||||||||||||||||||||||||||||||||||||||||||||||||||||||||||||||||||||||||||||||||||||||||||||||||||||||||||||||||||||||||||||||||||||||||||||||||||||||||||||||||||||||||||||||||||||||||||||||||||||||||||||||||||||||||||||||||||||||||||||||||||||
CHIOU et al. ¡X Plant species altitudinal distribution in Taiwan 97
|
||||||||||||||||||||||||||||||||||||||||||||||||||||||||||||||||||||||||||||||||||||||||||||||||||||||||||||||||||||||||||||||||||||||||||||||||||||||||||||||||||||||||||||||||||||||||||||||||||||||||||||||||||||||||||||||||||||||||||||||||||||||||||||||||||||||||||||||||||||||||||||||||||||||||||||||||||
Appendix 1. (Continued)
|
||||||||||||||||||||||||||||||||||||||||||||||||||||||||||||||||||||||||||||||||||||||||||||||||||||||||||||||||||||||||||||||||||||||||||||||||||||||||||||||||||||||||||||||||||||||||||||||||||||||||||||||||||||||||||||||||||||||||||||||||||||||||||||||||||||||||||||||||||||||||||||||||||||||||||||||||||
*Source: Hsieh, C.F. 2002. Composition, endemism and phytogeographical affinities of the Taiwan flora. Taiwania 47: 298-310.
|
||||||||||||||||||||||||||||||||||||||||||||||||||||||||||||||||||||||||||||||||||||||||||||||||||||||||||||||||||||||||||||||||||||||||||||||||||||||||||||||||||||||||||||||||||||||||||||||||||||||||||||||||||||||||||||||||||||||||||||||||||||||||||||||||||||||||||||||||||||||||||||||||||||||||||||||||||
|
||