Botanical Studies (2010) 51: 155-162.
PHYSIOLOGY
Growth and nutrient status in climbing plant (Parthenocissus tricuspidata (Siebold & Zucc.) Planch.) seedling in response to soil water availability
Zhong-Qiang WANG1,2, Liang-Huan WU1'3'*, and Sarkar ANIMESH1'3
1MOE Key Lab of Environmental Remediation and Ecosystem Health, College of Environmental and Resource Sciences, Zhejiang University, 268 Kaixuan Road, Hangzhou 310029, P.R. China
2State Environmental Protection Key Laboratory of Wetland Ecology and Vegetation Restoration, College of Urban and Environmental Sciences, Northeast Normal University, Changchun 130024, P.R. China
3Zhejiang Provincial Key Laboratory of Subtropic Soil and Plant Nutrition, College of Environmental and Resource Sciences, Zhejiang University, Hangzhou 310029, P.R. China
(Received April 29, 2008; Accepted September 10, 2009)
ABSTRACT. A pot experiment was conducted to investigate the effects of different soil water supply on growth features and nutrient status in Parthenocissus tricuspidata (Siebold & Zucc.) Planch. seedlings. Decreased soil moisture had significantly reduced the length of stem, internode and petiole, but resulted in an increase of root length. Soil water supply appeared to affect stem biomass to a lesser extent than root and leaf. The seedlings grown under high water supply invested more biomass in leaf (in terms of leaf number and leaf area). The N concentration in various plant organs followed in the order leaf>stem>root>petiole while K and P concentrations remained relatively constant at different soil moisture levels. Soil water supply had significantly affected N use efficiency, but did not affect P and K use efficiency. Moreover, there was a higher P use efficiency than N or K. In addition, P. tricuspidata had a low K concentration (below 10 mg-g-1) in all its plant tissues, which may allow the plants to limit its stomatal opening and reduce its water loss. The growth and nutrient responses of P. tricuspidata to different soil water supply indicated that this species could resilient to water availabilities and adapt to water stress conditions very well.
Keywords: Biomass allocation; Growth; Nutrient distribution; Nutrient use efficiency.
INTRODUCTION
Parthenocissus tricuspidata (Siebold & Zucc.) Planch. is a subtropical deciduous woody liana of the Vitaceae family, which have rapid growth to cover almost anything in their path, and may climb 20 m or more by adhesive tendrils attaching supports. The species have attractive bluish black fruits and handsome foliage that turns scarlet, crimson, or orange in the fall. Its ability to adapt to disad­vantageous growing conditions such as low nutrient soils, drought stress, a wide range of temperature and irradiation as well as its habit with great leaf area, rapidly climbing growth rate constitute the possible use of vegetation estab­lishment for vertical surfaces such as rock slope, wall and building. Parthenocissus tricuspidata can not only make a fine green cover for vertical surface but also control soil erosion, detain dust, clean air, and has become a popular ornamental plant for city green and environment manage-
ment (Zhang et al., 2000; Zhang et al., 2004). In addition, the species is also valued for its pharmaceutical properties. The fruit, stem, root bark and leaves are a good source of secondary products such as tannins, dyes and alkaloids (He, 1996).
The alterations in nutrients and water availability are in correlations to shape, and size of plant growth (Seyed and Majid, 2007). Water stress reduces the transpiration of the plant, which affects biomass formation and nutrient uptake with the transpiration stream. Parthenocissus tricuspidata have particularly narrow stems in relation to the leaf sur­face area they supply, however, the relationships between soil water supply, nutrient requirement and morphological changes have not been well studied.
The aim of this study is to determine how the growth features of P. tricuspidata respond to different soil water content by exploring the growth, dry weight, N, P, and K nutrient use efficiency and their distribution in various plant organs, and to what extent these traits may be con­sidered as explicit selection criteria for adaptation to water stress conditions.
*Corresponding author: E-mail: finm@zju.edu.cn; Phone: +86-571-86971921; Fax: +86-571-86971359.
156
Botanical Studies, Vol. 51, 2010
MATERIALS AND METHODS
Plant material and treatments
Seeds of P. tricuspidata were germinated in pots con­taining sand and peat (v/v 3:1). After 20 days, each seed­ling was transplanted into each plastic pot (30 cm high, 25 cm diameter) containing 5 kg clayed loam soil (pH 6.5, organic matter 22.08 g-kg-1, total N 1450 mg-kg-1, total P 1110 mg-kg-1, total K 780 mg-kg-1). At the same time, all the pots received an application of 0.6 g-kg-1 soil of fertil­izer (N-P2O5-K2O, 15-15-15). Five levels of water supply treatments were imposed at the six-leaf seedling stage with field capacity at 5% (W1), 15% (W2), 30% (W3), 60% (W4), and 100% (W5). Each treatment was replicated 10 times. Water was applied by pouring it into three plastic pipes (diameter: 1 cm) placed in the soil in order to limit the heterogeneity of the soil water content (Flenet et al., 1996). To minimize soil evaporation, the soil surface was covered with plastic film. Throughout the experiment, pots were weighed daily at 16:00 to replenish lost water. The experiment was conducted in a greenhouse where the tem­perature was maintained at 30-35°C during the day and 20-25°C at night. Air humidity was 65%-70%.
Data collection and analysis
The leaf relative water content (RWC) was estimated by determining fresh mass, dry mass, and the mass at full turgor after hydrated for 24 h with distilled water (Kumar and Singh, 1998) and calculated as follows:
Wl W2 W3 W4 W5
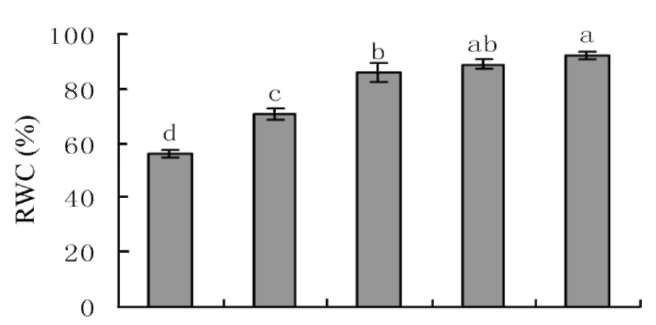
Figure 1. Leaf relative water content (RWC) of P. tricuspidata seedling under different water supplies condition. Different letters in the column represent significant difference at P0 05 level by Duncan's new multiple range test.
software. The Duncan test was used to perform multiple comparisons at a significance level of P<0.05.
RESULTS
Leaf relative water content (RWC)
Leaf RWC reflects the water content in plant tissue and is often used as a parameter to assess the severity of water stress. Figure 1 showed that Leaf RWC significantly decreased along with the decreasing water supply which was 92% in W5, 89% in W4, 86% in W3, 71% in W2 and only 56% in W1, that reflected the sensitive response of P. tricuspidata for changing of soil water content.
Growth morphology
The morphology of P. tricuspidata seedlings was significantly affected by water supply (Table 1). Increasing water supply led to increase in stem diameter, internode length and petiole length of seedlings, but decrease root length. The branch number, total branch length, leaf number and total leaf area of seedlings grown under lower water supply was lower as compared to those seedlings grown under higher water supply. W4 had the highest stem length (79.7 cm) than other treatments. This result represented 68% decrease in W1 and 36% in W5 as compared with seedlings under W4 treatment.
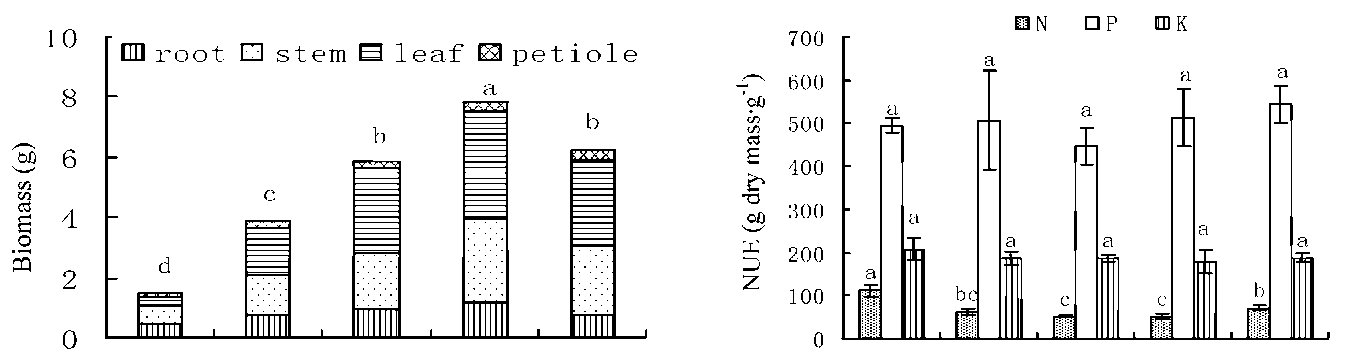
Dry biomass and biomass partition
Figure 2 showed that total biomass accumulation was significantly decreased with soil water supply decreasing from W4 to W1. Under lower soil water supplies, root growth constituted the largest proportion of the biomass (Figure 3). The ratio of root / above ground dry biomass partition had decreased along with increasing water sup­ply. The highest value (0.44) was observed in W1 and the lowest value (0.15) in W5. The ratio of leaf / stem biomass under different water supply exceeded 1, except for W1 (0.49) (Figure 3). Under soil water supply between W2 and W5, leaf has accounted for more than 40% of total plant biomass, while stem, root and petiole accounted for less than 36%, 20% and 6%, respectively (Figure 3).
Seedlings were harvested 60 days after the fist induction of water supply treatments (from August to October). The measured morphological features measured were root length, stem length, stem diameter, internode length, petiole length, total shoot length, branch number and leaf number. The total leaf area per plant was measured using a Li-3000 leaf area meter (Li-COR, Lincoln, Nebraska). Each plant organs (leaves, stems, and roots) was dried at 70°C for 48 h. After dried completely, plant organs were ground and passed through a 20 mesh screen for the tissue nutrient (N, P and K) concentrations estimation (Ru, 2000). Total nutrient content of each tissue type was calculated by multiplying their respective dry mass by their tissue nutrient concentrations. Total plant dry mass or nutrient content was calculated as a sum of the dry mass or nutrient contents of an individual's stem, roots, and leaves.
Nutrient use efficiency (NUE) of N, P and K were calculated using the following equation (Baligar et al.,
2001):
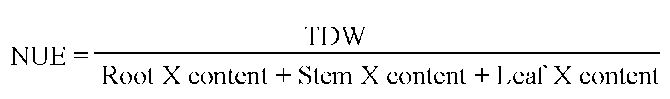
Where TDW is total dry weight of plant in g-plant-1; X stands for N, P or K content in g-plant-1.
Data were analyzed with STATISTICA package 5.0
WANG et al. ― Growth and nutrient in P. tricuspidata
157
Table 1. Effects of water supply on morphological characteristics of Parthenocissus tricuspidata Planch. seedling.
Parameter
W1
W2
W3
W4
W5a
31. 7±2.6a
26.2±2.3b
20.3±1.5c
20.0±3.8c
13.3±2.7d
25.4±1.6d
45.2±7.6c
65.5±6.6b
79.7±9.4a
51.3±4.3c
3.2±0.4c
4.2±0.8bc
4.8±0.8ab
4.7±0.5ab
5.3±0.5a
1.7±0.2b
2.1±0.3ab
2.4±0.4a
2.4±0.2a
2.5±0.3a
1.4±0.3d
2.2±0.2c
2.3±0.2c
2.8±0.3b
3.1±0.2a
0
2. 7±0.5c
3. 7±0.8a
3. 7±0.5a
3.2±0.2b
0
4.0±1.4c
10.7±2.2ab
12.7±2.1a
9.0±1.8b
13.8±2.8d
22.5±2.1c
26.3±1.5b
30.8±1.7a
21.5±1.3c
102±32c
405±138b
523±30b
692±89a
414±51b
Root length cm Stem length cm Stem diameter mm Internode length cm Petiole length cm Branch number Total branch length cm Leaf number Total leaf area (cm2)
aFigure in the table represent means standard error; Different letters in the column means significant difference at P - 0.05 by Duncan's new multiple range test. Same for all tables in this paper.
Tissue N concentration, N content, and N distribution
The tissue N concentration followed a linear order of leaf>stem>root>petiole under five different water supply treatments (Table 2). The N concentration of leaf and stem were not significantly different among W2, W3 and W4 treatments. Root and petiole N concentration under W2 treatment had a much higher value than that of plants grown under other treatments. N content in root, stem, leaf and petiole of seedlings grown under W4 condition was the highest among all other water supply treatments. The plant total N content had increased with an increase of water supply (from W1 to W4) except in W5 which was only decreased. Leaf was the main tissue for nitrogen accumulation, accounting for 45-60% of total accumulated nitrogen in plant between W2 and W5.
Tissue P concentration, P content, and P distribution
Table 3 shows that tissue P concentration of stem was not significantly affected regardless of water supplies. P concentration of root, leaf and petiole was significantly decreased under W1 and W5 treatments. The P content
was mainly distributed in leaf and shoot, accounting for 37-44% of the total accumulated phosphorus in plant between W2 and W5. The plant total P content had increased (from W1 to W4) with the increasing of water supply except in W5 which was decreased.
Tissue K concentration, K content, and K distribution
The K concentration, K content and K distribution in different parts of the seedling (leaves, stem, root and petiole) were presented in Table 4. It was evident that K concentration in different parts of the seedling had only slight differences and therefore was not significantly affected by the different water treatments. Leaf and stem tissues contained higher K content than root and petiole, except for treatment W1. Leaf K partition in whole plant K was ever increased along with increasing water supply while a contrary trend in root K partition which was decreased. Stem K partition in whole plant K had no clear difference under the different water supply treatments as it ranged from 33-42%. With an increase of water supply (from W1 to W4), the plant total K content had increased except in W5.
Wl W2 W3 W4 W5
Figure 2. Effect of biomass of P. tricuspidata under different soil water supply.
Wl W2 W3 W4 W5
Figure 3. Nutrient (N, P and K) use efficiency of P. tricuspidata seedling under different water supplies.
158
Botanical Studies, Vol. 51, 2010
Table 2. Nitrogen concentration and content in leaf, shoot, root, petiole and total plant tissues and nitrogen distribution in leaf, shoot, root and petiole tissues as percent of total plant N content of seedlings of P. tricuspidata seedling under different water supplies.
Parameter
W1
W2
W3
W4
W5
Nitrogen concentration (mg-g-1)
Root
7.7±2.5d
17.0±1.6a
14.2±1.2ab
12.3±0.2bc
11.0±1.5c
Stem
8.0±1.7b
14.7±0.8a
15.6±0.5a
17.2±0.8a
10.8±3.3b
Leaf
12.1±1.3c
19.2±3.7ab
23.2±0.6a
22.2±2.8a
17.4±3.0b
Petiole
5.6±1.8c
8.5±0.3a
7.8±0.4ab
7.1±1.1abc
6.2±0.7c
Nitrogen content (mg-plant-1)
Root
3.5±1.1c
13.4±1.4a
13.3±1.7a
14.9±1.0a
8.9±1.4b
Stem
5.1±1.9d
18.9±4.8c
29.4±1.7b
47.8±5.0a
24.4±8.1bc
Leaf
3.7±0.5d
29.8±7.3c
64.3±1.6ab
79.6±7.9a
50.0±9.7b
Petiole
0.6±0.3b
2.0±0.2a
1.9±0.2a
2.3±0.5a
1.9±0.2a
Total plant
13.0±3.3d
64.1±5.8c
109.0±0.8b
144.5±3.4a
85.3±3.5c
Nitrogen distribution %
Root
27
21
12
10
10
Stem
39
30
27
33
29
Leaf
29
46
59
55
59
Table 3. Phosphorus concentration and content in leaf, shoot, root, petiole and total plant tissues and phosphorus distribution in leaf, shoot, root and petiole tissues as percent of total plant P content of seedlings of P. tricuspidata seedling under different water supplies.
Parameter
W1
W2
W3
W4
W5
Phosphorus concentration (mg-g-1)
Root
1.5±0.4c
2.3±0.2a
2.3±0.1a
1.7±0.1a
1.7±0.3b
Stem
2.6±0.2a
2.2±0.9a
2.8±0.4a
2.3±0.1a
2.2±0.2a
Leaf
1.2±0.2b
1.9±0.2ab
1.9±0.2a
1.8±0.6a
1.7±0.1b
Petiole
1.2±0.1b
1.3±0.1b
1.6±0.3a
1.3±0.1ab
1.2±0.1b
Phosphorus content (mg-plant-1)
Root
0.7±0.2c
1.8±0.2a
2.2±0.3a
2.1±0.1a
1.4±0.2b
Stem
1.6±0.4b
2.9±1.4b
5.4±0.9a
6.4±0.9a
5.0±0.4a
Leaf
0.4±0.1c
3.0±0.5b
5.3±0.7a
6.1±1.4a
4.8±0.3a
Petiole
0.1±0.04c
0.3±0.02b
0.4±0.09ab
0.4±0.07a
0.4±0.05ab
Total plant
2.8±0.7e
8.0±1.2d
13.2±1.2b
15.0±0.6a
11.5±0.4c
Phosphorus distribution %
Root
25
22
16
14
12
Stem
57
37
40
43
44
Leaf
13
37
41
40
41
Petiole
5
4
3
3
3
WANG et al. ― Growth and nutrient in P. tricuspidata 159
Table 4. Potassium concentration and content in leaf, shoot, root, petiole and total plant tissues and potassium distribution in leaf, shoot, root and petiole tissues as percent of total plant K content of seedlings of Parthenocissus tricuspidata Planch. seedling under different water supplies.
Parameter
W1
W2
W3
W4
W5
Potassium concentration (mg-g-1)
Root
6.7±1.0a
7.1±0.6a
6.1±0.5ab
5.4±0.4b
6.3±0.4ab
Stem
5.5±0.6a
5.8±0.6a
5.6±0.02a
5.9±0.5a
5.5±3.0a
Leaf
4.0±0.1b
5.0±0.3ab
5.1±0.4a
5.3±1.0a
5.2±0.4a
Petiole
3.3±0.2b
5.7±0.9a
6.1±0.4a
6.8±1.1a
5.6±0.8a
Potassium content (mg-plant-1)
Root
3.1±0.5d
5.5±0.3bc
5.7±0.3b
6.5±0.1a
5.1±0.3c
Stem
3.4±0.5e
7.4±1.0d
10.6±0.3c
16.4±0.7a
12.5±1.8b
Leaf
1.2±0.1d
7.9±1.6c
14.1±0.6b
18.7±3.6a
15.0±1.4b
Petiole
0.3±0.1c
1.4±0.3b
1.5±0.1b
2.1±0.4a
1.7±0.2ab
Total plant
8.0±0.7d
22.2±0.7c
31.9±0.2b
43.8±4.6a
34.4±1.0b
Potassium distribution %
Root
38
25
18
15
15
Stem
42
33
33
37
36
Leaf
16
36
44
43
44
Petiole
4
6
5
5
5
Table 5. Whole plant N-P-K tissue contents (expressed relative to P content) of P. tricuspidata seedling under different water supplies.
DISCUSSION
Seedling growth
Many studies have shown that soil water supply can affect the growth of plant organs (Rascio et al., 1990; Spollen et al., 1993), which result in an alteration of its morphology and nutrient uptake (French and Turner, 1991). Consequently, the pattern of dry mass accumulation and nutrient distribution within the plant may be affected (Chartzoulakis et al., 1993; Cox and Conran, 1996; Zhou and Chen, 1 997). Under low soil water availability, P. tricuspidata seedlings had invested more biomass distribution in root growth (Figure 3) as root elongation was stimulated (Table 1) in order to absorb more water for higher survival competitive capacity under water stress (Rodrigues et al., 1995). The increased root dry mass ratio under lower water supply was in accordance with early studies in other plants (Sharp et al., 1990). In this study, soil water availability appeared to affect stem biomass less than root and leaf. As the soil moisture content increased from W2 to W5 treatments, the biomass of stem relative to the total biomass varied from 32% to 36%, while the variation of the root biomass is from 13 to 20% and the range of the leaf biomass is from 40 to 47% (Figure 3). The seedlings grown under high water supply invested more biomass in leaf as observed in an increase of leaf number and leaf area (Table 1). Changes in leaf biomass may adjust transpiration to control plant water status of the
W1
W2
W3
W4
W5
N
4.6
8.2
8.3
9.7
7.4
P
1
1
1
1
1
K
2.9
2.8
2.4
2.9
3.0
N-P-K ratios
Plant tissues contained more N than K and more K than P for all treatments in this study (Table 5). Relative to P
content, the N content ranged from 4.6 (W1) to 9.7 (W4) and the K content ranged from 2.4 (W2) to 3.0 (W5). The
N-P-K ratio was the highest in W4 treatment among all soil water supply treatments.
Nutrient use efficiency
Figure 4 shows that there were no significant effects for P and K use efficiency under different water stressed conditions, however N use efficiency of W3 and W4 treat­ments was clearly lower than W1 and W5 (p<0.01). In general, P use efficiency was higher than either N or K under the five soil water supply treatments.
160
Botanical Studies, Vol. 51, 2010
species to adapt different soil water supply.
Unlike trees species, climber species typically have a very high leaf : stem ratio and relatively little structural support, so the slender stem only transport nutrient and water (Putz and Harold, 1991). Parthenocissus tricuspi-data showed a high phenotypic plasticity which may en­hance its capacity to survive and reproduce under different soil water conditions. Under low soil water condition, P. tricuspidata showed a decrease in its stem, internode and branch length to shorten the distance of water transportion, while its stem diameter increased with the increasing of soil water content to enlarge water flux. These morpholog­ical changes in the stem structures in response to soil water supply indicated that it is an important way to change the length and diameter of stem to suit for soil water condi­tion.
Nutrient status
The nutrient status of a plant played a significant role in altering the rate of development, extent of growth, and even morphological features (Epstein and Arnold, 2005). Given rapid growth rates and voluminous leaf production, climbing plants certainly must have special characteristics in their nutrient cycling mechanism (Putz and Harold, 1991). Water supply was the main variable controlling nutrient uptake in the plant. As suggested by Erlandsson, 1975, water stress tends to reduce nutrient uptake by roots and transport from roots to shoots due to restricted transpiration rates and membrane permeability. This study examined the performance of the different essential nutrients of P. tricuspidata related to leaf, root growth, and biomass allocation under different soil water supply. Decreasing of water supply decreased foliar N, P and K concentration but increased root N and P concentration, and had no significant effect on stem N, P and K and root K. The W1 (severe drought) and W5 (overfull water) treatments had a negative effect on nutrient uptake. According to N-P-K ratio under five water supply treatments (Table 5), the average N content in plant is 4.5 to 9.7 times than that of P, 2 to 3 times than that of K. These results may support a conclusion that water supply has constrained N uptake to a much greater extent than to P and K in P. tricuspidata. It is therefore suggest that N management is essential for enhancing biomass production of P. tricuspidata.
Many studies have indicated that increased nutritional supply (particularly P) confers increased drought tolerance under dry conditions (Premchandra et al., 1990; Singh et al., 2006). Table 3 showed that root P concentration was higher than other parts, it will contribute to root growth and root hydraulic conductivity to uptake soil water and nutrients (Schnitzer and Bongers, 2000). P concentrations of plant under optimal growth conditions vary between 1.5 mg-g-1 and 5 mg-g-1 (Raghothama, 1999). The tissue P concentration of P. tricuspidata was 1.2-3 mg-g-1 under all water supply treatments, which had relative lower P con­centration. P use efficiency was not significantly affected
by soil water supply (Table 6), and higher P use efficiency and lower P concentration also indicated that P. tricuspi-data is a species adapted to low P environments.
Plant tissue K concentrations can vary within a wide range, from 10 mg-g-1 to 40 mg-g-1, and K concentration below 10 mg-g-1 will lead to deficiency symptoms in most species (Markus and Pascal, 2007). However, the tissue K concentration of P. tricuspidata was determined to range from 3 mg-g-1 to 7 mg-g-1 under all water supply treatments. This concentration was much lower than the critical value of K deficiency. Potassium is the main osmotic solute in plants (Wyn Jones et al., 1979). High K concentration in plants has been shown to favor water uptake and stomatal opening while potassium-deficiency may result in an earlier stomatal closure and inhibit transpiration (Tomemori et al., 2002; Kudoyarova et al., 2007). Parthenocissus tricuspidata has slender stem and large leaf area. The thin stem limit water and nutrient flux while the large leaf biomass may accelerate transpiration. Under this especial growth structure condition, the low K concentration in the tissues of P. tricuspidata may be advantageous as this may cause the reduction of cell turgor which could result in stomatal closure that lead to the reduction of transpiration rate and therefore restricts further water loss. Plants with efficient stomatal control ability are able to survive well in drought environments (Saliendra et al., 1995). Further research is certainly needed to evaluate this phenomenon of low K concentration in P. tricuspidata, as this may be a unique drought tolerance mechanism for this species.
Nutrient storage mainly depends on the rate of biomass accumulation and nutrient concentration in different plant organs (Swamy et al., 2003). In P. tricuspidata, leaf was the main tissue for nutrient accumulation, accounting for
more than 45% (N), 35% (P), and 35% (K) of the total
accumulated nutrients in the plant tissues across different water supply conditions in this study W2-W5. Some reports showed that there was a strong positive correlation between foliar nutirent content and photosynthesis (Brown et al., 1995; Paquin et al., 2000). Moreover, P. tricuspidata has allocated a large proportion of its biomass to leaves. Therefore, this may be a plausible physiological adaptation to ensure an optimal photosynthetic capacity of the species.
Parthenocissus tricuspidata could adjust biomass, nutrient allocation and nutrient use efficiency in response to soil water availability. Higher P use efficiency, lower P and K acquisition compared with N, indicated that P. tricuspidata had different nutrient adaptation strategies to optimize its uptake of N, P and K under different soil water supply. Based on these results, we suggested N nutrient should be preferentially selected to fertilize. Further research would be undertaken to investigate photosynthesis and water use efficiency of P. tricuspidata under different soil water availability as this will help in understanding the complex growth mechanisms of this species.
WANG et al. ― Growth and nutrient in P tricuspidata
161
Acknowledgements. This study was supported by Key Projects in the National Science & Technology Pillar
Program (No. 2008BADA4B03); National Natural Science
Foundation of China (No. 30871595); the Science and Technology Cooperation Project of Ningbo, China (No.
2005C100041).
LITERATURE CITED
Baligar, V.C., N.K. Fageria, and Z.L. He. 2001. Nutrient use efficiency in plants, Commun. Soil Sci. Plant Anal. 32(7&8): 921-950.
Brown, K.R., W.A. Thompson, E.L. Camm, B.J. Hawkins, and R. D. Guy. 1 995. Effects of N addition rates on the productivity of Picea stichensis, Thuja plicata and Tsuga heterophyllaseedlings. II. Photosynthesis, 13C discrimination, and N partitioning in foliage. Trees 10:
198-205.
Chartzoulakis, K. , B. Noitsakis, and I. Therios. 1 993. Photosynthesis, plant growth and dry matter distribution in kiwifruit as influenced by water deficits. Irrigation Sci. 14:
1-5.
Cox, J.A. and J.G. Conran. 1996. The effect of water stress on the life cycles of Erodium crinitum Carolin and Erodium cicutarium (L.) L'He rit. ex Aiton (Geraniaceae). Austra. J.
Ecol. 21: 235-240.
Epstein, E. and J.B. Arnold. 2005. Mineral nutrition of plants: principles and perspectives, Second Edition. Sinauer Associaters press. Sunderland, USA, pp. 147-148.
Erlandsson, G. 1975. Rapid effects on ion and water uptake induced by changes of water potential in young wheat
plants. Physiol. Plant. 35: 256-262.
Flenet, F., A. Bouniols, and C. Saraiva. 1996. Sunflower response to a range of soil water contents. Euro. J. Agron. 5:
161-167.
French, R.J. and N.C. Turner. 1991. Water deficit change dry matter partitioning and seed yield in narrow-leafed lupins
(Lupinus angustifolius L.). Aust. J. Agric. Res. 42: 471­484.
He, G.F. 1996. A Collection of Special Subject Reports in
Investigations and Studies on Plant Resources. Science Press, Beijing, China, pp. 56-58.
Kudoyarova, G.R., D.S. Veselov, R.G. Faizov, S.V. Veselova, E.A. Ivanov, and R.G. Farkhutdinov. 2007. Stomata Response to Changes in Temperature and Humidity in Wheat Cultivars Grown under Contrasting Climatic
Conditions. Rus. J. Plant Physi. 54(1): 46-49.
Kumar, A. and D.P. Singh. 1998. Use of physiological indices as a screening technique for drought tolerance in oilseed Bras-sica species. Ann. Bot. 81: 413-420.
Markus, G. and M. Pascal. 2007. Potassium transporters in plants - Involvement in K+ acquisition, redistribution and
homeostasis. FEBS Lett. 581: 2348-2356. Paquin, R., H.A. Margolis, R. Doucet, and M.R. Coyea. 2000.
Physiological responses of black spruce layers and planted seedlings to nutrient addition. Tree Physiol. 20: 229-237.
Premchandra, G.S., H. Saneoka, K. Fujita, and S. Ogata. 1990.
Cell membranestability and leaf water relations as affected by phosphorus nutrition under water stress in maize. Soil Sci. Plant Nutr. 36: 661-666.
Putz, F.E. and A.M. Harold. 1991. The Biology of Vines.
Cambridge University Press, Cambridge, UK. Raghothama, K.G. 1999. Phosphate acquisition. Annu. Rev.
Plant Physiol. Plant Mol. Biol. 50: 665-693. Rascio, A., M.C. Cedota, M. Toponi, Z. Flagella, and G. Wit-
tmer. 1990. Leaf morphology and water status changes in Triticum durum under water stress. Physiol. Plant. 78:
462-467.
Rodrigues, M.L., C.M.A. Pacheco, and M.M. Chaves. 1995. Soil-plant water relations, root distribution and biomass partitioning in Lupinus albus L. under drought conditions. J.
Exp. Bot. 46: 947-956.
Ru, K. 2000. Analysis Method of Soil and Agrochemistry. Chinese Agricultural Science and Technology Press. Beijing, China, pp. 638.
Saliendra, N.Z., J.S. Sperry, and J.P. Comstock. 1995. Influence of leaf water status on stomatal response to humidity, hydraulic conductance, and soil drought in Betula occidentalis. Planta 196: 357-366.
Schnitzer, S.A. and F. Bongers. 2002. The ecology of lianas and their role in forests. Trend. Ecol. Evol. 17(5): 223-230.
Seyed, H.M. and R. Majid. 2007. Seasonal changes of mineral nutrients and phenolics in pomegranate (Punica granatum
L.) fruit. Sci. Hortic. 111: 120-127.
Sharp, R.E., T.C. Hsiao, and W.K. Silk. 1990. Growth of the
maize primary root at low water potentials. Plant Physiol.
93: 1337-1346.
Singh, V, C.K. Pallaghy, and D.K. Singh. 2006. Phosphorus nu­trition and tolerance of cotton to water stress. I. Seed cotton yield and leaf morphology. Field Crops Res. 96: 191-198.
Spollen, W.G., R.E. Sharp, I.N. Saab, and Y. Wu. 1993. Regulation of cell expansion in roots and shoots at low water potentials. In J.A.C. Smith and H. Griffiths (eds.), Water Deficits: Plant Responses from Cell to Community.
Bios, Oxford, UK, pp. 37-52.
Swamy, S.L., S. Puri, and A.K. Ingh. 2003. Growth, biomass, carbon storage and nutrient distribution in Gmelina arborea Roxb. stands on red lateritic soils in central India. Bioreso.
Tech. 90: 109-126.
Tomemori, H., K. Hamamura, and K. Tanabe. 2002. Interactive effects of sodium and potassium on the growth and photosynthesis of spinach and komatsuna. Plant Prod. Sci.
5: 281-285.
Wyn Jones, R.G., C.J. Brady, and J. Speirs. 1979. Ionic and osmotic relations in plant cells. In D.H. Laidman and R.G. Wyn Jones (eds.). Recent Advances in the Biochemistry of Cereals. Academic Press, London, UK, pp. 63-103.
Zhang, Y.G., Z.Y. Sun, and S.L. Ru. 2000. The strategies of
162
Botanical Studies, Vol. 51, 2010
making green in barren mountains with creepers. Forest Sci.
Tech. 2000(1): 26-27. Zhang, Z.J., L. Shi, J.Z. Zhang, and C.Y. Zhang. 2004.
Photosynthesis and growth responses of Parthenocissus quinquefolia (L.) Planch. to soil water availability.
Photosynthetica 42(1): 87-92.
Zhou, L.Y. and Z.X. Chen. 1997. Study on rational irrigation for wheat production in Fengqiu Region: I. Analysis of the relation between soil water supply and wheat yield.
Pedosphere 7(3): 251-256.
土壤水分對攀緣植物爬山虎幼苗生長和養分吸收的影響
王忠強1,2 吳良歡13 Sarkar ANIMESH1,3
1浙江大學環境與資源學院教育部環境修復和生態健康重點實驗室
2東北師範大學城市與環境科學學院教育部濕地植被和生態恢復重點實驗室
3浙江大學環境與資源學院浙江省亞熱帶土壤和植物營養重點實驗室
本文研究了在土壤盆栽條件下,不同土壤含水量對攀緣植物爬山虎幼苗生長和營養特性。結果表
明:土壤水分減少,顯著減少主莖、節間和葉柄長度,但增加根的長度。土壤水分供應對爬山虎根和葉
生物量影響高於對主莖生物量的影響,較高的土壤水分使葉生物量增加顯著。在不同的土壤含水量條件
下,爬山虎的各器官氮養分濃度的順序是葉> > > 葉柄,而各器官的磷和鉀的養分濃度值保持相
對穩定,但爬山虎有低的鉀濃度(小於10 mg-g-1),可能控制爬山虎的葉片的氣孔開放,降低葉片的水
分散失。土壤含水量顯著影響爬山虎的氮的利用率,但對磷鉀利用率影響不顯著,磷的利用率顯著高於
氮和鉀利用率。
關鍵詞:生物量;生長;營養特性;利用率。