Bot. Bull. Acad. Sin. (1996) 37: 9-15
Shiah et al. Coastal primary production and phytoplankton biomass
Spatial variability of phytoplankton production and the
implications of its controlling mechanisms in the coastal
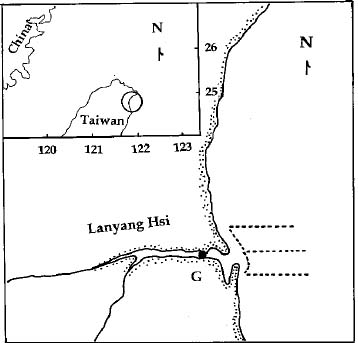
zone near the river mouth of the Lanyang Hsi
Fuh-Kwo Shiah1,4, Shuh-Ji Kao2, Gwo-Ching Gong3, and Kon-Kee Liu1,2
1Global Change Research Center, National Taiwan University, Taipei, Taiwan, Republic of China
2Institute of Oceanography, National Taiwan University, Taipei, Taiwan, Republic of China
3Department of Oceanography, National Taiwan Ocean University, Keelung, Taiwan, Republic of China
(Received May 3, 1995; Accepted September 19, 1995)
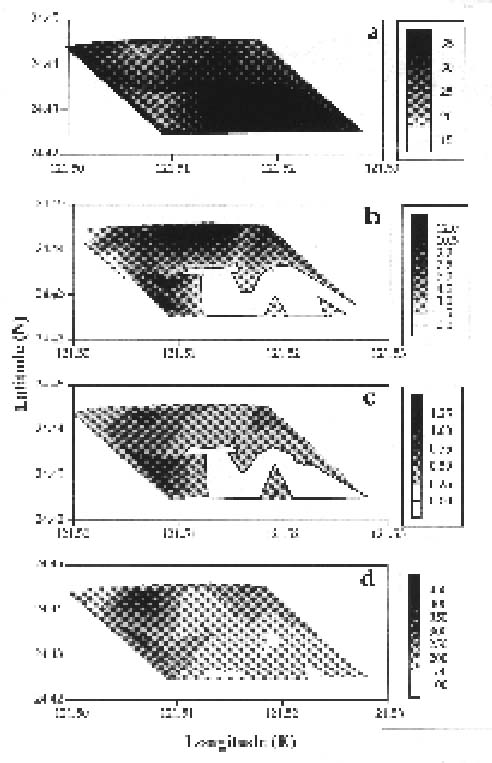
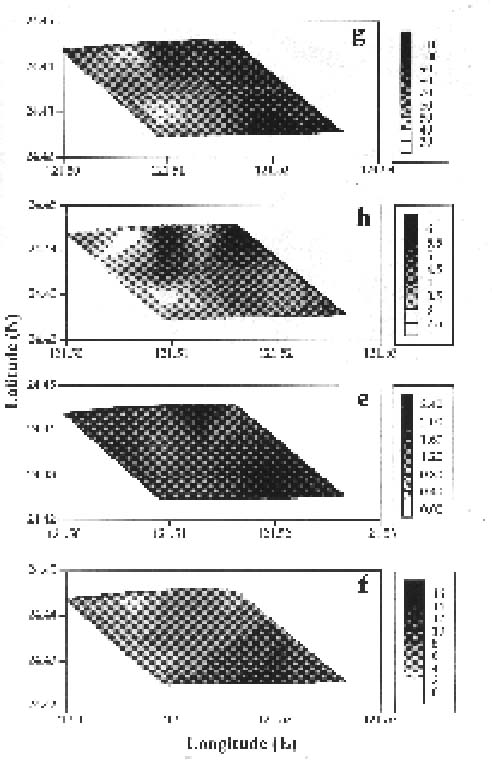
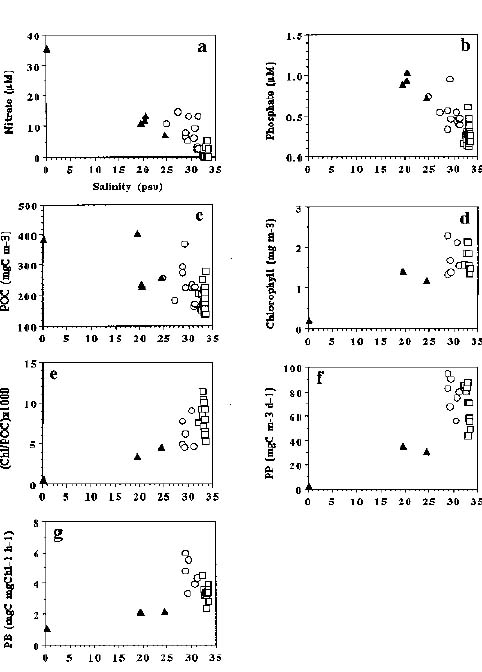
Abstract. Spatial patterns of phytoplankton properties, including primary production, chlorophyll a concentrations and normalized production indices in the coastal zone near the river mouth of the Lanyang Hsi were investigated during high tide in September of 1994. Concentrations of inorganic nutrients (nitrate and phosphate) and particulate organic carbon were also measured simultaneously. Three types of water including river mouth water, seawater, and mixed water were categorized due to the patchiness of measured variables in the study area. Extremely low values of phytoplankton properties observed in the nutrient-laden and turbid river mouth water indicates that light intensity is the major limiting factor on photosynthesis processes. In contrast, nutrient availability may limit the growth of phytoplankton in the seawater area where nutrient concentrations were lower than the half saturation constants for nutrient uptake. Nutrient data which deviated from the conservative mixing line indicated that the mixed water area may be a source of nutrients via sediments diagenensis processes. The coincidence of the high nutrient concentrations and high phytoplankton properties in the mixed water area suggests phytoplankton growth rates are probably not limited by nutrient supply. Since the mouth of the Lanyang Hsi is very narrow and shallow, nutrient-laden river water can be rapidly mixed with seawater. The relatively short residence time of riverine nutrients combined with the low phytoplankton activities in the river mouth may lead to more nutrients available for the growth of phytoplankton in the marine part.
Keywords: Coastal zone; Inorganic nutrients; Phytoplankton growth rates; Spatial variability; Tide; Turbidity; Wave.
Introduction
Studying the temporal and spatial variability of primary production and its controlling mechanisms is essential to understand the biogeochemical cycle of carbon in the ocean (Cullen et al., 1992; Knauer, 1991; Longhurst and Harrison, 1989). Phytoplankton constitute the base of the marine food webs and thus may affect the dynamics of higher trophic levels such as fishery yields due to the variability in their biomass and production. More importantly, the sinking of dead phytoplankton into the deep ocean (i. e. export production) acts as an important sink for atmospheric CO2 (i.e. the biological pump). When compared with the open ocean, the coastal and estuarine ecosystems may be much smaller, either in terms of area or volume, but the amount of organic carbon exported to the deep ocean (13.7 × 10¹⁵ ton C y-1) through these systems can be equal to that of the open ocean system (13.2 × 10¹⁵ ton C y-1, Berger et al., 1989; Bienfang and Ziemann, 1992). In recognition of this, several large inter-disciplinary research programs, such as LMER (Land Margin Ecosystem Research) and LOICZ (Land-Ocean Interactions in the
Coastal Zone) have been initiated to address the importance of estuarine and coastal ecosystems.
From a scaling point of view, there are two basic strategies for studying phytoplankton properties (biomass and production) in coastal and estuarine ecosystems. One is to address the spatial variability by holding the time factor constant (i. e. this study, see below), and the other is to investigate the temporal variability emphasizing the changes at diel, seasonal, and interannual scales (see Malone, 1991 for review). Both types of investigation are essential for the study of coastal ecology; however, until recently, information about them was quite rare in Taiwan.
Many studies have demonstrated that the plankton community's spatial variability is usually most intense at the margins of land and ocean and tends to be correlated with physical and hydrographic factors (see Mackas et al., 1988 for review). The regulation of the planktonic ecosystem by chemical and physical processes and the form and intensity of this dependence are often strongly signaled in the spatial distribution patterns of plankton properties. Light, temperature, nutrient availability, and zooplankton grazing are the four major factors considered important in regulating phytoplankton properties in aquatic ecosystems (for review, see Cullen et al., 1992). The spa
4Corresponding author.