Bot. Bull. Acad. Sin. (1996) 37: 107-111

Chen and Pan — Assay of superoxide dismutase activity

Assay of superoxide dismutase activity by combining

electrophoresis and densitometry

Ching-Nen Chen and Shu-Mei Pan1

Department of Botany, National Taiwan University, Taipei, Taiwan 10764, Republic of China

(Received November 20, 1995; Accepted March 2, 1996)

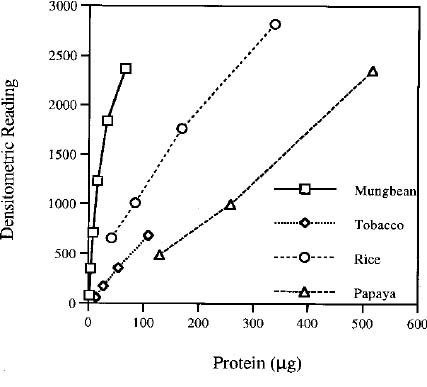
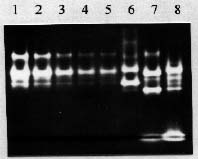
Abstract. A modified technique was developed to assay superoxide dismutase (SOD) activity by combining polyacrylamide gel electrophoresis and densitometry. After electrophoresis on native polyacrylamide gels, the negative banding corresponding to the SOD activity was visualized by soaking the gels in nitroblue tetrazolium then riboflavin, and finally exposing to light. Effects of the banding of SOD activity induced by different soaking durations and light intensities were evaluated in this system. The optimal soaking duration was determined to be 15 min for each of the two soaking steps, while the optimal exposure was 30 mEm-2s-1 for 15 min. The gels were then immediately scanned with a laser densitometer, and the readings of the samples corresponding to their total SOD activity were obtained by processing the image. A standard curve was prepared with a serial dilution of partially purified SOD, whose activity was previously determined by using a spectrophotometric method. The total SOD activity of an unknown sample could be obtained by interpolating its reading to the standard curve. The activity of a single SOD isozyme of a sample could also be obtained with the same procedure. The technique was ten times more efficient than the spectrophotometric method. The interference coming from non-SOD substances in the crude extract could be removed by electrophoresis. The standard deviations of the SOD activity of the crude extracts from rice seedlings, papaya, and tobacco leaves measured with the technique were less than 9%, 7%, and 8% (for each n = 6, on 6 gels), respectively.

Keywords: Densitometry; SOD isozyme; Superoxide dismutase.

Abbreviations: DETAPAC, diethylenetriamine pentaacetic acid; ED, electrophoretic-densitometry; NBT, nitroblue tetrazolium; SOD, superoxide dismutase; TEMED, tetramethylenediamine.

Introduction

Superoxide radical (•O2_) is generated as a by-product in aerobic organisms from a number of physiological reactions such as the electron flow in the chloroplasts and mitochondria and from some redox reactions in cells. It can react with hydrogen peroxide (H2O2) to produce hydroxyl radical (•OH_), one of the most reactive molecules in the living cells. Hydroxyl radical can cause the peroxidation of membrane lipids, breakage of DNA strands, and inactivation of enzymes in cells (for reviews, see Bowler et al., 1992; Mehdy, 1994). To ameliorate the damage caused by hydroxyl radical formed from superoxide radical and hydrogen peroxide, organisms have evolved mechanisms to control the concentration of the two reactants. Superoxide dismutase (SOD, EC 1.15.1.1) is a group of isozymes functioning as superoxide radical scavenger in the living organisms. The reaction of SOD is as follows:

2H+ + 2 •O2_ ® H2O2 + O2

the produced hydrogen peroxide is then detoxified by catalase or peroxidase.

The expression of SOD genes is regulated both spatially and developmentally at least in maize (Zhu and Scandalios, 1993) and rice (unpublished data). SOD activity is also induced by diverse stresses (Bowler et al., 1992), presumably because of the increase in the concentration of superoxide radical in cells under those conditions. Obviously, SOD is an important enzyme family in living cells for maintaining normal physiological conditions and coping with stress. However, the study of SOD gene expression regulation at the end product level has been handicapped by the lack of a convenient method for quantifying the activity assay of the isozymes. Most of the work concerning SOD gene expression regulation has been based on RNA gel blot analysis. Little is known about the activity change of the SOD isozymes of plants in the developmental course and in response to stresses. SOD activity is commonly assayed spectrophotometrically, e.g., the method first defined by McCord and Fridovich (1969) and modified by Oberley and Spitz (1985). But it is both labor-intensive and time-consuming. We have developed a convenient technique for assaying the SOD activity by combining electrophoresis and densitometry and have called it the ED scheme. This technique is based on Beauchamp and Fridovich's method (1971), but is quantitative rather than qualitative. The ED scheme is more than ten times more efficient than the spectrophotometric

1Corresponding author. Fax: 886-2-3918940; E-mail: pan@ccms.ntu.edu.tw.


Botanical Bulletin of Academia Sinica, Vol. 37, 1996

method. The SOD activity of unknown samples can be derived from comparing with a SOD standard whose activity was measured by the spectrophotometric method. In addition to its efficiency, the technique can assay the activity of a single SOD isoform on the polyacrylamide gel and exclude the interference coming from non-SOD molecules in the tissue crude extract, which is not possible using the spectrophotometric method.

Materials and Methods

Nitroblue tetrazolium (NBT), diethylenetriamine pentaacetic acid (DETAPAC), xanthine and xanthine oxidase were purchased from Sigma. Riboflavin and tetramethylenediamine (TEMED) were purchased from Serva Chemical Company.

For the preparation of samples for the assay of SOD activity, 3 g of rice seedlings, tobacco and papaya young leaves were harvested and frozen with liquid nitrogen, ground into a fine powder, and then mixed with 3 ml of extraction buffer (0.15 M Tris, pH 7.5). The samples were centrifuged at 4°C, 14 k × g for 10 min. Centrifugation was repeated 2_3 times to clear all the debris. The supernatant was then transferred into microtubes, stored at -20 °C, and centrifuged again before use. SOD standard was a partially purified mungbean SOD obtained from the King Car Food Industrial Cooperation.

Electrophoresis was carried out at 4°C according to a modified procedure of Gabriel (1971) with 1.5 mm of 10% polyacrylamide mini-slab gel in standard tris-glycine buffer (pH 8.3). Samples were loaded into each well and then electrophoresed at 80 V through the stacking gel for 15 min and 120 V through the separating gel for 60 min. After electrophoresis, a modified photochemical method of Beauchamp and Fridovich (1971) was used to locate SOD activities on gels. The gel was first soaked in 25 ml of 1.23 mM NBT for 15 min, briefly washed, then soaked in the dark in 30 ml of 100 mM potassium phosphate buffer (pH 7.0) containing 28 mM TEMED and 2.8 × 10⁻² mM riboflavin for another 15 min. The gel was briefly washed again, and then illuminated on a light box with a light intensity of 30 mEm-2s-1 (measured by LI-COR LI 1000) for 15 min to initiate the photochemical reaction. All the procedures were carried out at room temperature, and the two soaking steps were shaken at 75 rpm.

The gel was scanned with a laser densitometer (Molecular Dynamics) immediately after the photochemical reaction. To measure the total SOD activity, each sample lane was individually framed with a suitable size rectangle when processing the image on the computer, ensuring that every SOD band of a lane fell into the rectangle. In addition to the sample rectangles, a number of blank rectangles were framed on the same gel for calibrating the background of the sample rectangles. The reading corresponding to the SOD activity in one sample rectangle could be calculated according to the formula: Reading of SOD activity = (average pixel reading of the blank rectangles) × (the pixel number of the sample rectangle) _ (the total

reading of the sample rectangle). The outcome represents a different degree of staining resulting from the total SOD activity of each sample. A single SOD isoform can be processed in a similar way by framing the location of the desired isoform as the sample rectangle.

Spectrophotometric assay of SOD activity was carried out by adapting the procedure of Oberley and Spitz (1985). For a 20-cuvette assay, the following reagents were added to a test tube: 13.8 ml of 50 mM potassium phosphate buffer (pH 7.8) containing 1.33 mM DETAPAC; 0.5 ml of 2.45 mM NBT; 1.7 ml of 1.8 mM xanthine. The total volume was 16 ml, enough to dispense 0.8 ml into each of the 20 cuvettes.

Cuvette holders in the sample chamber of the spectrophotometer were thermo-controlled at 25°C. For the blank test, 100 ml of 50 mM potassium phosphate buffer (pH 7.8) was added into a cuvette with 0.8 ml of working solution. A suitable concentration of xanthine oxidase was diluted, and 100 ml of it was added into the cuvette to initiate the reaction. A linear curve with a slope of 0.025 absorbance per min in time scan was obtained by adjusting the concentration of xanthine oxidase. The time scan lasted 5 min. The phosphate buffer was then replaced by a serial dilution of a SOD sample to obtain different decreased slopes, and each reaction was performed at least twice. At least three dilutions of a SOD sample were scanned in the defined reaction, one for the maximum competition (i.e., the lowest slope that could be obtained by adding the sample into the reaction), the other two were diluted to approach half of the maximum competition. The slope-sample amount data were then converted to a plot of slope against sample amount. Maximum competition (lowest slope) and a linear curve, including the point for the blank test, were the two elements in the plot. A regression function was obtained for the linear curve. The sample amount corresponding to half of the lowest slope was obtained through interpolating or extrapolating to the regression curve. One unit of SOD activity was defined as the amount of SOD which produced one half of the maximum competition against NBT in the specified system.

Results

The two-step soaking of the gel was followed by illumination. The soaking period, illumination duration, and light intensity were critical factors in developing the negative-stained bands of SOD isozymes. In order to save time while having well developed gels, the time course experiment was carried out for the two soaking steps and the illumination. The results indicated that 15 min for each soaking and illumination for 15 min with a light intensity of 30 mEm-2s-1 for photochemical reaction were suitable for the color development.

The ED scheme was demonstrated with four plant samples. As shown in Figure 1, the readings were proportional to the amount of enzyme preparations, and the curve of the partially purified mungbean SOD was used as a standard. The curve of mungbean SOD is linear below the


Chen and Pan — Assay of superoxide dismutase activity

reading of 1,300. Similar results were obtained for the other three samples, however, with a wider linear range.

Interferences, including possible endogenous SOD inhibitors and agents causing the reduction of NBT in the plant crude extract, could be removed by polyacrylamide gel electrophoresis. One of the interferences coming from non-SOD small molecules was detected as the smears at the bottoms of papaya and tobacco lanes (Figure 2). These

Table 1. Comparison of SOD activities of three plant samples assayed via the electrophoresis-densitometric method (ED scheme) and by the spectrophotometric method.

SOD activity (unit/ml)

Crude extract By ED scheme By the spectrophotometric method

Rice seedlings 2.08 1.19

Papaya leaves 2.48 2.03

Tobacco leaves 1.13 2.02

For each of the three samples, n = 6 on 6 gels assayed via the ED scheme. The readings obtained by densitometry were 1001.5 ± 87.44, 1066.5 ± 68.02, and 820.5 ± 59.39 (mean ± SD) for rice, papaya and tobacco, respectively. In the spectrophotometric method group, the assay was performed twice for each of the samples.

interferences could result in inaccurate readings of SOD activity in the spectrophotometric method. Comparisons of plant SOD activities measured with the ED scheme and the spectrophotometric method are shown in Table 1.

Discussion

SOD activity has been determined spectrophotometrically for over twenty years— ever since its function was first understood (McCord and Fridovich, 1969). Because superoxide radical is unstable, it is difficult to determine the activity of SOD by depending on the dynamic concentration of the substrate. Depending on the product level is also not feasible because hydrogen peroxide is also not stable in the presence of certain metal ions. Catalase and peroxidase existing in the tissue crude extract can also interfere with the result. In this spectrophotometric method, xanthine oxidase and xanthine were used to generate a superoxide radical flux, while cytochrome c functioned as a competitor against SOD on the superoxide radical and as a color indicator. Cytochrome c was later replaced by NBT because the result could be interfered with by some enzymes such as cytochrome oxidase and cytochrome peroxidase existing in the tissue crude extract (Beauchamp and Fridovich, 1971). The method is sensitive, but with some disadvantages. First, it is time-consuming. In eight hours of work, about four samples' SOD activity can be determined (five data points for the plot of slope against sample amount with each data point performed twice). Second, the activity of the diluted xanthine oxidase, which initiates the reaction, decreases during the work time, affecting the precision of the slope data from the time scan. The slope of the blank test in the assay, which measures the superoxide radical flux generated by the xanthine oxidase, is critical to obtaining the activity unit of a SOD sample. The lower the slope, the less the unit. The same effect was assumed to exist in the reactions when SOD samples were scanned. The final disadvantage of the traditional spectrophotometric method is that it cannot exclude possible molecules in the sample extract, which can interfere with the determination of the genuine activity of SOD, contributing to an incorrect estimation of the SOD activity.

Figure 1. Curves of densitometric readings corresponding to SOD activity against protein quantities of the four plant samples. The four samples were partially purified mungbean SOD, and crude extracts of rice seedlings, papaya, and tobacco leaves. After electrophoresis and SOD activity staining, the gels were scanned with a laser densitometer. The readings were obtained by processing the images. In the curve of mungbean SOD, for each data point n= 4, 8, 12, 12, 8, and 4 from low to high reading, respectively. All the data points in the curves of rice, papaya, and tobacco were performed four times in four polyacrylamide gels.

Figure 2. Electrophoresis and negative staining of SOD. Lane 1_5 are serial dilutions of partially purified mungbean SOD. Lane 4 and 5 are duplicated. Lane 6_8 are crude extracts of rice seedlings, papaya leaves, and tobacco leaves, respectively. At the bottom of papaya and tobacco lanes there are different light yellow smears, presumably caused by interference molecules in the crude extracts.


Botanical Bulletin of Academia Sinica, Vol. 37, 1996

The method using NBT as a superoxide radical competitor and a color indicator was also explored to qualitatively locate SOD on polyacrylamide gels at the time when cytochrome c was replaced by NBT. In the NBT negative staining system, after the gels have been soaked with NBT then riboflavin, exposing them to light causes the riboflavin to generate a superoxide radical flux in the presence of oxygen and TEMED. NBT and SOD in the gels compete for the superoxide radical at the same time. At the locations where SOD exists, the gel remains transparent, in contrast to those areas without SOD where the gel becomes purple-blue due to reduced NBT. Although the staining system was set up more than twenty years ago, it has not been modified and optimized to quantify SOD activity. Our experience and some reports showed the potential to modify the qualitative SOD staining system to quantify the activity of SOD. The isozymes of the SOD family can be separated by electrophoresis, their banding intensities are proportional to the loaded amount of SOD samples in fixed conditions, and the developed gels can be easily scanned with a laser densitometer. These three factors provided the basis for assaying the activity of the total or a single SOD isozyme on a gel with the ED scheme. Further more, in the mini-slab-gel system, to run four gels which have ten wells each at the same time is easy. This provided the efficiency for the technique. Loading a suitable quantity of sample in each well is a crucial first step in the ED scheme. If the sample is overloaded, some SOD isozyme with higher activity will be under-estimated due to the saturation effect. Thus, the loaded sample amount should fall into the linear range of both the standard curve and the sample curve. Because the curves of crude extracts showed a wider linear range than that of purified SOD due to the presence of more isozymes, readings of samples falling in the linear range of the standard curve prepared with a purified SOD are considered to be safe. However, the variation of the readings was also quite high when the loaded amount was low. In this work, the suitable range for the interpolation was between 300 and 1,300.

The intensity of SOD bands was affected by the 2-step soaking and illumination procedure. The longer the soak durations, the darker and blurrier the SOD bands. Some SOD minor bands disappeared due to a prolonged duration (40 minutes) of soak for each of the two steps. For reasons that are still unclear, different SOD isozymes were observed to have a different resistance to the soaking effect (data not shown).

In the illumination step, the light intensity of the light box is very important. A high light intensity causes a great output of superoxide radical flux from the riboflavin and TEMED, resulting in a rapid darkening of the gel. Therefore, all bands might disappear under high light intensities. Low light intensities are less effective in color development and require more time;moreover, they are suseptible to interference from an environmental light source. Accordingly, 30 mEm-2s-1 was determined to be suitable for the illumination.

In the densitometry, 100 micron per pixel size and 12 bits of digital resolution in the scanning system were used. The sample lanes were framed as small as possible. The background of the gels were not even especially at the marginal area of the gel, potentially contributing to a variation in the readings. Ideally, blank frames should be located on the upper and lower parts of the lanes to give a better representation of the background. It is not known whether exposing the gel to the laser beam during the scanning causes change to the staining. Nevertheless, few gels needed to be scanned twice.

Theoretically, measurement by interpolation to a standard curve would not obtain the true values of the samples. But it is convenient to show the relationship. The SOD activity of rice seedling crude extract assayed via the ED scheme was higher than that by using the spectrophotometric method, presumably because the superoxide radical flux in the two methods is different. Crude extract of papaya leaves showed a similar situation but with closer values. Crude extract of tobacco leaves, in contrast, showed a different picture. Electrophoretic patterns showed that there were light yellow smears, presumably interference molecules, at the bottom of the tobacco lane and to a lesser extent in the papaya lane, while such a phenomenon was unobserved in the rice lane. Activity assay with the spectrophotometric method showed that the crude extract of tobacco leaves was able to increase the absorbance in the reaction system in enzymatic and nonenzymatic ways without the addition of xanthine oxidase. This suggested that some molecules in the crude extract could initiate the superoxide radical generation system. Extract from papaya leaves showed a similar situation, but to a lesser extent while no such reaction was observed in rice seedling extract (data not shown). The two cases indicated that the crude extract of tobacco leaves contained the largest amount of interfering substances in the three samples, resulting in the largest over-estimation of the SOD activity by the spectrophotometric method, followed by the crude extract of papaya leaves. Rice seedlings contained few interfering substances in the SOD activity assay, resulting in minimal over-estimation. In the spectrophotometric method, these interferences were added to the genuine SOD activity.

The expression of SOD genes are involved in many life aspects including developmental course and in response to environmental stress. Most work on understanding the expression regulation of SOD genes based on RNA gel blot analysis has suffered from the lack of a convenient method to assay SOD activity. With the ED scheme, not only the total SOD activity but also the activity of a single isozyme can be determined efficiently. This technique can provide researchers with an eye to see how a SOD gene is expressed at the enzyme activity level.

Acknowledgments. This work was supported in part by the National Science Council of the Republic of China, under Grant No. NSC 83-0211-B-002-293. The authors are grateful to Dr. Chia-Yin Tsai for helpful discussion and critical review of this manuscript.


Chen and Pan — Assay of superoxide dismutase activity

Literature Cited

Beauchamp, C. and I. Fridovich. 1971. Superoxide dismutase: Improved assays and an assay applicable to acrylamide gels. Anal. Biochem. 44: 276_287.

Bowler, C., M. Van Montagu, and D. In'ze. 1992. Superoxide dismutase and stress tolerance. Annu. Rev. Plant Physiol. Plant Mol. Biol. 43: 83_116.

Gabriel, O. 1971. Analytical disc gel electrophoresis. In W.B. Jakoby (ed.), Methods in Enzymology, vol 22. Academic Press, New York, pp. 565_577.

McCord, J.M. and I. Fridovich. 1969. Superoxide dismutase: an

enzymic function for erythrocuprein (hemocuprein). J. Biol. Chem. 244: 6049_6055.

Mehdy, M.C. 1994. Active oxygen species in plant defense against pathogens. Plant Physiol. 105: 467_472.

Oberly, L.W. and D.R. Spitz. 1985. Nitroblue Tetrazolium. In R.A. Greenwald (ed.), CRC Handbook of Methods for Oxygen Radical Research. CRC Press, Boca Raton, pp. 217_220.

Zhu, D. and J.G. Scandalios. 1993. Maize mitochondrial manganese superoxide dismutases are encoded by a differentially expressed multigene family. Proc. Natl. Acad. Sci. USA 90: 9310_9314.