Bot. Bull. Acad. Sin. (1996) 37: 133-140

Shiah et al. — Light effect on phytoplankton photosynthetic

Light effects on phytoplankton photosynthetic performance in the southern East China Sea north of Taiwan

Fuh-Kwo Shiah1,2,4, Gwo-Ching Gong3, and Kon-Kee Liu1,2

1Global Change Research Center, National Taiwan University, Taipei, Taiwan, Republic of China

2Institute of Oceanography, National Taiwan University, Taipei, Taiwan, Republic of China

3Department of Oceanography, National Taiwan Ocean University, Keelung, Taiwan, Republic of China

(Received October 28, 1995; Accepted February 28, 1996)

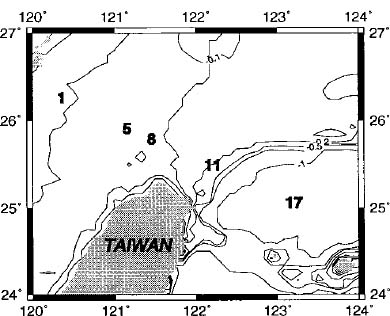
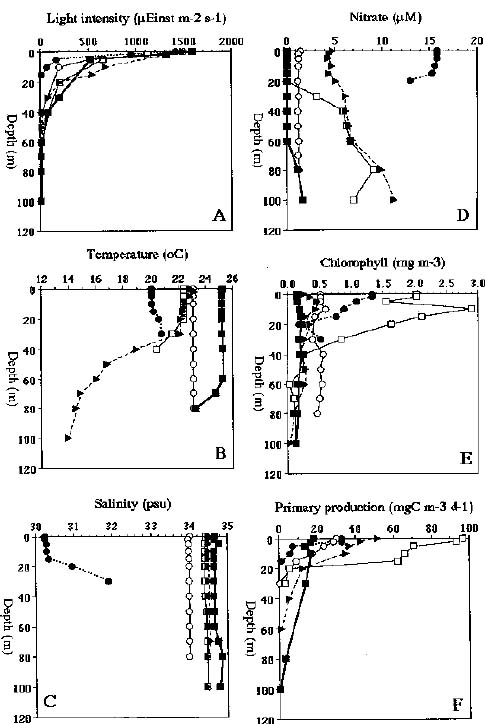
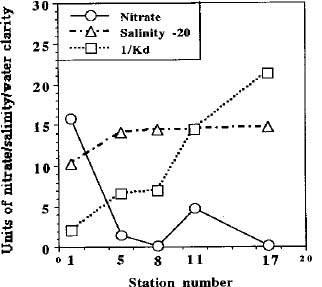
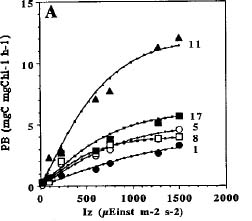
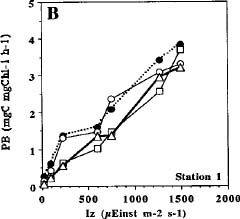
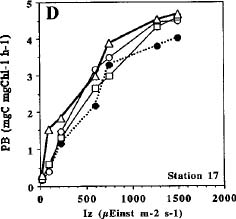
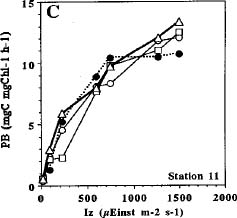
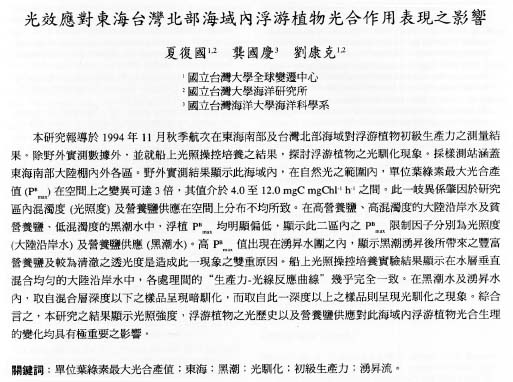
Abstract. Phytoplankton primary production was measured in different regions in the southern East China Sea north of Taiwan in the fall of 1994. Light-manipulation experiments were also performed on-board to study the photoacclimation of phytoplankton assemblages. The sampling stations encompassed the inner and outer shelf of the southern East China Sea. Field observation showed that the in situ maximal chlorophyll-normalized photosynthetic rates (PBmax) varied 3-fold among stations, ranging from 4.0 to 12.0 mgC mgChl-1 h-1. The low PBmax values recorded in the nutrient-laden coastal water and the oligotrophic Kuroshio water could be ascribed to high turbidity and low nutrient availability, respectively. The highest PBmax observed in the upwelling plume station probably could be ascribed to both copious nutrient supply by upwelling processes and higher light availability. Light-manipulation experiments showed that in the well-mixed coastal water, the light response curves for samples taken from different depths of the euphotic zone were very similar. In both the upwelling region and the Kuroshio water, phytoplankton assemblages living below the mixed-layer depth were shade-acclimated while those living above that depth were light-acclimated. Overall, our results indicate that photosynthetic available radiance, light history and nutrient availability are crucial in controlling the spatial variation of algal photosynthetic performance in the study area.

Keywords: Assimilation number; East China Sea; Kuroshio; Photoacclimation; Primary production; Upwelling.

Introduction

Studying the temporal and spatial variability of primary production and the factors that control them is essential in understanding the biogeochemical cycle of carbon in the ocean (Knauer, 1991; Longhurst and Harrison, 1989). The assimilation number (i.e. Pmax; mgC mgChl-1 h-1) at optimum (saturating) light intensity, has been a widely-accepted index for the study of phytoplankton physiology and ecology (for review, see Cullen et al., 1992). Light intensity has been recognized as the most basic factor in controlling Pmax.

Many models have been proposed to analyze the effect of light on photosynthesis (Frenette et al., 1993 and citations therein). One of the most extensively used models is that dealing with the chlorophyll-normalized photosynthesis rate vs. light intensity below the onset of photoinhibition (i.e. PB - I curve without photoinhibition term; Jassby and Platt, 1976). This model is expressed as: PB = (Pmax) × tanh (A × Iz/Pmax), where PB (mgC mgChl-1 h-1) is the chlorophyll normalized photosynthetic rate; Iz, the light intensity (mEinst m-2 s-1) at depths z and A (mgC mgChl-1 h-1 mEinst m-2 s-1), the initial slope of the PB - I curve. However, the PB - I curve and values of Pmax change with seasons and locations and even covary with other environmental factors such as nutrients and temperature. For

example, Pmax for marine phytoplankton varies more than 100-fold, ranging from 0.2 to 40.0 mgC mgChl-1 h-1 (Harrison and Platt, 1980). Therefore, study of the seasonal and temporal variations of the empirical PB - I curves is essential for choosing an appropriate model in a given area. Furthermore, these empirical PB - I curves are very important in developing bio-optical models which can then be combined with the ocean color remote sensing technique to estimate primary production from satellite images (Balch et al., 1989; Morel, 1991; Platt and Sathyendranath, 1993).

Unlike higher plants, marine phytoplankton can not remain fixed in space with respect to a light field. As a result of turbulence, phytoplankton cells may experience large variations in light intensity over the course of a day. Considering the light regimes experienced by phytoplankton in natural waters, first-order variations in the light regimes are influenced by the path of the sun (i.e. the diurnal photoperiod). Second-order variations are affected by the vertical displacement of cells in the water column. Many species of phytoplankton adjust their cellular chlorophyll content and modify their photosynthesis-irradiance curves in response to second-order variations in the light regimes. This phenomenon is known as photoacclimation or light-shade acclimation.

Primary production in the southern East China Sea and the Kuroshio areas has been studied by several workers (Shiah et al., 1995 and citations therein). However, avail

4Corresponding author. Fax: 886-2-363-2583.


Botanical Bulletin of Academia Sinica, Vol. 37, 1996

able information concerning light effects on phytoplankton assemblages is rare, either in terms of physiology (i.e. photoacclimation) or ecology (i.e. spatial and temporal distribution of Pmax). To investigate phytoplankton photosynthetic performance from these perspectives, we conducted a cruise survey in Nov. 1995 in the southern East China sea north of Taiwan. The empirical PB - I curves derived from different regions were compared to analyze the possible mechanisms controlling the spatial distribution pattern of Pmax. Photoacclimation was examined by performing on-board light-manipulation experiments.

Materials and Methods

This study was performed at the five stations in the southern East China Sea north of Taiwan (Figure 1) during Nov. 1994. Seawater was collected from a SeaBird CTD-General Oceanic Rosette assembly with 20-liter Go-Flo bottles. Temperature and salinity profiles were also recorded simultaneously. Light intensity was measured with a light meter (PAR sensor; QSP200L; Biospherical Inc.) installed on the research vessel. The ratios of surface light intensity (i.e. Io) to light intensity at known depths (i.e. Iz) were recorded, and log Iz/Io values were plotted as a function of depth. Sampling depths were determined from the light extinction plots and corresponded to 100, 85, 50, 40, 15, 6, and 1% of Io. Light-extinction coefficients (i.e. Kd) were calculated by the equation Iz = Io × e-Kd × z and the reciprocal of Kd (i.e. 1/Kd) was used as an analog of water clarity (Parsons et al., 1984). The depth of the euphotic zone was defined as 1% of the surface light penetrated. All the measurements described below were conducted before dawn with samples taken from the same cast. Temperature profile in each station was used to determine the depth of the mixed layer where its temperature was 0.5°C lower than the surface temperature (Levitus, 1982).

Primary production was measured by the 14C assimilation method (Parsons et al., 1984, for details see Shiah et al., 1995). In brief, three light and one dark 250 ml clean polycarbonate bottles were filled with water which was pre-screened through 200 mm mesh to remove large zooplankton and detritus and then inoculated with H14CO3- (final concs. 10 mCi ml-1). One light bottle was filtered immediately as the time-zero sample. The other two light bottles from each depth were covered with different screens to simulate the degree of the light penetration at that particular depth. The relationship between screens and Iz/Io was determined in the laboratory. 14C-inoculated samples were incubated on deck and cooled with running seawater from dawn to dusk. For light manipulation experiments, water samples collected from four depths which Iz/Io = 80, 40, 15 and 1% at stations 1, 11 and 17 were incubated on deck from dawn to dusk under simulated Iz/Io of 100, 85, 50, 40, 15, 6, and 1% respectively after the inoculation of H14CO3_. Two light bottles and one dark one (250 ml) were used for each treatment.

Following retrieval at dusk, the bottles were stored in the dark and processed immediately. The water samples were filtered through Whatman 25 mm GF/F filters. Pumping pressure was maintained below 100 mmHg to prevent the possible damage of cells. The filters then were placed in scintillation vials and 0.5 ml of 0.5 N HCl was added to remove residual H14CO3-. Radioactivity was counted in a liquid scintillation counter (PACKARD 1600) after addition of 10 ml scintillation cocktail into vials. The production index (PB; mgC mgChl-1 h-1) was calculated by dividing primary production with chlorophyll a concentrations and the incubation period (12 h).

The model proposed by Jassby and Platt (1976) was used to analyze the relationship between PB and light intensity (for reasons presented in the Discussion section). However, we substituted the Pmax term in their formula with PBmax which represented the maximal chlorophyll normalized photosynthetic rates obtained under natural light conditions instead of the true maximal assimilation number. Because of the limited intensity of natural light photosaturation may not be achieved during incubation. By contrast, most incubation experiments for the PB-I curve analysis were performed under artificial light sources. The major advantage of the latter method is that the PB values above the maximal daylight intensity can be detected.

Chlorophyll a and nitrate concentrations were measured following the methods of Parsons et al. (1984). Water samples for nutrients analysis were subsampled with clean 100 ml polypropylene bottles and were frozen immediately with liquid nitrogen. Nitrate was analyzed with a self-designed flow injection analyzer (Gong, 1992) and was reduced to nitrite with a cadmium wire activated with a copper sulfate solution. For chlorophyll measurements, 2.5 liters of seawater were filtered through 47 mm Whatman GF/F filters then stored immediately at -20°C. Back at the laboratory, the filters were ground in 10 ml 90% acetone followed by extraction in a 4°C shaking in

Figure 1. Map of the southern East China sea north of Taiwan showing sampling stations. Bottom depths are in the unit of km.


Shiah et al. — Light effect on phytoplankton photosynthetic

cubator for 2 h. After centrifugation at 1,000 rpm for 5 min, concentrations of chlorophyll in the supernatant were measured on a Turner fluorometer (model 10-AU-005).

Results

The sampling stations encompassed the inner and outer shelf of the southern East China sea. Averaged, daily, surface light intensities varied from 1,415 to 1,590 mEinst m-2 s-1 during the study period (Table 1). Light intensity decreased exponentially with depth (Figure 2A), and the light extinction coefficients (i.e. Kd) decreased from station 1 to station 17, ranging from 0.467 m-1 to 0.047 m-1 (Table 1). The depth of the euphotic zone was very shallow (i.e. < 15 m) at station 1 and increased to 90 m at station 17 (Table 1). Temperature was distributed quite differently among stations, both horizontally and vertically (Figure 2B). The lowest and highest sea surface temperatures were recorded at stations 1 and 17, with values of 20 and 25 °C, respectively. Temperature profiles showed that the water column was well mixed at stations 1 and 5. Mixed-layer depths at stations 11 (40 m) and 17 (70 m) were about 20 m shallower than the corresponding euphotic zone depths. Salinity increased from station 1 to station 17 with values of 30.240 to 34.674 psu (practical salinity units), respectively (Figure 2C). The highest nitrate (i.e. NO3-) concentrations were recorded at station 1 with values >15.0 mM in the upper 15 m (Figure 2D). The upper water column at stations 8 and 17 was depleted of NO3- with nitroclines located at 20 and 60 m, respectively. NO3- was distributed homogeneously throughout the euphotic zone at stations 5 and 11, with values of 1.2_1.5 mM and 4.3_ 6.8 mM, respectively. Figure 3 shows that the physical and chemical properties in these five sampling stations were quite distinct. Station 1 was typical coastal water characterized by high NO3- concentrations and low water clarity and salinity. On the other hand, stations 8 and 17 represented typical oligotrophic oceanic waters with high salinity (> 34.400 psu) and water clarity. The copious NO3- concentrations observed in the surface water at station 11 indicated that there was a source of nutrient supply via upwelling processes in this area (Liu et al., 1992). The water of station 5 was probably a mixture of the coastal

Figure 2. Vertical profiles of measured variables in the study area. Station 1, solid circles; station 5, open circles; station 8, open squares; station 11, solid triangles, and station 17, solid squares.

Table 1. List of physical and biological variables@ measured within the euphotic zone.

Items units St. 1 St. 5 St. 8 St. 11 St. 17

Io mEinst/m2/sec 1,415 1,494 1,500 1,500 1,590

Kd m-1 0.467 0.152 0.143 0.069 0.047

Ze m 15 30 30 60 90

Zm m > 20 > 40 40 40 70

SChl. mg/m2 7.6 11.9 52.2 28.2 18.6

SPP mgC/m2/d 142 361 1,410 1,344 402

@, Io: mean daily surface light intensity; Kd: light extinction coefficient; Ze: depth of the euphotic zone (i.e. 1% Io); Zm: depth of mixed layer; SChl.: euphotic zone integrated chlorophyll concentrations and SPP: euphotic zone integrated primary production.

Figure 3. Surface water nitrate concentrations (mM), salinity (psu), and water clarity index (1/Kd) among sampling stations. Note that the actual value of salinity in the y-axis should plus 20 psu.


Botanical Bulletin of Academia Sinica, Vol. 37, 1996

and the oligotrophic oceanic waters, as indicated by the intermediate salinity, turbidity, and NO3- concentrations.

Chlorophyll concentrations (i.e. Chl; 0.12 _ 2.91 mg m-3) varied more than 20-fold among stations (Figure 2E). Subsurface Chl maxima occurred at all stations except station 1, where Chl decreased with depth. The highest euphotic-zone, integrated Chl concentration (i.e. SChl; 52 mg m-2) was observed at station 8, whereas the values of SChl at stations 1, 5, and 17 were all less than 19 mg m-2 (Table 1). Depth profiles of primary production (i.e. PP) showed similar trends (Figure 2F). They were high in the surface water and then decreased with depth down to the bottom of the euphotic zone. PP in the surface water varied less than 9-fold with the highest and the lowest values recorded at stations 8 (92.9 mgC m-3 d-1) and 17 (10.2 mgC m-3 d-1), respectively. The highest and the lowest euphotic-zone, integrated PP were observed at stations 8 and 1, with values of 1,410 and 142 mgC m-2 d-1, respectively (Table 1).

The PB - I curves of the field data are shown in Figure 4A. All the values of PB were positively correlated with light intensity, with no sign of light inhibition at higher light intensity. Table 2 summarizes the values of PBmax and the initial slopes calculated by fitting the data with the Jassby and Platt (1976) model. Linear regression analysis showed that the model values derived from the Jassby and Platt (1976) model fitted the observed data very well with coefficients of determination > 0.98 (n=14, p < 0.01). Station 11 had the highest PBmax (12.0 mgC mgChl-1 h-1) while the PBmax of stations 1, 5, 8 and 17 were low with values ranging from 3.0 to 5.0 mgC mgChl-1 h-1. The initial slope derived from station 11 (0.015 mgC mgChl-1 h-1 mEinst m-2 s-1) was two to five times higher than those at the other stations.

Figures 4B-D show the responses of phytoplankton PB to varied light intensities in the light-manipulation experiments conducted at stations 1, 11, and 17, respectively. At all three sampling stations, PB changed proportionally with light intensity in all treatments and showed no sign of light inhibition at higher light intensities. For convenience, the four treatments within each station are designated LM-80%, LM-40%, LM-15%, and LM-1% treatments hereafter. The values of PBmax for the treatments at station 1 were very similar to each other (Figure 4B and Table 2), indicating that the physiological status (i.e. light

Figure 4. The PB - I curves of the field data (A) and the light-manipulation experiments performed in station 1 (B), 11 (C) and 17 (D). For the field data, line for each station represents model output (Jassby and Platt, 1976) and the symbols for sampling stations are the same as Figure 2. For (B) - (D), open triangles, open squares, open circles and solid circles represent the LM-80%, LM-40%, LM-15% and LM-1% treatments, respectively.

history) of the phytoplankton assemblages at different depths within the euphotic zone were nearly identical. At station 11, PB were much the same among the treatments at lower light intensities (i.e. < 750 mEinst m-2 s-1), but started to diverge above that (Figure 4C). For example, PB of the LM-1% treatment saturated at 750 mEinst m-2 s-1 with a value of 10.4 mgC mgChl-1 h-1 while PB of the other three treatments were still increasing above that light intensity. The PB - I curves of station 17 followed the same trend as station 11 (Figure 4D). Table 2 shows that at both stations 11 and 17, the model value of PBmax of the LM-1% treatment was lower than the other three treatments. These indicated that phytoplankton assemblages living in the deep water (i.e. the bottom of the euphotic zone) at these two stations were shade-acclimated.

Table 2. A comparison of the in situ maximal chlorophyll normalized photosynthetic rates (PBmax; mgC mgChl-1 h-1) and initial slope (values in parenthesis; mgC mgChl-1 h-1 mEins-1 m-2 s-1) among sampling stations. na, data not available.

Items St. 1 St. 5 St. 8 St. 11 St. 17

Spring@ Field 3.6 (na) na 8.3 (na) 14.0 (na) 4.8 (na)

Fall Field 3.0 (0.0030) 5.0 (0.005) 4.0 (0.006) 12.0 (0.015) 5.0 (0.0065) LM 80% 3.0 (0.0023) na na 12.5 (0.020) 4.5 (0.0065)

LM 40% 3.5 (0.0023) na na 12.0 (0.015) 4.5 (0.005)

LM 15% 3.0 (0.0028) na na 12.0 (0.015) 4.5 (0.006)

LM 1% 3.5 (0.0030) na na 10.0 (0.018) 3.5 (0.0045)

@From Shiah et al. (1995).


Shiah et al. — Light effect on phytoplankton photosynthetic

Discussion

Field Data and Modeling

Our results show that the non-photoinhibition model proposed by Jassby and Platt (1976) was applicable in the study area, at least during the investigation period and under natural light conditions (Figure 4A). The inhibition of PB at higher light intensity probably is not a very common phenomenon in this area, although it has been observed frequently in many aquatic ecosystems (see Frenette et al., 1993 for review). A field survey conducted in the same area also revealed that photoinhibition did not occur in the spring (Shiah et al., 1995). However, this does not necessarily mean that a photoinhibition effect does not exist since the conclusions we have arrived at were based on data from only two cruises. Note also that instead of using an artificial light source, we incubated the samples under natural light intensities which ranged from 1,415 to 1,590 mEinst m-2 s-1 (Table 1). Consequently, the photoresponse at higher light intensity (i.e. > 1,600 mEinst m-2 s-1) could not have been detected. In the following sections, we discuss only how light and nutrient availability affect PBmax. The possible effects of temperature and phytoplankton species composition on PBmax are not included due to limited data.

When comparing field data of this study with those published by Shiah et al. (1995), we found that there seemed to be a fixed spatial pattern of PBmax within the study area (Table 2). That is, values of PBmax were low at stations 1, 8, and 17 but high at station 11 during spring and fall. Some strong evidence indicated that turbidity (light availability) and nutrient supply, interactively affected the spatial variability of PBmax. Station 1 is very shallow (bottom depth 30_35 m) and close to the coast of the Chinese mainland. Large amounts of detritus input from river discharges might result in very low water clarity in this area. In addition, a semi-diurnal internal tide with an amplitude of 40 m has been reported by Chern and Wang (1990) in the study area, suggesting that the high turbidity at station 1 could also be ascribed to high sediment resuspension. We propose that the low PBmax observed at station 1 might due to low light availability (Figure 3), although the effect of lower temperature should be also considered (Figure 2B). Nutrient availability was probably the major factor leading to the low PBmax at stations 8 and 17, where nitrate was depleted throughout the euphotic zone (Figure 2D). Station 11 was very close to the edge of the continental shelf (Figure 1) where the upwelling of the Kuroshio subsurface water occurs (Liu et al., 1992 and citations therein). The highest PBmax, observed at station 11, might have resulted from a copious supply of nutrient provided by upwelling processes and a higher light availability, simultaneously (Figure 3). At station 5, the nutrient-laden, turbid coastal water mixed with the oligotrophic and clear oceanic water. This might result in intermediate water clarity, nutrient availability (Figure 3), and thus intermediate PBmax value.

The distinct PBmax values recorded at stations 8 (4.0 mgC mgChl-1 h-1) and 11 (12.0 mgC mgChl-1 h-1) probably could

be explained by the "conveyor-belt" hypotheses which has been proposed to illustrate the production cycle of phytoplankton along the axis of the upwelling plume (Wilkerson and Dugdale, 1987; Dugdale and Wilkerson, 1989). In brief, this hypotheses states that newly upwelled phytoplankton near the upwelling center are growing and taking up nutrient slowly (i.e. shift-down). As the algae adapt to the high light downstream, both growth rates (i.e. PBmax) and biomass increase (i.e. shift-up). At the margin of the upwelling plume, the growth of phytoplankton may shift-down due to the depletion of nutrient. Judging from the NO3- profiles (Figure 2D) and the low PBmax value, we deduce that station 8 was located at the margin of the upwelling plume and phytoplankton metabolic activities were in shift-down status. On the other hand, given its high PBmax value, station 11 probably was adjacent to, but not located at the center of the upwelling plume.

Light-Manipulation Experiments

It is well known that physiological acclimation to changes in light intensity is an important factor determining variation in photosynthetic responses and growth rates of phytoplankton in nature (for review, see Falkowski and LaRoche, 1991). As mentioned previously, phytoplankton assemblages might experience two light regimes in the field, namely, a diurnal photoperiod and a vertical light intensity gradient caused by mixing (i.e. photoacclimation). The effects of light intensity on the latter process can not be detected by the field data due to the unavoidable limitations of the incubation technique. More specifically, we were not able to simulate a vertical light intensity gradient since samples were incubated in bottles at their corresponding light intensity only. Depth profiles of PB, which showed the expression of photosynthetic performance under in situ conditions, did not tell much about the actual physiological potential of phytoplankton assemblages living at different depths in the euphotic zone. Thus, it is necessary to perform light-manipulation experiments in which samples taken from different depths of the euphotic zone are incubated under varied ambient light intensities.

Many researches have pointed out that stratification (i.e. vertical mixing) may have a strong impact on photoacclimation (Falkowski, 1983; see also Hood, 1995 for review). Consider a vertical mixing process that displaces phytoplankton assemblages on a time scale longer than the time it takes for them to become adapted to the difference in light regimes between depths z and z1. If phytoplankton assemblages manifest some characteristic of acclimation to light, vertical variations in this characteristic would reflect the light history of phytoplankton assemblages at depth z, and would be nonuniformly distributed vertically because of a new characteristic associated with the light regime at depth z1. Shade acclimated algae are often characterized by having lower PBmax than light acclimated cells (Falkowski, 1981, see his fig. 5). On the other hand, if the mixing time is faster than the time required for photoacclimation, then the vertical distribution of the light-dependent physiological characteristics


Botanical Bulletin of Academia Sinica, Vol. 37, 1996

would be more uniformly distributed. Table 1 shows that the mixed-layer depths (i.e. Zm) at stations 11 and 17 were about 20 m shallower than their corresponding euphotic zone depths (i.e. Ze), indicating that the deep-water phytoplankton assemblages in these two water masses were shade-acclimated due to the thermocline barrier.

Figure 4C has important ecological and physiological implications for phytoplankton living in the upwelling area. The upward water movement at station 11 (upwelling velocity, 5 m d-1; Liu et al., 1992) might keep bringing deep water phytoplankton assemblages towards the surface. One might expect a homogeneous pattern of PB - I curves for phytoplankton living above the mixed-layer (or even within the whole euphotic zone) since the strength of stratification might be weakened by the upwelling. But our results showed that it was not the case. Such an abrupt change of the PB - I curves from deep to surface water implied a switch of the light-response strategy of the phytoplankton assemblages living in the upwelling area. That is, they were shade-acclimated in the deep water and then became light-acclimated when moving toward the surface water. Nutrient supply probably played no role in affecting the magnitude of the photoacclimation (see below) since nitrate concentrations were high within the whole euphotic zone (Figure 2D). In the surface layer, the phytoplankton assemblages spread outward by water movement and changed their photosynthetic performance through the influence of nutrient availability along the axis of the upwelling plume (conveyor-belt theory).

At each station, the PBmax values derived from the light manipulation experiments were very similar to the PBmax of the field data (Table 2), which were limited either by water clarity or nutrient availability. Many experiments have demonstrated that nitrate availability may constrain and modify the photoacclimation response (Chalup and Laws, 1990 and citations therein). Figure 2D showed that nitrate was depleted in the upper 60 m at station 17, suggesting that the upper limit of light acclimation above the mixed layer at this station probably was fixed by nutrient availability. On the other hand, station 1 was very shallow (bottom depth, 30 m) and its Zm was deeper than its Ze. Rates of vertical mixing in such environments could be greatly enhanced by the actions of waves and tides. Therefore, similar PB - I curves were expected among the treatments of the light manipulation experiments (Figure 4B). The similarity between manipulation data and the depth profiles once again demonstrated that water clarity was the major factor in limiting phytoplankton photosynthetic performance at this nutrient-laden coastal station, either in terms of diurnal photoperiod or photoacclimation.

Conclusions

In this study, we examined light effects on phytoplankton photosynthetic performance from ecological and physiological perspectives. Results from the field survey indicate that the spatial distribution pattern of PBmax in the study area can be ascribed to its distinct physical and

chemical characteristics, including light and nutrient availability. Research on the spatial pattern of PBmax during other seasons is definitely required to give a full picture of the empirical PB - I relationship at different temporal and spatial scales. These are important in understanding mechanisms controlling the carbon cycling and fluxes on the continental shelf of the southern East China Sea. In addition, this information will be very useful for the future development of bio-optical models and ocean-color remote sensing in estimating primary production from satellite images. Light-manipulation experiments suggest that phytoplankton assemblages living beneath the mixed layer in the region outside the shelf are shade-acclimated, whereas those in the upper part of the euphotic zone are light-acclimated. In the shallow turbid coastal water, the uniform PB - I curves observed throughout the euphotic zone can be ascribed to the fast mixing rate in the coastal area. Overall, these ecological and physiological data are very helpful in clarifying the horizontal and vertical changes of algal photosynthetic performance in the different areas of the southern East China Sea north of Taiwan.

Acknowledgments. This research was supported by grant from the NSC84-2811-M002-030. Support for Dr. F. -K. Shiah was provided by the NSC postdoctoral fellowship. We thank the officers and crew of R/V Ocean Researcher I and Ms. J. S. Ku for cruise assistance and sample analysis.

Literature Cited

Balch, W. M., R. W. Eppley, and M. R. Abbott. 1989. Remote sensing of primary production II: a semi-analytical algorithm based on pigments, temperature and light. Deep-Sea Res. 36: 1201_1217.

Chalup, M. S. and E. A. Laws. 1990. A test of the assumptions and predictions of recent microalgal growth models with the marine phytoplankter Pavlova lutheri. Limnol. Oceanogr. 35: 583_596.

Chern, C.-S. and J. Wang. 1990. On the mixing of waters at a northern offshore area of Taiwan. Terrest. Atmosp. Ocean Sci. 1: 297_306.

Cullen, J. J., X. Yang, and H. L. MacIntyre. 1992. Nutrient limitation of marine photosynthesis. In P. G. Falkowski and A. D. Woodhead (eds.), Primary Productivity and Biogeochemical Cycles in the Sea, N.Y., Plenum, pp. 69_88.

Dugdale, R. C. and F. P. Wilkerson. 1989. New production in the upwelling central at Point Conception, California: temporal and spatial patterns. Deep-Sea Res. 36: 985_1007.

Falkowski, P. G. 1981. Light-shade adaptation and assimilation numbers. J. Plankton Res. 3: 203_216.

Falkowski, P. G. 1983. Light-shade adaptation and vertical mixing of marine phytoplankton: a comparative field study. J. Mar. Res. 41: 215_237.

Falkowski, P. G. and J. LaRoche. 1991. Acclimation to spectral irradiance in algae. J. Phycol. 27: 8_14.

Frenette, J., S. Demers, L. Legendre, and J. Dodson. 1993. Lack of agreement among models for estimating the photosynthetic parameters. Limnol. Oceanogr. 38: 679_687.

Gong, G. C. 1992. Chemical Hydrography of the Kuroshio Front


Shiah et al. — Light effect on phytoplankton photosynthetic

in the Sea Northeast of Taiwan. Ph. D. Thesis, National Taiwan University, 240 pp.

Harrison, W. G. and T. Platt. 1980. Variations in assimilation number of coastal marine phytoplankton: effect of environmental co-variates. J. Plankton Res. 2: 249_260.

Hood, R. R. 1995. Light response of phytoplankton in the south Atlantic ocean: interpretation of observations and application to remote sensing. J. Geophys. Res. 100: 10927_10942.

Jassby, A. D. and T. Platt. 1976. Mathematical formulation of the relationship between photosynthesis and light for phytoplankton. Limnol. Oceanogr. 21: 540_547.

Knauer, G. A. 1991. Productivity and new production of the oceanic system. In R. Wallast, F. T. Mackenzie, and L. Chou (eds.), Interactions of C, N, P and S Biogeochemical Cycles and Global Change, N.Y., Springer-Verlag, pp. 211_232.

Levitus, S. 1982. Climatological Atlas of the World Ocean (ed.). NOAA Professional Paper, 173 pp.

Liu, K., G. Gong, C. Shyu, S. Pai, C. Wei, and S. Chao. 1992. Response of Kuroshio upwelling to the onset of northeast monsoon in the sea north of Taiwan: observations and a numerical simulation. J. Geophys. Res. 97: 12511_12526.

Longhurst, A. R. and W. G. Harrison. 1989. The biological pump: profiles of plankton production and consumption in the upper ocean. Prog. Oceanog. 22: 47_123.

Morel, A. 1991. Light and marine photosynthesis: a spectral model with geochemical and climatological implications. Prog. Oceanog. 26: 263_306.

Parsons, T. R., Y. Maita, and C. M. Lalli. 1984. A Manual of Chemical and Biological Methods for Seawater Analysis. N.Y., Pergamon Press, 173 pp.

Platt, T. and S. Sathyendranath. 1993. Estimators of primary production for interpretation of remotely sensed data on ocean color. J. Geophys. Res. 98: 14561_14576.

Shiah, F., G. Gong, and K. Liu. 1995. A preliminary survey on primary productivity measured by the 14C assimilation method in the KEEP area. Acta Oceanogr. Taiwanica 34: 1_16.

Wilkerson, F. P. and R. C. Dugdale. 1987. The use large shipboard barrels and drifters to study the effects of coastal upwelling on phytoplankton nutrient dynamics. Limnol. Oceanogr. 32: 368_382.


Botanical Bulletin of Academia Sinica, Vol. 37, 1996