Bot. Bull. Acad. Sin. (1996) 37: 173-180

Gang and Weber — Genetic variability in wheat smut (Tilletia)

Using random amplified polymorphic DNA to analyze the genetic relationships and variability among three species of wheat smut (Tilletia)

David R. Gang1 and Darrell J. Weber2

Department of Botany and Range Science, Brigham Young University, Provo, Utah 84602, USA

(Received November 17, 1995; Accepted April 9, 1996)

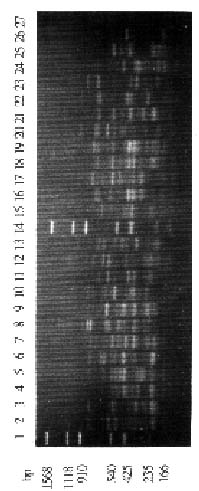
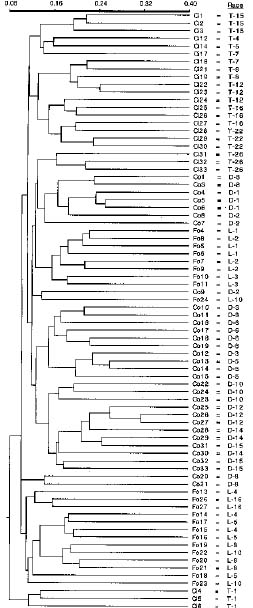
Abstract. Covered smut or bunt of wheat, caused by Tilletia caries, T. foetida (T. laevis), and dwarf bunt, caused by T. controversa, are significant pathogens of wheat. However, the molecular and genetic make-ups of these fungi have not been studied extensively. The extremely long time required to germinate the Tilletia controversa teliospores, their thick walls and high lipid content have discouraged extensive genetic analyses of the fungi by methods such as RFLP or RAPD. We recently developed a method to extract genomic DNA from the thick-walled teliospores of Tilletia. This method was used to extract the genomic DNA from 90 smut samples. The average Tilletia DNA yield per infected wheat head was significantly different for T. controversa as compared to T. caries and T. foetida (T. laevis). RAPD reactions were performed with the 90 Tilletia individuals and 13 random primers. The resulting RAPD patterns were scored for presence or absence of specific fragments and this information was tabulated for each sample in a large data matrix. The total number of RAPD fragments per individual and per primer were calculated. A high level of genetic variability was observed between species, races, and even individuals of the same race of Tilletia. Cluster analysis of the RAPD banding patterns distinguished races of Tilletia caries, T. foetida (T. laevis), and T. controversa. No race- or species-specific markers were identified.

Keywords: Genetic analysis; Genomic DNA; Random Amplified Polymorphic DNA; Tilletia.

Introduction

Covered smut or bunt of wheat is present in all wheat-growing areas of the world. Smut infection has caused considerable economic loss (Grey et al., 1986; Trione, 1982). Common bunt is caused by Tilletia caries (DC) Tul. and T. foetida (T. laevis) (Wallr.) Liro. Dwarf bunt is caused by T. controversa Kuhn. The teliospores of Tilletia species are the major means of spreading the infection.

Although the disease symptoms of dwarf bunt are distinct from the symptoms of common bunt, it is difficult to distinguish between the teliospores of the two pathogens even at the electron microscope level (Hess and Trione, 1986). Stockwell and Trione (1986) had limited success distinguishing between two of the Tilletia species using fluorescence microscopy. Aside from the highly impractical method of infecting wheat kernels with teliospores and waiting for the disease symptoms to appear, a method to definitively distinguish between the species and races is yet to be found.

One method that may provide a means to distinguish between the species of Tilletia is Random Amplified Polymorphic DNA (RAPD) analysis. This method has been

used to distinguish populations of plants by their DNA fragments (Gang and Weber, 1995a; Yu and Pauls, 1993). Jones and Dunkle (1993) used RAPD analysis of mycelium to distinguish races of Cochliobolus carbonum. Strongman and MacKay (1993) were able to distinguish between two subspecies of Hirsutella longicolla (var longicolla and var cornuta) using RAPD analysis of the mycelium. RAPD analysis is also a rapid and efficient method for identifying the degree of genetic similarity and variability among biological populations (Tingey and del Tufo, 1993; Gang and Weber, 1995a).

For many fungal species, however, using the mycelium as a source of DNA for RAPD and other genetic analyses, as was the case in the investigations mentioned above, is impractical. Genetic analysis of Tilletia has been hampered by the extremely long time necessary to germinate the teliospores. Three days are needed to germinate T. caries (Weber and Trione, 1980). Thirty days are required to germinate T. controversa (Trione, 1982). Even though Russell and Mills (1993) have made some progress recently with a cross of T. controversa and T. caries mycelia, large-scale genetic analyses of Tilletia such as with RAPDs, PCR, or RFLPs require a method of extracting DNA from the teliospores. The thick wall, high lipid content (Weber and Trione, 1980), and dormancy of the teliospores have previously prevented the development of such a method. This should no longer remain the case. We recently reported a method that extracts RAPD qual

1Current Address: Institute of Biological Chemistry, Washington State University, Pullman, Washington 99164, USA.

2Corresponding author. Fax: 801-378-7499.


Botanical Bulletin of Academia Sinica, Vol. 37, 1996

were viewed as an individual spore source. Tables 1, 2, and 3 list these individuals, their accompanying races, and their sources.

DNA Extraction and Quantification

DNAs from the teliospores of the 90 Tilletia individuals were extracted according to the method of Gang and Weber (1995b).

RAPD Amplification and Analysis

RAPD amplifications were carried out on the individual DNAs according to the method of Gang and Weber (1995b). Random primers (Operon Technologies Inc., Alameda, CA) that gave no false bands in controls (amplifications containing all reaction elements except for the DNA) and showed good reproducibility (see Gang and Weber, 1995b, for an example) were selected for the RAPD amplifications and are listed in Table 4.

ity, large molecular weight genomic DNA from the teliospores of Tilletia (Gang and Weber, 1995b).

The purpose of this investigation was to analyze the DNA from dormant Tilletia teliospores to search for race- or species-specific RAPD markers and to use RAPD analysis to determine the genetic variability within and relationships between species and races of Tilletia.

Materials and Methods

Sample Selection

Ten races of T. controversa, eleven races of T. caries, and eight races of T. foetida were arbitrarily selected for this investigation. Three infected seed heads from different plots were arbitrarily selected from smut pathogenicity test plots for each of the races. The smut pathogenicity test plots were located at the USDA laboratory in Aberdeen, Idaho. The combined bunt balls from each seed head

Table 1. Tilletia controversa individuals: their corresponding races, wheat strains, year collected and the total amount of DNA and the number of unique RAPD bands obtained from each, with 13 primers including averages with standard deviation and standard error.

Individual Race Wheat strain Year collected ng DNA extracted No. unique bands

Co1 D-8 Red Bobs Bt-1 1993 3,817 3

Co2 D-8 Red Bobs Bt-1 1993 1,517 a

Co3 D-8 Red Bobs Bt-1 1993 7,000 2

Co4 D-1 Red Bobs 1993 48,805 5

Co5 D-1 Red Bobs 1993 30,813 1

Co6 D-1 Red Bobs 1993 24,800 1

Co7 D-2 Red Bobs Bt-4 1993 95,252 2

Co8 D-2 Red Bobs Bt-4 1993 93,852 4

Co9 D-2 Red Bobs Bt-4 1993 104,843 2

Co10 D-3 Red Bobs Bt-3 1993 28,405 3

Co11 D-3 Red Bobs Bt-3 1993 36,785 4

Co12 D-3 Red Bobs Bt-3 1993 39,658 3

Co13 D-5 Red Bobs Bt-6 1993 48,464 2

Co14 D-5 Red Bobs Bt-6 1993 29,570 3

Co15 D-5 Red Bobs Bt-6 1993 21,507 8

Co16 D-6 Red Bobs Bt-6 1993 66,633 6

Co17 D-6 Red Bobs Bt-6 1993 28,211 4

Co18 D-6 Red Bobs Bt-6 1993 94,350 5

Co19 D-8 Red Bobs Bt-1 1993 31,925 2

Co20 D-8 Red Bobs Bt-1 1993 56,004 2

Co21 D-8 Red Bobs Bt-1 1993 37,847 1

Co22 D-10 Red Bobs Bt-2 1993 58,333 5

Co23 D-10 Red Bobs Bt-2 1993 1,888 1

Co24 D-10 Red Bobs Bt-2 1993 80,467 0

Co25 D-12 Red Bobs Bt-4 1993 54,616 2

Co26 D-12 Red Bobs Bt-4 1993 60,657 2

Co27 D-12 Red Bobs Bt-4 1993 89,829 3

Co28 D-14 Red Bobs Bt-14 1993 122,950 1

Co29 D-14 Red Bobs Bt-14 1993 73,042 0

Co30 D-14 Red Bobs Bt-14 1993 177,720 5

Co31 D-15 Red Bobs 1993 37,417 3

Co32 D-15 Red Bobs 1993 184,850 1

Co33 D-15 Red Bobs 1993 96,033 4

Total 1,967,858 90 Average 59,632 2.8

st dev 44,764 1.8

std err 7,792 0.3

aIndividuals that did not amplify consistently were not included in data analysis.


Gang and Weber — Genetic variability in wheat smut (Tilletia)

Table 2. Tilletia caries individuals: their corresponding races, wheat strains, year collected, and the total amount of DNA and the number of unique RAPD bands obtained from each, including averages with standard deviation and standard error.

Individual Race Wheat strain Year collected ng DNA extracted No. unique bands

Ci1 T-15 Hohenheimer 1992 3,533 1

Ci2 T-15 Hohenheimer 1992 6,200 0

Ci3 T-15 Hohenheimer 1992 5,467 2

Ci4 T-1 Bt-7 1984 47,194 5

Ci5 T-1 Bt-7 1984 28,842 2

Ci6 T-1 Bt-7 1984 22,827 9

Ci7 T-2 Heines VII 1992 b b

Ci8 T-2 Heines VII 1992 b b

Ci9 T-2 Heines VII 1992 b b

Ci10 T-4 SEL 50077 1990 6,800 a

Ci11 T-4 SEL 50077 1990 6,367 a

Ci12 T-4 SEL 50077 1990 4,533 2

Ci13 T-5 SEL 1102 1992 b b

Ci14 T-5 SEL 1102 1992 27,000 5

Ci15 T-5 SEL 1102 1992 b b

Ci16 T-7 SEL 1102 1990 3,667 a

Ci17 T-7 SEL 1102 1990 3,600 4

Ci18 T-7 SEL 1102 1990 4,233 2

Ci19 T-8 SEL 1102 1990 4,600 2

Ci20 T-8 SEL 1102 1990 b b

Ci21 T-8 SEL 1102 1990 7,867 2

Ci22 T-12 SEL 2092 1990 8,100 2

Ci23 T-12 SEL 2092 1990 8,450 2

Ci24 T-12 SEL 2092 1990 6,033 3

Ci25 T-16 RIO 1990 2,867 1

Ci26 T-16 RIO 1990 5,650 3

Ci27 T-16 RIO 1990 3,400 3

Ci28 T-22 CI 1558 1990 4,867 2

Ci29 T-22 CI 1558 1990 2,333 1

Ci30 T-22 CI 1558 1990 3,900 2

Ci31 T-26 M82-2102 1990 8,033 6

Ci32 T-26 M82-2102 1990 6,440 1

Ci33 T-26 M82-2102 1990 5,425 0

Total 248,228 62

Average 9,194 2.6

st dev 10,280 2.0

std err 1,978 0.4

aIndividuals that did not amplify consistently were not included in data analysis.

bDNA was not obtained by the extraction procedure from these individuals.

The RAPD fragments were resolved by electrophoresis in 250 mL (TAE buffer) 1.4% agarose gels containing 1 µM ethidium bromide alongside pUC 19 molecular weight markers. The gels were photographed under UV light using Polaroid® 667 film and scanned into an Apple Macintosh computer for analysis by the Collage© computer program. The RAPD bands were scored for presence (faint to bright) or absence (no band visible) in each individual. No preference was given to bright versus faint bands. Demeke et al. (1992) demonstrated that using both faint and bright bands gave a taxonomic relationship closer to classical relationships in Brassica than using either only the faint or only the bright bands. The band sizes were determined using the Collage© computer program.

A data matrix was constructed from the RAPD fragments from all 90 Tilletia individuals. This data matrix

was used in the construction of Tables 1, 2, 3, and 4. Analysis of Variance (ANOVA) and regression analysis were performed on the data in Tables 1, 2, 3, and 4 using the statistical functions of the computer program Microsoft® Excel© Version 4.0 for Apple Macintosh Series (Microsoft Corporation, Redmond, WA).

The data matrix was also evaluated using the SIMINT subroutine of the NTSYS-pc© computer program (Exeter Software, Setauket, New York). Similarity coefficients (Jaccard's) were calculated between each possible individual pair and ordered in a similarity matrix. Cluster analysis, using the Unweighted Pair Group Method with Arithmetic Mean (UPGMA), was performed by the SAHN subroutine of NTSYS-pc© on the similarity matrix. The TREE subroutine of NTSYS-pc© was used to generate a phenogram from the cluster groupings.


Botanical Bulletin of Academia Sinica, Vol. 37, 1996

Table 3. Tilletia foetida (T. laevis) individuals: their corresponding races, wheat strains, year collected, and the total amount of DNA and the number of unique RAPD bands obtained from each, including averages with standard deviation and standard error.

Individual Race Wheat Strain Year Collected ng DNA extracted No. unique bands

Fo4 L-1 SEL 50077 1990 8,600 0

Fo5 L-1 SEL 50077 1990 8,667 1

Fo6 L-1 SEL 50077 1990 8,900 1

Fo7 L-2 SEL 50077 1992 29,500 4

Fo8 L-2 SEL 50077 1992 10,033 3

Fo9 L-2 SEL 50077 1992 7,133 2

Fo10 L-3 SEL 1102 1990 14,433 2

Fo11 L-3 SEL 1102 1990 11,200 1

Fo12 L-3 SEL 1102 1990 33,467 a

Fo13 L-4 SEL 2092 1990 10,433 1

Fo14 L-4 SEL 2092 1990 11,200 1

Fo15 L-4 SEL 2092 1990 10,467 2

Fo16 L-5 SEL 1102 1990 5,200 3

Fo17 L-5 SEL 1102 1990 6,800 3

Fo18 L-5 SEL 1102 1990 2,567 1

Fo19 L-8 RIO 1990 9,575 4

Fo20 L-8 RIO 1990 7,367 0

Fo21 L-8 RIO 1990 9,133 0

Fo22 L-10 RIDIT 1990 6,600 3

Fo23 L-10 RIDIT 1990 2,600 1

Fo24 L-10 RIDIT 1990 4,500 3

Fo25 L-16 _ 1984 6,333 a

Fo26 L-16 _ 1984 11,750 4

Fo27 L-16 _ 1984 3,233 1

Total 239,692 41

Average 9,987 1.9

st dev 7,290 1.3

std err 1,488 0.3

aIndividuals that did not amplify consistently were not included in data analysis.

Table 4. Primers (Operon Technologies Inc., Alameda, California) used for RAPD amplifications of Tilletia genomic DNA; the primer sequence; a description of the resulting bands, evaluated by primer.

Primer name Primer sequence (5' - 3') No. of bands unique % Bands unique

OPN-12 CACAGACACC 21 18.75

OPN-13 AGCGTCACTC 17 17.53

OPN-14 TCGTGCGGGT 12 18.75

OPN-15 CAGCGACTGT 22 19.82

OPO-03 CTGTTGCTAC 19 18.63

OPO-04 AAGTCCGCTC 23 17.42

OPO-07 CAGCACTGAC 20 16.81

OPO-13 GTCAGAGTCC 18 15.65

OPO-15 TGGCGTCCTT 13 18.06

OPO-19 GGTGCACGTT 10 11.63

OPP-05 CCCCGGTAAC 5 11.11

OPP-07 GTCCATGCCA 6 19.35

OPS-18 CTGGCGAACT 18 22.22

Total 204

Average 15.7 17.48

st dev 5.95 3.09

std err 1.65 0.86


Gang and Weber — Genetic variability in wheat smut (Tilletia)

Results

Tables 1, 2, and 3 list the individual teliospore DNA samples used in this investigation from Tilletia controversa, T. caries, and T. foetida, respectively. Included in the tables are the race to which each individual belongs, the wheat strain from which each individual was collected, the year each individual was collected, and the total amount of DNA obtained from each individual by the extraction procedure. The DNA yield varied greatly from individual to individual, and the average amount of DNA per species also differed between the three species. The individual yields (for individuals from which DNA was obtained and amplifications were consistent) varied from a low of 1,888 ng from individual Co23 to a high of 184,850 ng from individual Co32. T. controversa individuals yielded a mean of 59,632 ng (±7,792 ng [std error]) DNA. T. caries individuals yielded a mean of 9,194 ng (±1,978 ng) DNA. T. foetida individuals yielded a mean of 9,987 ng (±1,488 ng) DNA. Once standardized to a concentration of 0.1 ng per RAPD reaction, the DNAs behaved consistently and amplified well (except for the individuals noted in Tables 1, 2, and 3). Analysis of Variance (ANOVA) on the mean DNA yield by species indicated that the difference in the mean DNA yield per individual observed between T. caries and T. foetida was not significant, with a P-value of 0.755. ANOVA showed, however, that the differences in the mean DNA yield observed between T. controversa and T. caries and between T. controversa and T. foetida were highly significant, with P-values of 3.9 × 10⁻⁷ and 1.6 × 10⁻⁶ respectively.

Included in Tables 1, 2, and 3 are the number of RAPD fragments that were unique to a particular individual.

The mean number of unique RAPD fragments per individual for 13 primers was 2.8 ± 0.3 (std error), 2.6 ± 0.4, and 1.9 ± 0.3 for T. controversa, T. caries, and T. foetida, respectively. ANOVA on the mean number of unique RAPD fragments by species indicated that the differences in the mean number of unique RAPD fragments per individual observed between T. caries and T. controversa and between T. caries and T. foetida were not significant, with P-values of 0.658 and 0.164, respectively. ANOVA indicated, however, that the difference in the mean number of unique RAPD fragments observed between T. controversa and T. foetida was significant, with a P-value of 0.0413.

Regression analysis was performed to determine if any correlation existed between the DNA yield and the number of unique RAPD fragments per individual within both the genus and each of the three Tilletia species. No such correlation was found to exist, with r2 values ranging from -0.32 to 0.53 for these comparisons.

The number of unique bands and the percentage of unique bands for each individual primer are listed in Table 4. From the 13 primers used in this investigation we obtained a total of 1,167 different bands. On average, each primer produced 89.9 different bands with the 90 individuals. The average number of unique bands (bands which were present in only one individual) was 15.7 per primer or 17.5% of the bands obtained.

Regression analysis was performed to determine if any correlation existed between the total number of RAPD fragments per primer and the number of unique RAPD fragments per primer. A strong positive correlation was observed, with an r2 value of 0.92.

An example of the DNA banding patterns obtained from RAPD amplifications of Tilletia teliospore DNA is shown

Figure 1. An example of the typical RAPD banding pattern observed with Tilletia genomic DNA analyzed in this investigation. This 1.4% agarose gel contains pUC molecular weight markers (lanes 1 and 14), individuals Ci31_Ci33 (lanes 2_4) individuals Co1_Co9 (lanes 5_13), individuals Co10_Co21 (lanes 15_26) and an empty lane (lane 27) amplified using primer OPO-4 (see Table 4 for a description of this primer). The bands are strong, distinct and clear. Numerous bands are obtained per smut individual. As indicated by the very diverse banding pattern in this gel and in other gels examined, the level of genetic variability within and between smut races is very high.


Botanical Bulletin of Academia Sinica, Vol. 37, 1996

in Figure 1. This gel contains individuals Ci31-Ci33 and Co1-Co21 amplified using primer OPO-4 (see Table 4). Each individual has both bright and faint RAPD fragments. Of particular interest is the extreme variation in the banding pattern from individual to individual. Test samples in an earlier investigation (see Gang and Weber, 1995b) and samples done in duplicate (data not shown) show that these individual banding patterns are highly reproducible under the conditions we describe.

No race- or species-specific RAPD fragments were observed. For any given primer, the RAPD banding pattern of an individual appeared to have a greater chance of being similar to the banding pattern of an individual from a different race or even a different species than it did of being similar to an individual from the same race. A close examination of Figure 1 supports this assertion.

Figure 2 shows the phenogram that resulted from the cluster analysis of the RAPD banding patterns. The Tilletia individuals, with very few exceptions, grouped with members of the same species and usually with members of the same race when a large number of RAPD fragments were used in the analysis.

Discussion

The high variability in the amount of DNA obtained from each individual seed head (a tenfold difference from the lowest to the highest yield) can be explained by the diversity in the amount of spores found in any given seed head. The average mass of spores collected from T. controversa infected seed heads was about 750 mg (data not shown), although a large range of masses was observed. We did not quantitate this difference in spore mass by individual, since the differences in DNA yield were not observed until all the seed heads had been extracted. We noticed that the mass of spores from T. caries and T. foetida infected seed heads was significantly less than the mass of T. controversa infected seed heads. This was readily observed in the infected seed heads by the great difference in size of the bunt balls and the number of bunt balls per seed head infected by the various species.

The smut individuals Co2, Ci10, Ci11, Ci16, Fo12, and Fo25 did not amplify consistently and were not included in the cluster analysis. This inconsistency may be due to inaccurate quantification (see Gang and Weber, 1995b) or contamination of the particular samples.

Statistical analyses of the data in Tables 1, 2, and 3 indicate differences in how these three species of Tilletia react to the DNA extraction procedure but not to the RAPD protocol that was used in this investigation. The average number of RAPD fragments obtained per individual per primer for all three species are consistent with values reported elsewhere (Tingey and del Tufo, 1993; Gang and Weber, 1995a). The fact that the number of unique bands per individual (bands not present in any other individual) did not differ very significantly between the three species indicates that this method of genetic analysis may provide a means of measuring the genetic variability within Tilletia

Figure 2. Tilletia individuals and their corresponding races grouped by UPGMA cluster analysis of their similarity coefficients calculated by the computer program NTSYS-pc. Scale values indicate percent similarity between individuals or groups as determined by the Jaccard coefficient of similarity (×100). Although there were exceptions (notably Co9 and Fo24, which, although placed in the same cluster, did not group together closely when compared to the other cluster groupings), the individuals and races of Tilletia caries clustered together as did the individuals and races of Tilletia controversa and also Tilletia foetida (Tilletia laevis).


Gang and Weber — Genetic variability in wheat smut (Tilletia)

species. The fact that no correlation exists between the DNA yield, the total number of RAPD fragments and the number of unique RAPD fragments per individual within the three species indicates that the differences we observed in the RAPD banding patterns from one Tilletia species to another, and from one Tilletia individual to another, do not represent differences in the manner that these three species were handled, but do in fact represent actual differences in the DNA extracted from each of the Tilletia individuals.

The very large average number of RAPD bands per primer (see Table 4) indicates a high level of genetic variability among the 90 Tilletia individuals analyzed. The fact that no RAPD fragment was common to all smut individuals and that few were common to more than 20 of the individuals (and then always excluding at least one individual of at least one race represented) supports this assertion.

The strong positive correlation between the total number of RAPD fragments per primer and the number of unique bands per primer indicates that using primers that produce several bands may yield sufficient information to identify race- or species-specific RAPD markers.

Although there were exceptions, the individuals and races of the three Tilletia species clustered together. Analyses with additional primers may provide a more precise clustering.

In conclusion, cluster analysis of Random Amplified Polymorphic DNAs of Tilletia teliospore genomic DNAs provided sufficient information to distinguish races of Tilletia caries, Tilletia foetida (Tilletia laevis), and Tilletia controversa even though no race or species specific markers were found in this investigation. Further analysis involving perhaps hundreds of random primers may reveal race or species specific markers.

Acknowledgements. We wish to acknowledge the help of Dr. B. J. Goates in providing smut infected wheat heads of the different Tilletia races and of Dr. W. R. Andersen for allowing the use of his equipment. We appreciate the help of Steve Halls and Kedra Haroldsen in the preparation of some of the samples. We also thank Kedra for her assistance in the analysis of the gels. This research was supported in part by research funds provided by Brigham Young University.

Literature Cited

Demeke, T. R., P. Adams, and R. Chibbar. 1992. Potential taxonomic use of random amplified polymorphic DNA (RAPDs): a case study in Brassica. Theor. Appl. Genet. 84: 990_994.

Gang, D. R. and D. J. Weber. 1995a. Genetic variability and phenetic relationships determined among 10 populations of rubber rabbitbrush (Chrysothamnus nauseosus ssp. hololeucus) by RAPD analysis of bulked genomic DNA samples. Bot. Bull. Acad. Sin. 36: 1_8.

Gang, D. R. and D. J. Weber. 1995b. Preparation of genomic DNA for RAPD analysis from thick-walled dormant teliospores of Tilletia species. BioTechniques 19: 92_96.

Grey, W. E., D. E. Mathre, J. A. Hoffman, R. L. Powelson, and J. A. Fernandez. 1986. Importance of seedborne Tilletia controversa for infection of winter wheat and its relationship to international commerce. Plant Dis. 70: 122_125.

Hess, W. M. and E. J. Trione. 1986. Use of electron microscopy to characterize teliospores of Tilletia caries and T. controversa. Plant Dis. 70: 458_460.

Jones, M. J. and L. D. Dunkle. 1993. Analysis of Cochliobolus carbonum races by PCR amplification with arbitrary and gene specific primers. Phytopathology 83: 366_370.

Russell, B. W. and D. Mills. 1993. Electrophoretic karyotypes of Tilletia caries, Tilletia controversa and their F1 progeny: further evidence for conspecific status. Mol. Plant-Microbe Interact. 6: 66_74.

Stockwell, V. O. and E. J. Trione. 1986. Distinguishing teliospores of Tilletia controversa from those of Tilletia caries by fluorescence microscopy. Plant Dis. 70: 924_926.

Strongman, D. B. and R. M. MacKay. 1993. Discrimination between Hirsutella longicolla var longicolla and Hirsutella longicolla var cornuta using random amplified polymorphic DNA fingerprinting. Mycologia 85: 65_70.

Tingey, S. V. and J. P. del Tufo. 1993. Genetic analysis with Random Amplified Polymorphic DNA Markers. Plant Physiol. 101: 349_352.

Trione, E. J. 1982. Dwarf bunt of wheat and its importance in international wheat trade. Plant Dis. 66: 78_80.

Weber, D. J. and E. J. Trione. 1980. Lipid changes during the germination of teliospores of the common bunt fungus, Tilletia caries. Can J. Bot. 58: 2263_2268.

Yu, K. and K. P. Pauls. 1993. Rapid estimation of genetic relatedness among heterogeneous populations of alfalfa by random amplification of bulk genomic DNA samples. Theor. Appl. Genet. 86: 788_794.