Bot. Bull. Acad. Sin. (1998) 39: 107_112

Huh et al. — Allozyme variation of Pyrola

Allozyme variation and population structure of Pyrola japonica in Korea

Man Kyu Huh1, Su Dong Chung, and Hong Wook Huh

Department of Biology Education, Pusan National University, Pusan, 609-735, The Republic of Korea

(Received July 10, 1997; Accepted January 3, 1998)

Abstract. Enzyme electrophoresis was used to estimate genetic diversity and population structure of Pyrola japonica KLENZE in Korea. The percent of polymorphic loci within the enzymes was 58.8%. Genetic diversity at both the species level and at the population level was high (Hes = 0.226; Hep = 0.179, respectively) whereas the extent of the population divergence was relatively low (GST = 0.143). FIS, a measure of the deviation from random mating within the 14 populations, was 0.184. An indirect estimate of the number of migrants per generation (Nm = 1.50) indicates that gene flow is moderate among Korean populations of the species. In addition, analysis of fixation indices revealed a substantial heterozygosity deficiency in some populations and at some loci. This indicates that some populations sampled may have been substructured largely due to rhizotamous spread and restricted gene flow coupled with founder effects and genetic drift.

Keywords: Genetic diversity; Population structure; Pyrola japonica.

Introduction

Many perennial plants multiply by both sexual and asexual reproduction. Numerous plant species can produce offspring that are genetically identical to each other and to the maternal plant (Fryxell, 1957). This broad-sense asexual reproduction may be accomplished by vegetative spread or production of sexual propagules. Most plants, especially rhizomatous and stoloniferous species, have physical connections among ramets although their persistence is highly variable among species and habitats (Sobey and Barkhouse, 1977).

Studies of the genetic structure of apomictic plant populations have received revitalized interest in the past decade as a result of electrophoretic techniques, which allow us to better assess the genotypic composition of populations. A well-established general belief holds that asexually reproducing species lack genetic diversity and can be considered evolutionary "dead-ends." Various studies have shown that asexually reproducing plants can be much more genetically diverse than originally thought (Ellstrand and Roose, 1987). Clearly, descriptive genetic work on both sexual and asexual plant populations is needed as well. Despite the importance of information on genetic variation and population genetic structure for conservation purposes, detailed studies of the levels and distribution of genetic variation are not available for most species in Korea, for either sexually or asexually reproducing plants.

Pyrola japonica Klenze (Pyrolaceae), a widespread herb occurring throughout cooler, more temperate regions of the Northern Hemisphere is most abundant in the boreal and Arctic areas (Woodland, 1991). Leaves of this spe

cies are evergreen, alternate, and simple with stipules lacking. Flowers are regular, perfect, and hypogynous. In this species, we have compiled and quantitatively analyzed what is known of the genetic structure of populations to examine whether any trends occur both within and among populations.

The purpose of this study was: 1) to estimate how much total genetic diversity is maintained in the species; 2) to describe how genetic variation is distributed within and among populations; 3) to assess genetic structure of P. japonica; and 4) to characterize the population genetic structure to determine whether patches of the species are comprised of a single clone or a mixture of genets.

Materials and Methods

Sampling Procedure

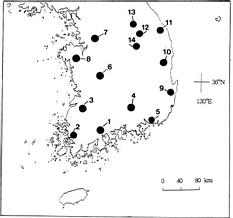
Pyrola japonica KLENZE was collected from fourteen natural populations in Korea (Figure 1). One leaf per plant was sampled during 1996 to 1997. More than 30 plants were collected from each population. Leaves gathered from natural populations were stored in plastic bags for 1_2 weeks in a refrigerator until electrophoresis was carried out.

Enzyme Electrophoresis

Leaves were homogenized by mechanical grinding to release enzymes from cell and organellar membranes with Tris-HCl grinding buffer-PVP solution described in Soltis et al. (1983). Electrophoresis was performed using 10% starch gel. Gel and electrode buffer systems and enzyme staining procedures from Soltis et al. (1983) were used to assay ten enzyme systems; peroxidase (PER), isocitrate dehydrogenase (IDH), glutamate oxaloacetate transami

1Corresponding author. Fax: (82-51) 514-8576; Tel: (82-51) 510-2698 or 510-2697.


Botanical Bulletin of Academia Sinica, Vol. 39, 1998

within and among populations (Nei, 1973, 1977). In addition, c2-statistics were used to detect significant differences in allele frequencies among populations for each locus (Workman and Niswander, 1970). Nei's genetic identity (I) was calculated for each pairwise combination of populations (Nei, 1972). We used the PC-SAS program (SAS Institute Inc., 1989) to conduct a cluster analysis on genetic distances via the unweighted pairwise groups method arithmetic average (UPGMA).

The genetic structure within and among populations was also evaluated using Wright's (1965) F-statistics: FIT, FIS, and FST. The FIT and FIS coefficients measure excesses of homozygotes or heterozygotes relative to the panmictic expectations within the entire samples and within populations, respectively. The FST coefficient estimates relative population differentiation. Deviation of FIT and FIS from zero were tested using c2-statistics (Li and Horvitz, 1953). Two indirect estimates of gene flow were calculated. One estimate of Nm (the number of migrants per generation) was based on FST (Wright, 1951) and the other estimate was based on the average frequency of "rare" alleles found in only one population (Slatkin, 1985; Barton and Slatkin, 1986).

Results

Genetic Diversity

Ten of the 17 loci studied (58.8%) showed detectable polymorphism in at least two populations. The remaining seven loci (Per-2, Idh-1, Got-1, Fe-3, 6Pgdh-1, Pgm, and Me) were monomorphic in all populations. An average of 46.9% of the loci were polymorphic within populations, with individual population values ranging from 43.8% to 56.3%. The polymorphic loci, Per-1 and Acp, expressed two alleles, while the remaining ones (eight loci) expressed three. The average number of alleles per locus (A) was 1.69 across populations, varying from 1.56 for the population with the lowest number of alleles and 1.81 for the population with the highest number of alleles (Table 1). The effective number of alleles per locus was similar at the species and the population level (Aes = 1.35; Aep = 1.42). The mean genetic diversity within populations was 0.179. Population 1 had the highest expected diversity (0.220), while Population 13 had the lowest (0.134). Genetic diversity at the species level was high, whereas the value at the population level was somewhat lower (Hes = 0.226; Hep = 0.179).

Genetic Structure

Chi-square tests indicated significant deviations from Hardy-Weinberg. As expected from the chi-square tests, FIS, a measure of the deviation from random mating within the 14 populations, was 0.184, and ranged from -0.393 for Per-1 to 0.903 for Mdh-1 (Table 2). The observed low, significant, and positive FIS value (0.184) indicates that there was a significant deficit of heterozygotes in the populations.

Figure 1. Collection localities for populations of P. japonica as source for isozyme analysis.

nase (GOT), fluorescent esterase (FE), 6-phosphoglugonate dehydrogenase (6PGDH), phosphoglucomutase (PGM), malic enzyme (ME), malate dehydrogenase (MDH), acid phosphatase (ACP), and shikimate dehydrogenase (SKDH). The procedures for horizontal starch gel electrophoresis were as reported by Shaw and Prasad (1970).

Putative loci were designated sequentially, with the most anodally migrating isozyme designated `1', the next `2', etc. Likewise, alleles were designated sequentially with the most anodally migrating allozyme designated `a' and progressively slower forms `b', `c', and so on. Although the genetic bases of the loci were not documented by controlled crosses, the isozymes expressed phenotypes that were consistent in subunit structure and genetic interpretation with most isozyme studies in plants, as documented by Weeden and Wendel (1989).

Analysis of Data

A locus was considered polymorphic if two or more alleles were detected, regardless of their frequencies. Four standard genetic parameters were estimated using a computer program developed by Loveless and Schnabel; percent polymorphic loci (P), mean number of alleles per locus (A), effective number of alleles per locus (Ae), and gene diversity (He) (Hamrick et al., 1992). Ae is calculated as the reciprocal of the sum of squares of allele frequencies. Subscripts refer to species (s) or population (p) level parameters. Observed heterozygosity (Ho) was compared with Hardy-Weinberg expected value using Wright's fixation index (F) or inbreeding coefficients (Wright, 1922). These indices were tested for deviation from zero by c2-statistics following Li and Horvitz (1953).

Nei's gene diversity formulae (HT, HS, DST, and GST) were used to evaluate the distribution of genetic diversity


Huh et al. — Allozyme variation of Pyrola

Table 1. Percentage of polymorphic loci (P), mean number of alleles per polymorphic population (Ap), mean number of alleles per locus (A), effective number of alleles per locus (Ae), observed heterozygosity (Hop), Hardy-Weinberg expected heterozygosity or genetic diversity (Hep) for fourteen populations of P. japonica.

Popa. Nb Pp Ap A Ae Hop (SD) Hep (SD)

1 45 50.0 2.38 1.69 1.43 0.157 (0.017) 0.220 (0.060)

2 50 56.3 2.56 1.88 1.33 0.149 (0.017) 0.187 (0.055)

3 48 43.8 2.57 1.69 1.38 0.123 (0.016) 0.195 (0.060)

4 56 37.5 2.50 1.56 1.32 0.103 (0.015) 0.164 (0.057)

5 52 56.3 2.44 1.81 1.36 0.139 (0.017) 0.195 (0.057)

6 53 50.0 2.38 1.69 1.42 0.133 (0.016) 0.216 (0.061)

7 35 43.8 2.43 1.63 1.37 0.138 (0.016) 0.188 (0.059)

8 47 43.8 2.57 1.69 1.42 0.140 (0.016) 0.201 (0.065)

9 48 43.8 2.57 1.69 1.31 0.106 (0.015) 0.152 (0.062)

10 50 50.0 2.63 1.81 1.42 0.164 (0.019) 0.203 (0.065)

11 48 43.8 2.57 1.69 1.26 0.132 (0.017) 0.144 (0.055)

12 45 43.8 2.57 1.69 1.34 0.135 (0.017) 0.171 (0.059)

13 40 50.0 2.13 1.56 1.24 0.117 (0.017) 0.134 (0.052)

14 38 43.8 2.29 1.56 1.25 0.130 (0.017) 0.142 (0.052)

MEAN 47 46.9 2.47 1.69 1.35 0.133 (0.004) 0.179 (0.016)

aNumerical codes as in Figure 1.

bNumber of individuals in the sample.

Table 2. Total genetic diversity (HT), genetic diversity within population (HS), deviations of genotype frequencies from Hardy-Weinberg expectations over all populations (FIT) and within individual populations (FIS), and proportion of total genetic diversity partitioned among populations (GST) of P. japonica.

Locus HT HS DST FIS FIT GST

Per-1 0.403 0.281 0.123 -0.393 0.031 0.304

Acp 0.177 0.127 0.050 0.112 0.362 0.282

Skdh 0.221 0.200 0.021 0.048 0.140 0.097

6Pgdh-2 0.620 0.604 0.016 -0.294 -0.260 0.026

Idh-2 0.443 0.426 0.018 0.128 0.163 0.040

Mdh-1 0.497 0.444 0.053 0.903 0.913 0.107

Mdh-2 0.331 0.293 0.039 0.301 0.384 0.119

Got-2 0.280 0.258 0.022 0.440 0.484 0.078

Fe-1 0.525 0.454 0.072 0.398 0.480 0.136

Fe-2 0.117 0.088 0.028 0.200 0.395 0.243

MEAN 0.361 0.317 0.044 0.184 0.309 0.143

using only one rare allele frequency was 0.98. Nm values greater than 1 are considered high enough to counteract the effects of genetic drift or be a major factor in P. japonica populations. Genetic identity values among pairs of populations range from 0.8842 to 0.9931. The similarity among P. japonica populations can be seen in the UPGMA dendrogram, where total populations cluster at a below genetic distance of 0.04. The UPGMA dendrogram provided a few insights into the genetic structuring of populations (Figure 2). The UPGMA and correlation analysis show very weak correspondence between genetic distance and geographical distance. Only the three most isolated populations (2, 10, and 11) give any hint of such a relationship.

Discussion

Pyrola japonica maintains more diversity in populations than the average plant species. For example, its genetic diversity at 0.179 is slightly higher than that of tempera

At the level of the sample as a whole, however, Wright's F coefficients showed that significant deficiencies of heterozygotes exist for only 6Pgdh-2 of the ten polymorphic loci (Table 2). Analysis of fixation indices, calculated for all polymorphic loci in each population, showed a substantial deficiency of heterozygotes relative to Hardy-Weinberg expectations. For example, 63.5% of fixation indices were positive (66/104), and all of those departed significantly from zero (p < 0.05). Seven of these indices were negative, indicating an excess of heterozygotes at those loci and in these populations. On a per locus basis, the proportion of total genetic variation due to differences among populations (GST) ranged from 0.026 for 6Pgdh-2 to 0.304 for Per-1 with a mean of 0.143, indicating that about 14% of the total allozyme variation was among populations (Table 2). Values of genetic distance (D) were below 0.10 except in pairs involving Population 2. The estimates of gene flow based on GST were moderate among Korean populations of P. japonica (Nm = 1.50). The estimate of interpopulational gene flow


Botanical Bulletin of Academia Sinica, Vol. 39, 1998

The relatively high level of genetic variation found in P. japonica is consistent with several aspects of its biology. First, geographic range has been shown to be strongly associated with the level of variation maintained within populations and at the species level (Hamrick et al., 1979; Hamrick and Godt, 1989). Widely distributed plant species tend to maintain more variation than more narrowly distributed species. Although P. japonica in Korea is distributed patchily, the species covers wide geographic ranges of the Northern Hemisphere including East Asia. Secondly, the breeding system of a species is an important determinant of variability at both the species and population levels. P. japonica is an outcrossing, insect-pollinated species, a combination is well-known to be associated with high levels of allozyme variation (Brown, 1979; Gottlieb, 1981; Hamrick and Godt, 1989). In addition, vegetative reproduction and spread can also affect the genetic structure of populations (Murawski and Hamrick, 1990). Cook (1983) argued that clonal growth could act to retard the loss of genetic diversity within populations. If a small amount of gene flow and/or mutation add new clones to a population from time to time, clonal variation may be maintained. Furthermore, P. japonica in Korea could be characterized as weedy. Thus, if clonalization occurs by multiple genotypes, the ephemeral nature of woody populations may preclude significant loss of genetic variation while those populations are extant (Ellstrand and Roose, 1987). Species with independent ramets could spread the risk of mortality among ramets, thus reducing the probability of genet death and preserving genetic diversity. Hartnett and Bazzaz (1985) have also argued that physiological independence among ramets may maintain genetic diversity by buffering clones against localized, patch specific selection forces. Third, short-lived perennial species, like P. japonica, generally maintain relatively higher levels of variation than annuals. The observation of P. japonica revealed that the plants with old rhizomes had possibly been harvested for domestic medicine for at least several hundred years. As populations of P. japonica are older, opportunities for the accumulation of mutations should be high (Ledig, 1986). Fourth, the reproduction type of P. japonica plays an important role in genetic variability. Sexual reproduction could act to enhance the genetic variation, and asexual reproduction could maintain the enhanced genetic variation. Pyrola japonica commonly reproduces by sexually produced seeds, but it can propogate by asexually produced rhizomes when several strong environmental disadvantages influence its habitat. There are probably robust differences in genetic features between sexually reproducing species and asexually reproducing ones (Akiyama, 1994). In fact, this has been demonstrated in various groups of higher plants (Hamrick et al., 1979).

Considering the factors mentioned above (geographic distance and the species' low frequency), our indirect estimate of gene flow Nm (1.50) is somewhat high. Although Nm estimates, derived from GST, can be affected by other factors (e.g., selection, drift, and mutation), this high gene flow estimate is probably caused by seed dispersal via

Figure 2. A dendrogram showing the phylogenic relationships among the fourteen populations of P. japonica based on data of genetic distance obtained by starch gel electrophoresis. Numbers of populations are given in Table 1 and Figure 1.

ture-zone species (0.146), species with a reproduction mode that is both sexual and asexual (0.138), and species with a short-lived perennial herbaceous (0.116), and it is lower than species with widespread geographic ranges (0.202) (Hamrick and Godt, 1989). The percent polymorphic loci in the studied sample was 46.9%, which is lower than temperature-zone species (48.5%), and species with widespread geographic ranges (58.9%), but it is similar to species with a reproduction mode that is both sexual and asexual (43.8% ± 3.7%) (Hamrick and Godt, 1989). Its average number of alleles per locus was 1.69; this value is lower than that of temperature-zone species (1.91) and species with widespread geographic ranges (2.29), but it is similar to species with a reproduction mode that is sexual and asexual (1.69) and short-lived perennial herbaceous species (1.70) (Hamrick and Godt, 1989). These comparisons suggest that genetic diversity levels of P. japonica are as high as its associates, the temperature-zone species. It is most interesting to note its levels of genetic diversity are comparable to other species with the same reproductive mode (both sexual and asexual). Ellstrand and Roose (1987), in a review of studies of population genetic structure of primarily obligate clonal plant species, concluded that clonal plant species tend to have intermediate levels of genetic diversity. The results of the present study are not consistent with the general conclusion of Ellstrand and Roose (1987) about the levels of genetic diversity.


Huh et al. — Allozyme variation of Pyrola

wind. In Korea, P. japonica inhabits understory Pinus-, Larix-dominated forest. This might be attributable to its growth strategies such as winter-seed dispersal and vegetative reproduction. Pollination by insects in dense forest is difficult. But, in late fall and early winter, numerous light seeds of P. japonica can be spread over a deciduous forest by wind.

In summary, the populations of P. japonica in Korea may also influence both the relatively high level of genetic diversity in this species and the relatively low population differentiation. Seed dispersal by wind and vegetative reproduction undoubtedly enhance gene flow with the species. Pyrola japonica maintains higher levels of genetic diversity and exhibits lower levels of population divergence than expected on the basis of its life history characteristics.

Literature Cited

Akiyama, H. 1994. Allozyme variability within and among populations of the epithytic moss leucodon (Leucodontaceae: Musci). Am. J. Bot. 81: 1280_1287.

Barton, N.H. and M. Slatkin. 1986. A qushi-equilibrium theory of the distribution of rare alleles in a subpopulation. Heredity 56: 409_415.

Bradshaw, A.D. 1972. Some evolutionary consequences of being a plant. Evol. Biol. 5: 25_47.

Brown, A.D.H. 1979. Enzyme polymorphism in plant populations. Theor. Biol. 15: 1_42.

Cook, R.E. 1983. Clonal plant populations. Am. Sci. 71: 244_253.

Ellstrand, N.C. and M.L. Roose. 1987. Patterns of genotypic diversity in clonal plant species. Am. J. Bot. 74: 123_131.

Fryxell, P.A. 1957. Mode of reproduction in higher plants. Bot. Rev. 23: 135_233.

Gottlieb, L.D. 1981. Electrophoretic evidence and plant populations. Prog. Phytochem. 7: 1_46.

Hamrick, J.L., Y.B. Linhart, and J.B. Mitton. 1979. Relationships between life history characteristics and electrophoretically detectable genetic variation in plants. Ann. Rev. Ecol. 10: 175_200.

Hamrick, J.L. and M.J.W. Godt. 1989. Allozyme diversity in plant species. In A.D.H. Brown, M.T. Clerg, A.L. Kahler, and B.S. Weir (eds.), Plant Population Genetics, Breeding and Genetic Resources. Sinauer, Sunderland, MA, pp. 43_63.

Hamrick, J.L., M.J.W. Godt, and S.L. Sherman-Broyles. 1992. Factors influencing levels of genetic diversity in woody plant species. New For. 6: 95_124.

Hartnett, D.C. and F.A. Bazzaz. 1985. The regulation of leaf, ramet and gene densities in experimental populations of the rizomatous perennial Solidago canadensis. J. Ecol. 73: 429_443.

Ledig, F.T. 1986. Heterozygosity, heterosis, and fitness in outbreeding plants. In M.E. Soule (ed.), Conservation Biology. Sinauer, Sunderland, MA, pp. 77_104.

Li, C.C. and D.G. Horvitz. 1953. Some methods of estimating the inbreeding coefficient. Am. J. Hum. Genet. 5: 107_117.

Murawski, D.A. and J.L. Hamrick. 1990. Local genetic and clonal structure in the tropical terrestrial bromelid, Aechmea magdalenae. Am. J. Bot. 77: 1201_1208.

Nei, M. 1972. Genetic distance between populations. Am. Nat. 106: 282_292.

Nei, M. 1973. Analysis of gene diversity in subdivided populations. Proc. Natl. Acad. Sci. 70: 3321_3323.

Nei, M. 1977. F-statistics and analysis of gene diversity in subdivided populations. Ann. Hum. Genet. 41: 225_233.

SAS Institute, Inc. 1989. SAS/STAT User's Guide, Ver. 6, 4th eds., vol 1. SAS Institute, Cary, 943 pp.

Shaw, C.R. and R. Prasad. 1970. Starch gel electrophoresis of enzyme-A compilation of recipes. Biochem. Genet. 4: 297_320.

Slatkin, M. 1985. Rare alleles as indicators of gene flow. Evolution 39: 53_65.

Sobey, D.G. and P. Barkhouse. 1977. The structure and rate growth of the rhizome of some forest herbs and dwarf herbs of the New Brunswick-Nova Scotia border region. Can. Field-Nat. 91: 377_383.

Soltis, D.E., C.H. Haufler, D.C. Darrow, and G.J. Gastony. 1983. Starch gel electrophoresis of ferns: A complication of grinding buffers, gel and electrode buffers, and staining schedules. Am. Fern J. 73: 9_27.

Weeden, N.F. and J.F. Wendel. 1989. Genetics of plant isozymes. In D.E. Soltis and P.S. Soltis (eds.), Isozymes in Plant Biology. Dioscorides Press, Portland, OR, pp. 46_72.

Woodland, D.W. (ed.). 1991. Contemporary Plant Systematics. Prentice-Hall, Inc., Englewood Cliffs, NJ, pp. 222.

Workman, P.L. and J.D. Niswander. 1970. Population studies on southern Indian tribes. II. Local genetic differentiation in the Papago. Am. J. Hum. Genet. 22: 24_49.

Wright, S. 1922. Coefficients of inbreeding and relationship. Am. Nat. 56: 330_338.

Wright, S. 1951. The genetic structure of populations. Ann. Eugen. 15: 313_354.

Wright, S. 1965. The interpretation of genetic population structure by F-statistics with special regard to systems of mating. Evolution 19: 395_420.