Bot. Bull. Acad. Sin. (1999) 40: 115-119

Hou et al. — Carboxyl group distributions in pectins

Qualitative distinction of carboxyl group distributions in pectins with ruthenium red

Wen-Chi Hou1,2,4, Wei-Hsien Chang2, and Chii-Ming Jiang2,3

1Institute of Botany, Academia Sinica, Nankang, Taipei, Taiwan, ROC

2Graduate Institute of Agricultural Chemistry, National Taiwan University, Taipei, Taiwan, ROC

3Present address: Department of Food Health, Ta-Jen Junior Collage of Pharmacy, Pintung, Taiwan, ROC

(Received May 4, 1998; Accepted November 24, 1998)

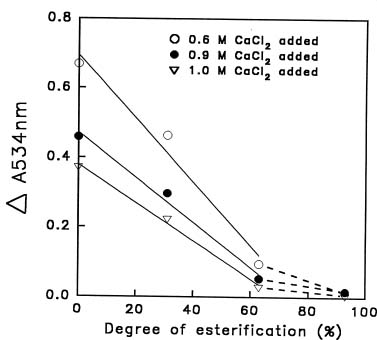
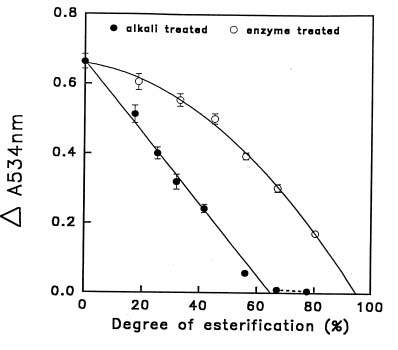
Abstract. Ruthenium red binding to free carboxyl groups of commercial pectins with different degrees of esterification (DE, 0%, 31%, 63% and 93%) was investigated. The optimal binding condition of ruthenium red for carboxyl groups was further studied using self-prepared pectins of different DE (0% to 80%). These were prepared by treatment with either sodium hydroxide (for random type) at 4°C or commercial pectinesterases of orange sources (for blockwise type) at 30°C. The results revealed different relationships between DE from different treatments and the corresponding DA534 nm value, a measure of the amount of bound ruthenium red. Negative first order (r = -0.995) and negative second order (r = -0.998) regression correlations were found, respectively, with sodium hydroxide-treated and pectinesterase-treated pectins. Ruthenium red binding to pectin might distinguish blockwise carboxyl group distributions from random ones in pectin molecules.

Keywords: Blockwise; Degree of esterification (DE); Pectin; Random; Ruthenium red.

Abbreviations: DE, degree of esterification; MOPS, 3-(N-morpholino) propanesulfonic acid; PGA, polygalacturonic acid.

Introduction

Pectins are one of the structural polysaccharide components of the primary cell walls of plants and are useful as gel-forming, thickening, and stabilizing agents in the food industry; the main fields of application include jams and jellies and confectionery and dairy products (Christensen, 1986). Recently, pectin has also been developed as a fat replacer (Pszczola, 1991).

The carboxyl group distributions in a pectic polymer may be divided into two patterns (Kulp, 1975; Pilnik and Rombouts, 1981); one is a blockwise pattern which is obtained from hydrolysis by pectinesterase from higher plant sources (Kohn et al., 1983); the second is a random pattern, found in pectins treated by alkali or microbial pectinesterases (Kohn et al., 1968; Ishii et al., 1979). Hung (1995) reported different gelling properties, including storage modulus (G`), loss modulus (G'`), and sol-gel transition, for either blockwise or random distribution pectins at the same degree of esterification (DE). Kohn et al. (1968, 1983) used the "calcium activity coefficient" to analyze the stability constants of calcium pectate with the two patterns of methyl esterification. The blockwise pattern pectins had higher stability constants than random ones. However, calculations of the calcium activity coefficient and stabil

ity constants are difficult. Tuerena et al. (1982, 1984) used ethylene oxide to distinguish blockwise and random substitution by modifying the free carboxyl groups of pectins, but this method was tedious and time-consuming.

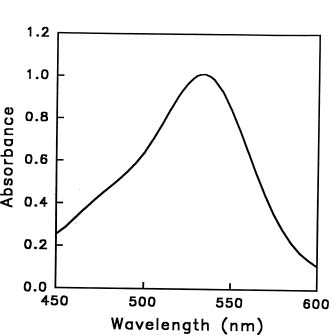
Ruthenium red is a dye which selectively binds to the intramolecular spaces of carboxyl groups of pectin and shows little binding to alginic acid carboxyl groups. The dye group binds between the carboxyl oxygen of one galacturonide moiety and a hydroxyl oxygen of an adjacent neighbor galacturonide in the pectate chain. Thus, if there are n monomer of anhydrogalacturonide units in the pectin polysaccharide, there will be [n-2] staining sites for ruthenium red (Sterling, 1970). Ruthenium red has been successfully used for activity stainings of PE isozymes on acrylamide gels (Alonso et al., 1995; Cruickshank and Wade, 1980; Jiang et al., 1998). Based on the binding characteristics of ruthenium red to carboxyl groups of pectin, we designed a procedure that allows us to qualitatively distinguish carboxyl group distributions in pectic polymers.

Materials and Methods

Materials

Orange peel pectin (DE 31%, 63% and 93%), polygalacturonic acid (PGA, sodium salt used as DE 0%) and pectinesterase (orange peel) were purchased from Sigma Chemical Co. (St. Louis, MO, USA). Ruthenium red

4Corresponding author. Fax: 886-2-2782-7954; Tel: 886-2-2789-9590.


Botanical Bulletin of Academia Sinica, Vol. 40, 1999

(purity > 99%), MOPS, and calcium chloride were from E. Merck Co. (Darmstadt, Germany). Other chemicals of reagent grade were obtained from Sigma Chemical Co. (St. Louis, MO, USA).

The Preparations of Different DE of Pectins

Pectins of two different carboxyl groups distributions with different DE were prepared from commercial pectin of 93% DE using sodium hydroxide at 4°C (for random distributions of carboxyl groups) according to the methods of Thibault and Rinaudo (1985) or by commercial pectinesterases at 30°C from orange peel (for blockwise distributions of carboxyl groups) according to the methods of Powell et al. (1982). After precipitation with three volumes of isopropanol, pectins of different treatments and different DE were filtered, washed with 80% ethanol, rinsed with acetone, and finally dried at 40°C overnight for further use. The DE of pectins prepared by each method were determined according to the Food Chemical Codex (1981).

Ruthenium Red Binding to Carboxyl Groups of Pectin

Solutions of 0.1% (W/V) pectins of different DE and polygalacturonic acid (PGA) were adjusted to pH 6.5. To aliquots (1 mL) of sample in 100 mM MOPS buffer (pH 6.5) 0.5 mL of 0.02% ruthenium red was added, mixed, and left to stand for 5 min. Calcium chloride (0.5 mL, 0.6 M) was then added to precipitate pectin of different DE and PGA, to which ruthenium red was bound. The mixtures were centrifuged at 1,400 g for 15 min. The absorbance at 534 nm of the supernatants was measured. A blank experiment of distilled water instead of pectin solution was used. Four determinations were used for each data point. The DA534 nm value was calculated by subtracting the absorbance at 534nm of ruthenium red in supernatant of each pectin of different DE and PGA from that of the blank. Means of each DA534 nm value of different DE from the same treatment were plotted against corresponding calculated DE.

Results

The pKa value of pectin of different DE ranges from 3.55 to 4.10 (Plaschina et al., 1978). Dissociation of the carboxyl groups of pectin is required for ruthenium red binding (Sterling, 1970). Hence, 100 mM MOPS buffer (pH 6.5 and 7.0) was used to ensure the dissociation of carboxyl groups. We found both pH 6.5 and pH 7.0 of 100 mM MOPS buffer had the same results for ruthenium red binding (data not showed). We chose 100 mM MOPS buffer (pH 6.5) for further experiments.

The absorption spectra peak of ruthenium red is at 534 nm (Figure 1). In preliminary tests, we found that the addition of ruthenium red to commercial pectin of 31% DE and PGA (0% DE) could result in suspended precipitates, and these suspended particles interfered with the later spectrophotometric analyses. Therefore, calcium ion was

Figure 1. Absorptive spectrum of ruthenium red in distilled water (0.004%) between 450 nm and 600 nm.

added to precipitate pectin of different DE and PGA to which ruthenium red was bound. Figure 2 shows the result of different concentrations of calcium chloride added (0.6 M, 0.9 M and 1.0 M per 0.5 mL) to the different DE pectin (0%, 31%, 63% and 93%). PGA had the highest amounts of free carboxyl groups (theoretically 100% free carboxyl groups) among the DE pectins. The absorbance at 534 nm of supernatants of PGA after adding ruthenium red and calcium ion was the lowest, so the highest DA534 nm value was found. Although we found different DA534 nm values among different calcium chloride concentrations for the same DE, high correlations (r = -0.992 to -0.995) between DA534 nm value and DE (0_63%) for each concentration were found. The correlations were not found when calcium ion concentration was below 0.6 M. Therefore, we choose 0.5 mL, 0.6 M calcium chloride for ruthenium red binding experiments. The similar DA534 nm values between commercial 63% and 93% DE pectin, indicated that available spaces for dye binding were limited when DE was above 63%.

The optimal conditions for ruthenium red binding were further studied by preparing pectins with different DE (0% to 80%). For sodium hydroxide-treated pectin (random type), samples` DE included 17.4%, 25.3%, 32.0%, 41.7%, 56.1%, 67.0% and 77.6%; for orange peel pectinesterase-treated pectins (blockwise type), samples' DE included 18.6%, 33.1%, 45.2%, 56.2%, 67.2% and 80.5%. Figure 3 shows the plot between the DE of the pectin and the corresponding DA534 nm value for both sodium hydroxide-treated and orange peel pectinesterase-treated pectins. From sodium hydroxide-treated pectins (DE of 0 to 80%), there was a negative first order regression (r = -0.995, Y=0.665-0.01X) between DE (0 to 67%) and the corresponding DA534 nm value. The 67% and 78% DE prepared by sodium-hydroxide had similar DA534 nm values close to zero. With the commercial orange peel


Hou et al. — Carboxyl group distributions in pectins

pectinesterase-treated pectin (DE of 0 to 80%), there was a negative second order regression (r = -0.998, Y=0.66-1.18 × 10⁻³ X-6.07 × 10-5 X2) between DE (0 to 80%) and the corresponding DA534 nm value. It was also apparent that the same DE from sodium hydroxide- and orange peel pectinesterase-treated pectins had different DA534 nm values. The pectinesterase-treated pectins had higher DA534 nm values for the same DE than sodium hydroxide-treated pectins.

Discussion

This is the first, and a preliminary, attempt to distinguish between higher plant pectinesterase-treated and alkali-treated pectins with ruthenium red, and is presumably based on distributions (random or blockwise) of free carboxyl groups along the pectin chains. Other reports on the different behaviors of free carboxyl groups along the pectin chains (Kohn et al., 1968, 1983; Ishii et al., 1979; Tuerena et al., 1982, 1984) also presumed in advance that higher plant pectinesterase-treated pectin was of blockwise type and alkali-treated pectins were of random type in carboxyl group distributions. However, most determination methods about pectins concerned their DE values or pectin contents. Few available reports are concerned with comparisons of different properties between blockwise and random distribution pectins. Hung (1995) reported different gelling properties, including storage modulus (G`), loss modulus (G'`), and sol-gel transition, for either blockwise or random distribution pectins at the same DE. However, the need still exists for a rapid method that can qualitatively distinguish the nature of the charge distribution in pectins.

Ruthenium red is a dye which selectively binds to the intramolecular (not intermolecular) spaces of carboxyl groups of pectin and shows little binding to alginic acid carboxyl groups, which have a different internal configuration of carboxyl groups. In fact, the calcium pectate in the cell wall or synthetic calcium pectate gels were stained by ruthenium red because the intramolecular staining groups will not suffer any steric hindrance from the calcium ion (Sterling, 1970). The calcium ion exists as an external, intermolecular salt bridge between the carboxyl groups of two adjoining molecules (Kohn et al., 1968); therefore, the calcium ion was used in this experiment to precipitate pectin of different DE and PGA to which ruthenium red was bound. The 0.5 mL of 0.02% ruthenium red was used because the dye was sufficient for 1 mL of 0.1% PGA binding, which was theoretically composed of 100% free carboxyl groups. If greater amounts of PGA were used, the amount of dye was also increased.

From Figure 2, the close DA534 nm values to zero between commercial 63% and 93% DE pectin meant that available spaces for dye bindings were limited. In Figure 3, the DA534 nm value was also close to zero for self-prepared pectins of DE higher than 67% for sodium hydroxide-treated pectin while the orange peel pectinesterase-treated pectin were freely binding under the same DE. It appears that different DE of commercial pectins obtained from Sigma Co. were prepared by chemical treatments. These results indicated that, when chemical random hydrolysis is used, there were steric hindrances by the methoxy group for ruthenium red binding when DE was higher than 67%. By enzyme blockwise hydrolysis, there were free positions available for ruthenium red binding when DE was higher than 67%. From commercial pec

Figure 2. The different concentrations of calcium chloride added (0.6, 0.9 and 1.0 M for 0.5 mL) to different degrees of esterification of commercial pectin (0%, 31%, 63% and 93%). The correlations were plotted between DA534 nm values and pectins of different degrees of esterification (0% to 63%).

Figure 3. Means of four determinations of DA534 nm values were plotted against the pectins of different degree of esterification prepared by treatment with sodium hydroxide (17.4%, 25.3%, 32.0%, 41.7%, 56.1%, 67.0% and 77.6%) at 4°C or by commercial orange peel pectinesterase (18.6%, 33.1%, 45.2%, 56.2%, 67.2% and 80.5%) at 30°C.


Botanical Bulletin of Academia Sinica, Vol. 40, 1999

lus japonicus. J. Food Sci. 44: 611_614.

Jiang, C.M., W.C. Hou, and W.H. Chang. 1998. A rapid method for pectinesterase activity staining. Food Sci. 25: 46_58. (Chinese)

Kohn, R., I. Furda, and Z. Kopec. 1968. Distribution of free carboxyl group in the pectin molecule after treatment with pectinesterase. Coll. Czech. Chem. Commun. 33: 264_270.

Kohn, R., O. Markovic, and E. Machova. 1983. Deesterification mode of pectin by pectinesterase of Aspergillus foetidus, tomatoes and alfalfa. Coll. Czech. Chem. Commun. 48: 790_798.

Kulp, K. 1975. Pectic enzymes. In G. Reed (ed.), Enzymes in Food Processing, 2nd Ed., Academic Press, New York, pp. 107_117.

Pilnik, W. and F.M. Rombouts. 1981. Pectic enzymes. In G. G. Birch, N. Blakebrough and K. Parker (eds.), Enzymes and Food Processing, Applied Science Publisher, London, pp. 105_128.

Plaschina, I.G., E.E. Braudo, and V.B. Tolstoguzov. 1978. Circular dichroism studies of pectin solutions. Carbohydrate Res. 60: 1_8.

Powell, D.A., E.R. Morris, M.J. Gidley, and D.A. Rees. 1982. Conformations and interactions of pectins. II. Influence of residue sequence on chain association in calcium pectate gels. J. Mol. Biol. 155: 517_525.

Pszczola, D.E. 1991. Pectin's functionality finds use in fat-replacer market. Food Technol. 45: 116_117.

Sterling, C. 1970. Crystal structure of ruthenium red and stereochemistry of its pectic stain. Amer. J. Bot. 57: 172_175.

Thibault, J.F. and M. Rinaudo. 1985. Interactions of Mono- and divalent counterions with alkali- and enzyme-deesterified pectins in salt-free solutions. Biopolymers 24: 2131_2138.

Tuerena, C.E., A.J. Taylor, and J.R. Mitchell. 1982. Evaluation of a method for determining the free carboxyl group distribution in pectins. Carbohydrate Polym. 2: 193_203.

Tuerena, C.E., A.J. Taylor, and J.R. Mitchell. 1984. Carboxy distribution of low-methoxy pectin deesterified in situ. J. Sci. Food Agri. 35: 797_804.

tins and self-prepared pectins, it was clear that there were different binding properties of ruthenium red for blockwise and random type pectins. Ruthenium red binding to pectin might distinguish blockwise carboxyl group distributions from random ones in pectin molecules.

In summary, our preliminary results using ruthenium red to distinguish the carboxyl group distributions in pectins were helpful for further investigations, including the natural states of pectin in cell wall during fruit ripening or maturation, the hydrolysis mode of pectinesterase from higher plants at different pH, ionic strength, etc., and the gelling properties of different carboxyl group distributions in pectins.

Acknowledgement. The authors want to thank Dr. Hung, H. L. for different DE pectin preparations.

Literature Cited

Alonso, J., M.T. Rodriguez, and W. Canet. 1995. Detection of pectinesterase in polyacrylamide gels. Electrophoresis 16: 39_42.

Christensen, S.H. 1986. Pectins. In M. Glicksman (ed.), Food Hydrocolloids, vol. III, CRC Press, Boca Raton, FL, pp. 223_224.

Cruickshank, R.H. and G.C. Wade. 1980. Detection of pectic enzymes in pectin-acrylamide gels. Anal. Biochem. 107: 177_181.

Food Chemical Codex. 1981. 3rd edn. National Academy Press, Washington, DC, pp 215_217.

Hung, H.L. 1995. Preparation of Blockwise and Random De-Esterified Pectins of Different Degree of Esterification, and Comparison of their Physicochemical Properties. Ph.D Dissertation. Grad. Inst. Food Sci. and Technol., National Taiwan Univ., Taipei, Taiwan.

Ishii, S., K. Kiho, S. Sugiyama, and H. Sugimoto. 1979. Low-methoxyl pectin prepared by pectinesterase from Aspergil


Hou et al. — Carboxyl group distributions in pectins

¥H Ruthenium red µ²¦Xªk°Ï§OªG½¦±ô°ò¤À¥¬

«J¤åµX1 ±i¬°¾Ë2 ¦¿±Ò»Ê2

1 ¤¤¥¡¬ã¨s°|´Óª«¬ã¨s©Ò

2 °ê¥ß»OÆW¤j¾Ç¹A·~¤Æ¾Ç¬ã¨s©Ò

§Q¥ÎÔB¬õ (ruthenium red) ·»²G¡A¬ã¨s±´°Q¤£¦P°Ó«~ªG½¦à­¤Æ«× (0%¡A31%¡A63% ©M 93%) ªº´åÂ÷±ô°òªºµ²¦X±ø¥ó¡A³Ì¾Aµ²¦Xªº±ø¥ó¦A¶i¤@¨B±´°Q¦Û¦æ»s³Æ¤£¦P୤ƫתºªG½¦ (0% ¨ì 80%)¡C³o¨ÇªG½¦¤À §O§Q¥ÎÆP©Ê·»²G (¥NªíÀH·N«¬¤À¥¬ ) ¦b 4°C ¶i¦æ¤ÏÀ³©Î¬O¾ï¥Ö¨Ó·½ªº°Ó«~ªG½¦à­×Q (¥Nªí°Ï¬q«¬¤À¥¬ ) ¦b 30°C ¶i¦æ¤ÏÀ³¡Cµ²ªGÅã¥Ü¡A§Q¥ÎÆP©Ê·»²G¤Î¾ï¥Ö¨Ó·½ªº°Ó«~ªG½¦à­×Q©Ò»s³Æªº¤£¦P୤ƫתG½¦©M¨ä¬Û¹ï ªº ¡µA534 nm ¼Æ­È¡A¦³§¹¥þ¤£¦Pªº¬ÛÃö©ÊÃþ«¬¡A¦Ó ¡µA534 nm ¼Æ­È¥Nªí¯u¥¿µ²¦X¦bªG½¦±ô°ò¤WªºÔB ¬õ¼Æ¶q¡CÆP©Ê·»²G©Ò»s¦¨ªº¤£¦P୤ƫתG½¦©M¨ä¬Û¹ïªº ¡µA534 nm ¼Æ­È¡A§e²{¤@¦¸°jÂk­t¬ÛÃö©Ê (r = -0.995)¡A¦Ó¾ï¥ÖªG½¦à­×Q©Ò»s³Æªº¤£¦P୤ƫתG½¦©M¨ä¬Û¹ïªº ¡µA534 nm ¼Æ­È¡A§e²{¤G¦¸°jÂk­t¬ÛÃö©Ê (r=-0.998)¡C§Q¥ÎÔB¬õ¬V¾¯¶i¦æªG½¦ªºµ²¦X¡A¥i¥H°Ï§O±ô°ò¦bªG½¦ªøÃì¤Wªº¤À¥¬¬O°Ï¬q«¬ÁÙ¬OÀH·N«¬¡C

ÃöÁäµü¡G °Ï¬q«¬¡F୤ƫסFªG½¦¡FÀH·N«¬¡FÔB¬õ¡C