Bot. Bull. Acad. Sin. (1999) 40: 121-126

Sammour — Proteins of linseed

Proteins of linseed (Linum usitatissimum L.), extraction and characterization by electrophoresis

Reda Helmy Sammour1

Department of Botany, Faculty of Science, Tanta University, Tanta, Egypt

(Received March 17, 1998; Accepted August 13, 1998)

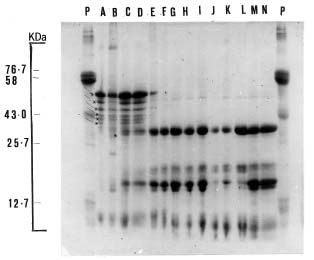
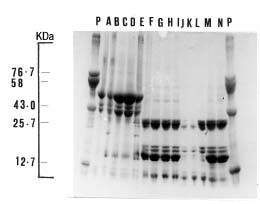
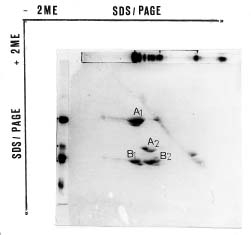
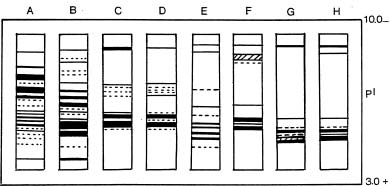
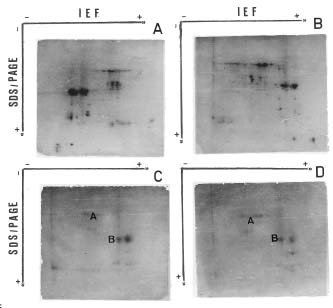
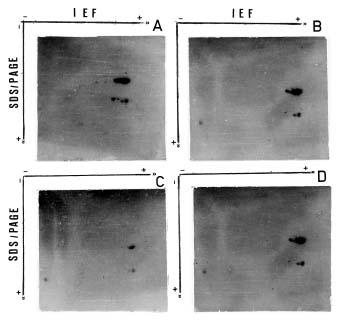
Abstract. The seed proteins of linseed (Linum usitatissimum L.) were qualitatively and quantitatively analyzed. Qualitative studies were carried out using an array of electrophoretic techniques, including sodium dodecylsulphate polyacrylamide gel electrophoresis (SDS-PAGE), sodium dodecylsulphate porosity gradient polyacrylamide gel electrophoresis (SDS-Poro-PAGE), two dimension sodium dodecylsulphate polyacrylamide gel electrophoresis (2-D SDS-PAGE), isoelectric focusing, and mapping gels. Electrophoretic patterns of the proteins extracted with water, buffer, urea, and SDS, and analyzed on SDS-PAGE and Poro-SDS-PAGE under non-reducing conditions, showed six major bands with MWs of 55 kDa, 50 kDa, 47 kDa, 45 kDa, 43 kDa and 41 kDa. After reduction with 2-mercaptoethanol (2-ME), these bands gave rise to large acidic chains with MWs around 40 kDa and small basic chains with MWs around 20 kDa. The pI-values of linseed proteins are distributed over the pH range used, namely pH 3_10. Mapping gels showed that the major bands were highly heterogeneous. Quantitative estimation of the different protein species in the seed flour indicated that the contents of albumin, globulin, prolamin, and glutelin were 197 ± 19, 196 ± 12, 32 ± 7, and 65 ± 6 mg/g seed flour, respectively.

Keywords: Albumin; Globulin; Kilodalton (kDa); 2-mercaptoethanol (2-ME); Molecular weights (MWs); Two dimension-PAGE (2-D SDS-PAGE).

Abbreviations: SDS-PAGE, sodium dodecylsulphate polyacrylamide gel electrophoresis; SDS-Poro-PAGE, sodium dodecylsulphate porosity gradient polyacrylamide gel electrophoresis; 2-D SDS-PAGE, two dimension sodium dodecylsulphate polyacrylamide gel electrophoresis; 2-ME, 2-mercaptoethanol; PAGIF, polyacrylamide gel isoelectric focusing.

Introduction

Linseed or flax (Linum usitatissimum L.) is an annual crop belonging to the family Linaceae (Simmonds, 1976). It is grown worldwide either for the oil extracted from the seed or for fiber from the stem. The meal that remains after oil is extracted from the seed is fed to animals as a protein supplement (Lennerts, 1983). Linseed meal is 35_40% protein and together with cottonseed and sunflower supplies about 23% of the world's oilcake/meal (Hatje, 1989).

Lay and Dybing (1989) improved seed yield and oil production through breeding procedures that aimed to improve disease resistance, notably against rust and wilt. However, the agronomically important traits, such as seed yield and its components, and oil yield, have received little research effort.

The seed protein of flax was purified by ultracentrifugation (Youle and Huang, 1981). It was found to contain two kinds of proteins; 2S protein (albumin) and 11S (globulin) protein (the major storage protein). However, few qualitative studies have emphasized the components of linseed proteins. This work, therefore, is devoted to bridging this gap in the literature.

Materials and Methods

Materials

Linseed (Linum usitatissimum L. cultivar Viking) was obtained from Cooperative Liniere De Fontaine-Cany, France. The seeds were ground with an electric mill (JANKE and KUNKEL, type) for 1 min at 0°C. The flour was defatted by stirring with pure hexane (1:10 W/V) for 30 min three times. After filtering, the flour was air-dried, brushed through a sieve of 125 µm (115 mesh), and stored at -10°C prior to use.

Methods

Seed flour extracts

Water, buffer, SDS, and urea extracts were made under non-reducing and reducing conditions (with 1% 2-ME). To made extracts under either reducing condition, 2-ME was added to a final concentration of 1% at the onset of extraction.

Water and buffer extracts. Portions (60 mg) of air dried linseed flour were extracted overnight with 500 µl distilled water and 0.125 M Tris/borate buffer pH 8.9 (containing 0.02% sodium azide) in an Eppendorf tube at room temperature. The mixture was centrifuged for 20 min at 4°C and 10,000 g (Heraeus Christ Labofuge I-cooling centrifuge). A second water extract was made,

1Corresponding author: Teacher's College, Sakaka El-Jouf, P.O. Box 957, Saudi Arabia. Tel: (04) 6250471.


Botanical Bulletin of Academia Sinica, Vol. 40, 1999

where 2-ME was added to a final concentration after 30 min.

For SDS-PAGE, the buffer and water extracts were made 2% SDS (W/V) and boiled for 5 min. To prepare protomers, extracts were boiled for 3 min with 2% SDS and 1% 2-ME.

SDS-extract. For SDS-extraction, 500 mg of the defatted and dried flour was shaken in an Eppendorf tube for 20 min with 500 µl of an aqueous solution of 5% SDS (W/V). After centrifugation at 10,000 g, the pellet was re-extracted in 15% SDS.

Urea-extract. Samples of 60 mg defatted flour were shaken for 30 min in an Eppendorf tube with 500 µl of an aqueous solution of 9 M urea. The mixture was centrifuged (20 min, 22°C, 10,000 g) and the supernatant used for electrophoresis.

Samples of 60 mg defatted flour were shaken for 30 min in an Eppendorf tube with 500 µl of an aqueous solution of 9 M urea, 2% ampholyte pH 3_10. The mixture was centrifuged at 10,000 g for 20 min at 22°C and the supernatant used for electrophoresis (Shah and Stegemann, 1983). All the extracts were stored at -10°C.

Protein determination

Linseed flour (300 mg) was successively extracted with 1 ml distilled water, 1 ml 5.0 M NaCl, 1 ml absolute ethanol, and 1 ml 0.2 M phosphate buffer (pH 8.0) for the extraction of the albumin, globulin, prolamin, and glutelin, respectively. Each extraction was shaken for 20 min in an Eppendorf tube and centrifuged at 10,000 g for 6 min. The total protein contents were determined by the method of Lowry et al. (1951) using bovine serum albumin as the standard protein.

Electrophoresis

Electrophoresis was performed in 17% SDS-PAGE following the same protocol used by Abasery (1992). For the determination of the protomer molecular weights (MWs), a mixture of the following marker proteins treated with SDS were used: human transferrin (76 kDa), bovine serum albumin (68 kDa), egg albumin (43 kDa), a-chymotrypsinogen-A (25.7 kDa), and cytochrome-C (12.7 kDa).

Two dimensional SDS-PAGE was carried out according to the protocol used by Sammour (1985). In this protocol the extracted sample was analyzed in the first dimension on 12% SDS-PAGE. The gels were stained with 0.05% Commassie Brilliant Blue R 250 in 50% methanol, 7% glacial acetic acid in distilled water overnight and destained by using the solvent of the stain (50% methanol, 7% glacial acetic acid in distilled water) (Laemmli, 1970). After destaining, the track was cut with a sharp razor and left 20 min in sample buffer containing 5% SDS and 2% 2-ME. The gel strip was inserted on a 17% SDS-PAGE gel and then subjected to electrophoresis at 25 mA for about 6 h.

SDS-Poro-PAGE was carried out in a 6_26% gradient polyacrylamide Slab gel in 0.125 Tris/borate buffer and 0.139 Tris/borate buffer with 0.1% SDS, respectively. For MW determination, the same marker proteins used in SDS-PAGE were applied to SDS-Poro-PAGE.

Polyacrylamide gel isoelectric focusing (PAGIF) was run in tubes (gel cylinders). Isoelectric focusing was carried out, as described by Stegmann et al. (1988) in 6% polyacrylamide tube gels containing 6 M urea.

Mapping

Isoelectric focusing in the first dimension and SDS in the second dimension was run as described by Stegmann et al. (1988) and Laemmli (1970). The gels were stained and destained as for SDS-PAGE.

Results

Linseed flour was successively extracted with distilled water (albumin), NaCl (globulin), ethanol (prolamin), and an alkaline solution (glutelin). The concentration of proteins extracted was determined by the method of Lowry et al. (1951). A protein content of 197 ± 19 mg/g and 196 ± 12 mg/g seed flour was found in the water and salt extracts (Table 1). There was approximately twice as much glutelin as prolamin in the linseed flour. Protein analysis could not carried out in extracts containing ampholyte because ampholytes complex with copper ions (Shah and Stegemann, 1983).

Table 1. Albumin, globulin, prolamin, and glutelin content in linseed flour.

Proteins Quantity The total protein

mg/g seed floura conte (%)b

Albumin 197 ± 19 40.2

Globulin 196 ± 12 40.0

Prolamin 032 ± 07 06.5

Glutelin 065 ± 06 13.3

aMean and standard deviation of six readings.

bTotal protein content 490 mg/g seed flour.

In SDS-PAGE, the flax seed flour extracted with distilled water, Tris/borate, 5% SDS, 15% SDS or urea share in common 6 major polypeptides with MWs of 55 kDa, 50 kDa, 47 kDa, 43 kDa, 41 kDa and 39 kDa (Figure 1, lanes no. A_E). After reduction with 2-ME, however, the pattern changed strikingly: the major bands disappeared and were replaced with subunits with MWs around 40 kDa and smaller subunits with MWs around 20 kDa. The changes in the electrophoretic pattern could be due to the presence of disulphide bonded proteins. Due to the dissociating and reducing nature of the ampholyte, ampholyte/urea extracts give protomers similar to those of extracts carried out in the presence of 2-ME (Figure 1, lanes no. G_H). Similar results were reported for jojoba beans (Stegemann and Pietsch, 1983). The extraction with SDS extracts gave protein electrophoretic patterns


Sammour — Proteins of linseed

similar to those of the buffer extract, but with a higher density (Figure 1, lanes no. M_N). The increase in the amounts of the seed proteins extracted with SDS extracts could be due to the ability of SDS to dissociate cell membranes (Gennis and Jonas, 1977).

In SDS-Poro-PAGE (Figure 2), the protomers were similar to those of SDS-PAGE (Figure 1). However the polypeptides of the basic subunits were better separated from one another. The MWs of linseed proteins determined by SDS-PAGE and SDS-Poro-PAGE agreed well with each other (Figures 1 and 2).

The seed proteins of linseed were analyzed on a 2-dimensional gel; under a nonreducing condition in the first dimension and a reducing condition in the second dimension (Figure 3). As shown in this figure, the large (A1 & A2) and small (B1 & B2) subunits were distributed off the diagonal; this confirms that the changes in the electrophoretic pattern under reducing conditions were due to the presence of disulphide bonded proteins.

PAGIF was carried out between pH 3_10 in cylindrical tubes containing 8 M urea. In this case a remarkable difference was seen between the proteins extracted by water and those extracted by buffer (Figure 4, lanes no. A_B). The PAGIF-patterns of urea and urea/ampholyte (Figure 4, lanes no. C_D) extracts were almost identical. After reduction with 2-ME the number of bands decreased, and most of them focused in the acidic region. However, the amount of protein extracted was somewhat higher (Figure 4, lanes no. E_H). The reason for this effect was not clear.

Mapping was done for further resolution, first by isoelectric focusing and in the second dimension by SDS-PAGE. These experiments showed that the polypeptide

Figure 1. SDS-Polyacrylamide gel electrophoresis (17% SDS- PAGE) of different extracts of linseed proteins. A, water extract; B, Tris/borate buffer (pH 8.9) extract; C, 5% SDS extract; D, 15% SDS extract; E, urea extract; F, urea/ampholyte extract; G, urea/2% ampholyte/2% 2-ME extract; H, urea/2% 2-ME extract; I, urea/2% 2-ME extract (after boiling for 3 min 2% 2-ME is added); J, water/2% 2-ME extract (after 30 min 2% 2-ME is added); K, water/2% 2-ME extract; L, Tris/borate buffer (pH 8.9)/2% 2-ME extract; M, 5% SDS/2% 2-ME extract; N, 15% SDS/2% 2-ME extract; P, Protein standards (Human transferrin, Bovine Serum Albumin, Ovalbumin, a-Chymotrypsinogen-A, and Cytochrome-C).

Figure 2. SDS-Porosity gradient polyacrylamide gel electrophoresis (6_26% SDS-Poro-PAGE) of different extracts of linseed proteins. A, water extract; B, Tris/borate buffer (pH 8.9) extract; C, 5% SDS extract; D, 15% SDS extract; E, urea extract; F, urea/ampholyte extract; G, urea/2% ampholyte/2% 2-ME extract; H, urea/2% 2-ME extract; I, urea/2% 2-ME extract (after boiling for 3 min 2% 2-ME is added); J, water/2% 2-ME extract (after 30 min 2% 2-ME is added); K, water/2% 2-ME extract; L, Tris/borate buffer (pH 8.9)/2% 2-ME extract; M, 5% SDS/2% 2-ME extract; N, 15% SDS/2% 2-ME extract; P, Protein standards (Human transferrin human, Bovine Serum Albumin, Ovaalbumin, a-Chymotrypsinogen-A, and Cytochrome-C).

Figure 3. Two dimensional SDS-PAGE of the total linseed protein extract. 1st-D: SDS-PAGE under non-reducing conditions, and 2nd-D: SDS-PAGE under reducing conditions.


Botanical Bulletin of Academia Sinica, Vol. 40, 1999

Huang, 1981). The albumin content (which was 40.2% of total seed proteins) showed also a variation from that of Youle and Huang (1981). Variation in protein content readings could be due to methodological or plant variety differences.

Electrophoretic analysis of linseed protein (extracted with distilled water, Tris/borate, 5% SDS, 15% SDS or urea) on SDS-PAGE or Poro-SDS/PAGE gave 6 major bands with MWs of 55 kDa, 50 kDa, 47 kDa, 43 kDa, 41 kDa and 39 kDa. After reduction with 2-ME, however, these bands disappeared and were replaced with proteins of around 40 kDa and 20 kDa. This behaviour is typical of the disulphide bonded acidic and basic chains in 11S storage proteins found in Pisum, Cicer, Lens, and Vicia (Derbyshire et al., 1976; Sammour, 1985, 1988, 1989; Wright and Boulter, 1974). When linseed flour (extracted with Tris/borate buffer) was analyzed on a 2-dimensional gel under nonreducing conditions in the first dimension and reducing conditions in the second dimension, the large and small subunits were distributed off the diagonal. The chemical reduction of the major bands of linseed proteins by 2-ME to yield major peptide chains of around 40 kDa and 20 kDa, together with the distribution of these subunits off the diagonal after two-dimensional gel electrophoresis, confirms that the major bands of linseed proteins were legumin-like proteins. By analogy to legumin proteins of Pisum, a hexameric structure is suggested for the legumin-like protein from linseed (Matta et al., 1981). The linseed protein is expected to be like the other 11S seed storage proteins in that it is synthesized as a precursor subunit that requires two proteolytic cleavages for maturation (Barton et al., 1982; Tumer et al., 1981). The first cleavage involves the removal of a signal peptide that is involved in transport of the protein into the lumen of the

Figure 4. Polyacrylamide gel isoelectric focusing in 6% polyacrylamide, 2% ampholyte pH 3_10. A, samples of linseed flour extracted with water; B, Tris borate buffer (pH 8.9); C, urea; D, urea/2% ampholyte; E, urea/2% ampholyte/2% 2-ME; F, urea/2% 2-ME; G, water/2% 2-ME; H, Tris/borate buffer (pH 8.9)/2% 2-ME.

in buffer and water extracts were considerably different (Figure 5, A and B). This indicated that major bands were highly heterogeneous. The extraction in the presence of 2-ME showed a close similarity, and 40 kDa polypeptides (acidic subunits or A) were focused in the acidic range while the 20 kDa polypeptides (basic subunits or B) were focused in the basic range (Figure 5, C and D). The mapping gels of both urea and urea/ampholyte extracts showed similar patterns (Figure 6, A and C). After reduction with 2-ME, the two extracts showed the same distribution of dots (Figure 6, B and D).

Discussion

Linseed flour (Linum usitatissimum L. cultivar Viking) is about 49% proteins. That is greater than the 35 to 40% reported in other laboratories (Hatje, 1989; Youle and

Figure 5. Mapping of linseed proteins extracted with following solvents: A, water; B, Tris/borate buffer (pH 8.9); C, water/2% 2-ME; D, Tris/borate buffer (pH 8.9)/2% 2-ME.

Figure 6. Mapping of linseed proteins extracted with following solvents: A, urea; B, urea/2% 2-ME; C, urea/2% ampholyte; D, urea/2% ampholyte/2% 2-ME.


Sammour — Proteins of linseed

sequences of cottnseed. Plant Mol. Biol. 7: 475_489.

Chrispeels, M.J., T.J.V. Higgins, and D. Spencer. 1982. Assembly of stotrage protein oligomers in the endoplasmic reticulum and processing of the polpeptides in the protein bodies of developing cotyledons. J. Cell Biol. 93: 306_313.

Croy, R.R.D., G.W. Lycett, J.A. Gatehouse, J.N. Yarwood, and D. Boulter. 1982. Cloning and analysis of cDNAs encoding plant storage protein precursors. Nature 295: 76_79.

Derbyshire, E.D., D.J. Wright, and D. Boulter. 1976. Legumin and vicilin, storage proteins of legumin seeds. Phytochemistry 15: 3_24.

Dickinson, C.D., E.H.A. Hussein, and N.C. Nielsen. 1989. Role of posttranslational cleavage in glycinin assembly. Plant Cell 1: 459_469.

Gennis, R.P. and A. Jonas. 1977. Protein - lipids interactions. Annu. Rev. Biophys. Bioeng. 6: 195_238.

Hatje, G. 1989. World importance of oilcrops and their products. In G. Robbellen, R.K. Downey, and A. Ashri (eds.), Oil Crops of the World. Their Breeding and Utilization. McGraw-Hill Publishing Company, New York, pp. 1_21.

Laemmli, U.K. 1970. Cleavage of structural proteins during the assembly of the head of bacteriophage T4. Nature (London) 227: 680_685.

Lay, C.L. and C.D. Dybing. 1989. Linseed. In G. Robbellen, R.K. Downey, and A. Ashri (eds.), Oil Crops of the World. Their Breeding and Utilization. McGraw-Hill Publishing Company, New York, pp. 416_430.

Lennerts, Dr.L. 1983. Oelschrote, Oelkuchen, pflanzliche Oele und Fette, Herkunft, Gewinnung, Verwendung. Bonn. Verlag Alfred Strothe, Hannover.

Lowry, O.H., N.J. Ronserough, A.L. Farr, and R.J. Randell. 1951. Protein measurement with the folin phenol reagent. J. Biol. Chem. 193: 265_275.

Matta, N.K., J.A. Gatehouse, and D. Boulter. 1981. Molecular and subunit heterogeneity of legumin of Pisum sativum (Garden pea) - Amultidimensional gel electrophoretic study. J. Exp. Bot. 32: 1295_1307.

Sammour, R.H. 1985. The Use of Protein Character in the Taxonomy of Peas and Beans. Ph. D. Thesis, Faculty of Science, Tanta University, Tanta, Egypt.

Sammour, R.H. 1988. Flax seed proteins; comparison by various PAGE-Techniques in slabs. J. Agron. Crop Sci. 160: 271_276.

Sammour, R.H. 1989. Electrophoresis of the seed proteins of Vicia faba L. and its immediate progenitors - A reappraisal. Plant Breed. 104: 196_201.

Shah, A. and H. Stegemann. 1983. Proteins of jojoba beans (Simmondsia obinensis), extraction and characterization by electrophoresis. J. Agron. Crop Sci. 152: 39_47.

Simmonda, N.W. 1976. Evolution of Crop Plants. Longman Inc., New York.

Stegmann, H. and G. Pietsch. 1983. Methods for characterization of seed proteins of cereals and legumes. In W. Gottschalt and H.P. Muller (eds.), Seed Proteins, Biochemistry, Genetics, Nutritive Value Martinus Nijhoff, Den Haag, Niederlande, pp. 532.

Stegmann, H., W. Burgermeister, A.A. Shah, H.E. Francksen, and E. Krogerrecklenfort. 1988. Gel Electrophoresis and Isoelectric Focusing, (PANTA- PHOR and MONO-PHOR Manual). (Institut fur Biochemie, Biologische Bundesanstlt, Messeweg 11, D-3300 Brau nschweig West Germany).

endoplasmic reticulum (ER) (Tumer et al., 1981). The second cleavage take place post-translationally. By analogy with pea legumin, this second cleavage probably occurs within vacuolar protein bodies (Chrispeels, 1982), and results in fragmentation of the subunit into its constituent 40 kDa acidic and basic polypeptide chains (Tumer et al., 1982). The site of the second cleavage is between an asparagine and a glycine residue, a site that has been highly conserved during the evolution of the 11S globulins (Chlan et al., 1986; Croy et al., 1982; Dickinson et al., 1989; Walburg and Larkins, 1986).

Mapping gels showed that the polypeptide distribution of water and buffer extracts were considerably different. This indicates that the major bands were highly heterogeneous. The heterogeneity could result from several causes. First, subunits composed of several nearly identical polypeptides, each the product of a different gene coding sequence, may be present. In this event, amino acid substitutions would occur throughout the length of the molecules. Second, proteolytic modifications could produce charged variants, and in this event the differencs between molecules in each preparation would be evident only after the molecules had been proteolyzed. Third, the glutamine and asparagine could be deamidated. However, the extraction of linseed protein with water and buffer in the presence of 2-ME showed a close similarity and 40 kDa polypeptides (acidic subunits or a) were focused in the acidic range while the 20 kDa polypeptides (basic subunits or b) were focused in the basic range.

Conclusion

In conclusion, the majority of linseed proteins are either legumin-like or albumin proteins. Together they account for about 80% of a seed's protein. The total seed proteins represent about 49% of the seed meal. This percentage qualifies linseed proteins as a good source for feeding animals. On reduction with 2-ME, the legumin-like proteins were separated into acidic and basic chains. The richness of the legumin-like proteins with sulphur amino acids makes them highly nutritional (Abasery, 1992). The pI-values of linseed proteins are distributed over the pH range used, pH 3_10. Urea and ampholyte (a denaturating agent) gave an electrophoretic pattern similar to that of the proteins extracted with Tris/borate buffer under reducing conditions. The extraction with SDS extracted the protein's binding membrane.

Literature Cited

Abasery, A.M. 1992. Electrophoretic and Biochemical Studies on Oil Seed Proteins. M. Sc. Thesis, Tanta University, Tanta, Egypt.

Barton, K.D., J.F. Thompson, J.T. Madison, R. Rosenthal, N.P. Jarvis, and R.N. Beachy. 1982. The biosynthesis and processing of high molecular weight precursors of soybean glycinin subunits. J. Biol. Chem. 257: 6089_6095.

Chlan, C.A., J.B. Pyle, A.B. Legocki, and L. Dure. 1986. Sequences and genomic organization of the L-globulin (vicilin)


Botanical Bulletin of Academia Sinica, Vol. 40, 1999

Mol. Biol. 6: 161_169.

Wright, D.J. and D. Boulter. 1974. Purification and subunit structure of legumin of Vicia faba L. (broad bean). Biochem. J. 141: 413_418.

Youle, R.J. and A.H.C. Huang. 1981. Occurence of low molecular weight and high cysteine containing albumin storage proteins in oilseeds of diverse species. Amer. J. Bot. 68(1): 44_48.

Tumer, N.E., V.H. Thanh, and N.C. Nielsen. 1981. Purification and characterization of mRNA from soybean seeds. J. Biol. Chem. 256: 8756_8760.

Tumer, N.E., J.D. Richter, and N.C. Nielsen. 1982. Structural characterization of the glycinin precursors. J. Biol. Chem. 757: 4016_4018.

Walburg, G. and B.A. Larkins. 1986. Isolation and characterization of cDNAs encoding and 12s globulin mRNAs. Plant

¨È³ÂºØ¤l¤º³J¥Õ½è¤§µÑ¨ú»P¹qªa©w©Ê

Reda Helmy Sammour

Department of Botany, Faculty of Science
Tanta University, Tanta, Egypt

¨È³ÂºØ¤l¤º³J¥Õ½è¶i¦æ©w©Ê¤Î©w¶q¤ÀªR¡A©w©Ê¤ÀªR¥D­n§Q¥Î¤@¨t¦Cªº¹qªa§Þ³N¥]¬A sodium dodecyl-sulphate polyacrylamide gel electrophoresis (SDS-PAGE)¡Bsodium dodecylsulphate porosity gradient polyacrylamide gel electrophoresis (SDS-Poro-PAGE)¡Btwo dimension sodium dodecylsulphate polyacrylamide gel electrophoresis (2-D SDS-PAGE)¡Bisoelectric focusing ¤Î mapping gels¡C§Q¥Î¤ô¡B½w½Ä²G¡B§¿¯À¡B¤Î SDS µÑ¨úºØ¤l¤º³J¥Õ½è¡A¨Ã¦b«DÁ٭쪬ºA¤U¥H SDS-PAGE ¤Î Poro-SDS-PAGE ¤ÀªR¡Aµ²ªGÅã¥Ü¦³¤»­Ó¥D ­n³J¥Õ½è±a¡A¤À¤l¶q¤À§O¬° 55 kDa¡B50 kDa¡B47 kDa¡B45 kDa¡B43 kDa ¤Î 41 kDa¡C¥H 2-mercaptoethanolÁÙ­ì«á¡A³o¨Ç³J¥Õ½è±a§Î¦¨¤jªº¨ã»Ä©Ê¤À¤l¶q¬ù¬° 40 kDa ¤Î¤pªº¨ãÆP©Ê¤À¤l¶q¬ù¬° 20 kDa ¤§§Ç¦C(chains)¡C¨È³ÂºØ¤l¤º³J¥Õ½è¤§ pI ­È¡A¤À¥¬¦b©Ò¨Ï¥Î¤§ pH 3_10 ½d³ò¤º¡A¥H mapping gels ¤ÀªRÅã¥Ü³o¨Ç ¥D­n³J¥Õ½è±a¤]¬O¬Û·í²§½è¤Æ¡C©w¶q¤ÀªRºØ¤lÄѯ»¤º¤£¦PºØÃþ³J¥Õ½è§t¶q¡A¥Õ³J¥Õ¡B²y³J¥Õ¡B¾J·»³J ¥Õ¡B©M½\³J¥Õ§t¶q¤À§O¬° 197 ± 19¡B196 ± 12¡B32 ± 7 ¤Î 65 ± 6 mg/g¡C

ÃöÁäµü¡G ¥Õ³J¥Õ¡F²y³J¥Õ¡F Kilodalton (kDa)¡F2-mercaptoethanol (2-ME)¡F¤À¤l¶q¡FÂù¦V¹qªa¡C