Bot. Bull. Acad. Sin. (1999) 40: 159-164

Hur et al. — Genetic diversity of G. japonica

Genetic diversity and population structure of Gleditsia japonica var. koraiensis in Korea

Man Kyu Huh1,3, Hak Young Lee2, and Hong Wook Huh1

1Department of Biology Education, Pusan National University, Pusan, 609-735, The Republic of Korea

2Department of Biology, Chonnam National University, Kwangju 500-757, The Republic of Korea

(Received June 29, 1998; Accepted September 23, 1998)

Abstract. Enzyme electrophoresis was used to estimate genetic diversity and population genetic structure of Gleditsia japonica var. koraiensis in Korea. Eleven of the 17 loci (64.7%) showed detectable polymorphism. Genetic diversity (0.247) was higher than average for species with similar life history traits. Analysis of fixation indices, calculated for all polymorphic loci in each population, showed a substantial deficit of heterozygotes relative to Hardy-Weinberg expectations. This deficit is partly associated with inbreeding which is due to consanguineous and selfing mating. The average GST for polymorphic loci was 0.145, indicating that most (85.5%) of the genetic diversity occurred within populations. The indirect estimate of gene flow based on mean GST was moderate (Nm = 1.24). Given limited gene flow, populations are expected to diverge genetically due to drift, the random loss of alleles due to small population size.

Keywords: Genetic diversity; Gleditsia japonica; Population structure.

Introduction

During the past 20 years, enzyme electrophoresis has been used to describe the population genetic structure of over 700 plant taxa (Hamrick and Godt, 1989). This information has contributed greatly to an understanding of the evolutionary history of individual species and related group of species (Haufler, 1987) and has provided insights into the relationships between allozyme diversity and life-history traits (Loveless and Hamrick, 1984; Kiang and Chiang, 1990). Recently, allozyme studies of woody angiosperms have found that these plants are comparable to conifers with respect to their ecological and/or life history trait (e.g. Schnabel and Hamrick, 1990a,b; Sherman-Broyles et al., 1992). These studies have shown that such angiosperms have high levels of genetic variation, and a low proportion of their genetic diversity is among populations. Generalizations derived from the allozyme literature provide a basis on which to build sound programs for the conservation of genetic diversity of rare and endangered species (Hamrick et al., 1991). In addition, allozyme diversity can be used as a yardstick to measure the effectiveness of in situ and ex situ conservation programs (Hamrick et al., 1991). Despite the importance of knowledge on genetic variation for providing information for conservation purposes, detailed studies of genetic variation are not available for most native taxa in China and Korea, particularly woody plants (Kang and Chung, 1997). In addition, almost no information is available from flora-rich countries in Africa or from China (Bennett and Leich, 1995).

Gleditsia japonica Miquel var. koraiences Nakai is a polygamous woody plant that is distributed in natural habitats of mountains. It has a strong spike in stem and branches, and polygamous flowers are present in separate inflorescences. Gleditsia japonica var. koraiences is not an abundant plant over its range in Korea (Hur and Lee, personal observation). Furthermore, young plants are rare in most populations. Population size is highly variable, ranging from a few individuals at the margins of forests to several dozen plants in valleys on high-elevated mountains. Populations that are reproductively isolated may gradually exhibit genetic differentiation. The rapid loss of new plants results in the permanent loss of gene pools with potential applications in medicine and species conservation. Gleditsia japonica var. koraiensis is an economically useful species in China and Korea, as the seeds have been used in medicine. The purposes of this paper are: 1) to estimate how much total genetic diversity is maintained in the species, 2) to describe how genetic variation is distributed within and among populations, and 3) to compare our estimates with those for species having very similar life history traits.

Materials and Methods

Sampling Procedure and Enzyme Electrophoresis

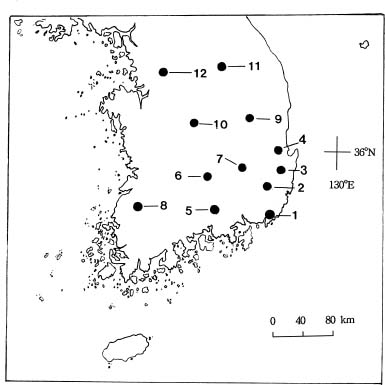
Seeds of Gleditsia japonica Miquel var. koraiensis Nakai were collected from twelve natural populations in Korea between 1995 and 1996 (Figure 1). Twenty to thirty legumes were collected from each population, and one seed from each legume was used in this study. Seeds were moistened with 98% sulphuric acid for 30 min, rinsed with tap water, and incubated at 20°C for germination. Ger

3Corresponding author. Tel: 51-510-2698; Fax: 82-51-514-8576.


Botanical Bulletin of Academia Sinica, Vol. 40, 1999

ferences in allele frequencies among populations for each locus (Workman and Niswander, 1970). Nei's genetic identity (I) was calculated for each pairwise combination of populations (Nei, 1973).

Principal components analysis (PCA) using the NT-SYS-pc program (Rohlf, 1987) helped evaluate the phenetic interpopulational relationships based on allele frequency distributions, with only polymorphic loci included in the analysis. The PC-SAS program (SAS Institute Inc., 1989) was used to conduct a cluster analysis on genetic identities via the unweighted pairwise groups method using an arithmetic average (UPGMA).

The genetic structure within and among populations was also evaluated using Wright's (1965) F-statistics FIT, FIS, and FST. The FIT and FIS coefficients measure excesses of homozygotes or heterozygotes relative to the panmictic expectations within the entire sample and within populations, respectively. The FST coefficient estimates relative population differentiation. Deviations of FIT and FIS from zero were tested using c2-statistics (Li and Horvitz, 1953). Two indirect estimates of gene flow were calculated. One estimate of Nm (the number of migrants per generation) was based on GST (Wright, 1951), and the other was based on the average frequency of "rare" alleles found in only one population (Slatkin, 1985; Barton and Slatkin, 1986). The absolute population differentiation (Dm) was calculated using the formula: Dm = sD ST / (s-1), where s is the number of subpopulations in the analysis and DST is the genetic diversity among population (Nei, 1973).

Results

Genetic Diversity

Eleven of the 17 loci (64.7%) showed detectable polymorphism in at least two populations. The remaining six loci (Pgd-3, Fe-1, Mdh-2, Mdh-3, Me-2 and Per-2) were monomorphic in all populations. An average of 52.9% of the loci were polymorphic within populations, with individual population values ranging from 47.1% to 58.8% (Table 1). The average number of alleles per locus (A) was 1.75 across populations, ranging from 1.59 for the population with the lowest number of alleles to 1.82 for the population with the highest number of alleles. The effective number of alleles per locus was similar at the species and the population level (Aes = 1.61; Aep = 1.51). The mean genetic diversity within population was 0.247. Population 5 had the highest expected diversity (0.289) while Population 7 had the lowest (0.193). Genetic diversity at the species level and population level was higher than average values of species with similar life history traits.

Genetic Structure

Wright's F statistics showed that significant deficiencies of heterozygotes exist for all loci at the population level (FIS = 0.467) and the sample as a whole (FIT= 0.554) (Table 2). The value of FIS varied from 0.190 (Idh-1) to

Figure 1. Collection localities for populations of Gleditsia japonica as source for isozyme analysis.

minating seeds were collected and homogenized with phosphate buffer as described by Soltis et al. (1983). Electrophoresis was performed using 12% starch gel. Gel and electrode buffers systems and enzyme staining procedures from Soltis et al. (1983) were used to assay seven enzyme systems. Putative loci were designated sequentially, with the most anodally migrating isozyme designated `1', the next `2', etc. Likewise, alleles were designated sequentially with the most anodally migrating allozyme designated `a' and progressively slower forms `b', `c', and so on. The G. japonica isozymes expressed phenotypes that were consistent in subunits structure and genetic interpretation with most isozyme studies in plants, as documented by Weeden and Wendel (1989).

Data Analysis

Four standard genetic parameters were estimated using a computer program developed by M.D. Loveless and A. Schnabel; percent polymorphic loci (P), mean number of alleles per locus (A), effective number of alleles per locus (Ae), and gene diversity (He) (Hamrick et al., 1992). Ae was calculated as the reciprocal of the sum of squares of allele frequencies. Subscripts refer to species (s) or population (p) level parameters. Observed heterozygotes (Ho) was compared to the Hardy-Weinberg expected value using Wright's fixation index (F) or inbreeding coefficients (Wright, 1922). These indices were tested for deviation from zero by c2-statistics (Li and Horvitz, 1953).

Nei's gene diversity formulae (HT, HS, DST, and GST) were used to evaluate the distribution of genetic diversity within and among populations (Nei, 1973, 1977). In addition, c2-statistics were used to detect significant dif


Hur et al. — Genetic diversity of G. japonica

Table 1. Percentage of polymorphic loci (P), mean number of alleles per locus (A) and polymorphic locus (Ap), effective number of alleles per locus (Ae), observed heterozygosity (Hop), Hardy-Weinberg expected heterozygosity or genetic diversity (Hep) for twelve populations of G. japonica.

Popa Nb P A Ap Ae Hop (SD) Hep (SD)

1 29 58.82 1.76 2.30 1.56 0.147 (0.019) 0.262 (0.063)

2 20 58.82 1.76 2.30 1.49 0.143 (0.022) 0.242 (0.061)

3 22 52.94 1.76 2.44 1.50 0.132 (0.021) 0.242 (0.062)

4 26 47.06 1.76 2.63 1.58 0.108 (0.021) 0.258 (0.067)

5 28 58.82 1.71 2.20 1.58 0.149 (0.023) 0.289 (0.061)

6 24 47.06 1.65 2.38 1.45 0.157 (0.025) 0.224 (0.062)

7 20 52.94 1.76 2.44 1.37 0.109 (0.021) 0.193 (0.059)

8 30 58.82 1.82 2.40 1.60 0.165 (0.021) 0.262 (0.063)

9 20 47.06 1.76 2.63 1.45 0.154 (0.026) 0.233 (0.060)

10 21 52.94 1.76 2.44 1.58 0.121 (0.020) 0.277 (0.063)

11 20 47.06 1.82 2.75 1.59 0.146 (0.025) 0.255 (0.068)

12 20 52.94 1.59 2.11 1.43 0.102 (0.019) 0.230 (0.056)

Mean 22.5 52.94 1.75 2.42 1.51 0.136 (0.006) 0.247 (0.018)

aNumerical codes as in Figure 1.

bNumber of individuals in the sample.

Table 2. Total genetic diversity (HT), genetic diversity within population (HS), deviations of genotype frequencies from Hardy-Weinberg expectations over all populations (FIT) and within individual populations (FIS), proportion of total genetic diversity partitioned among populations (GST), and absolute population differentiation (Dm) of G. japonica.

Locus HT HS FIS FIT GST Dm

Adh 0.453 0.429 0.317 0.353 0.053** 0.026

Pgd-1 0.585 0.482 0.421 0.522 0.175*** 0.116

Pgd-2 0.588 0.569 0.319 0.341 0.032 0.020

Idh-1 0.148 0.082 0.190 0.552** 0.448* 0.072

Idh-2 0.437 0.421 0.360 0.384 0.037 0.018

Fe-2 0.545 0.501 0.583 0.617* 0.082*** 0.049

Fe-3 0.664 0.583 0.674 0.714** 0.122*** 0.088

Mdh-1 0.576 0.499 0.475 0.545 0.133*** 0.083

Me-1 0.191 0.078 0.659* 0.860** 0.590*** 0.123

Per-1 0.432 0.410 0.462 0.489 0.051 0.024

Per-3 0.140 0.124 0.677* 0.715* 0.119** 0.018

Mean 0.433 0.380 0.467 0.554 0.167 0.058

* = P < 0.05; ** = P < 0.01; *** = P < 0.001.

0.677 (Per-3). Significant positive FIS and FIT values were observed for all polymorphic loci. Total genetic diversity values (HT) varied between 0.140 (Per-3) and 0.664 (Fe-3), with an average overall polymorphic loci of 0.433. The interlocus variation within population genetic diversity (HS) was high: values ranged from 0.278 (Me-1) to 0.583 (Fe-3) with an average overall polymorphic loci of 0.380.

Analysis of fixation indices, calculated for all polymorphic loci in each population, showed a substantial deficiency of heterozygotes relative to Hardy-Weinberg expectations. For example, 98.1% of fixation indices were positive (104/106), and 40 of those departed significantly from zero (p < 0.05). In contrast, of only two negative indices, neither departed significantly from zero. On a per locus basis, the proportion of total genetic variation due to differences among populations (GST) ranged from 0.032 for Idh-2 to 0.448 for Idh-1 with a mean of 0.167, indicating that about 17% of the total allozyme variation was among populations. Thus, the majority of

genetic variance (83%) resided within populations. Based on a PCA of allele frequency data, some alleles (Adh a, Per-1 a and b, Per-3 b, and Fe-2 a and c alleles) with a restricted distribution occur in low/high frequency in several populations (Figure 2). These alleles may have promoted the population differentiation. Genetic identity values among pairs of populations ranged from 0.845 to 0.992. The similarity among populations can be seen in the UPGMA dendrogram, where total populations cluster at a below genetic distance of 0.821 (Figure 3). The indirect estimate of gene flow based on mean GST was moderate (Nm = 1.24), but estimate of gene flow based on private alleles was relatively low (Nm = 1.00). The absolute population differentiation (Dm) was 0.058. The correlation coefficient between genetic distance and geographical distance was significantly different from zero using the Mantel's test for all populations (r = 0.34), and about 88% of the variation in genetic distance seemed to be caused by unknown factors other than geographic distance.


Botanical Bulletin of Academia Sinica, Vol. 40, 1999

Discussion

Gleditsia japonica var. koraiensis maintains relatively high levels of allozyme variation compared to the average plant species. For example, its mean genetic diversity at 0.247 is substantially higher than that of temperate-zone species (0.146), long-lived woody perennial species (0.177), outcrossing-animal species (0.167), and also higher than species with widespread geographic ranges (0.202) (Hamrick and Godt, 1989). The percentage of polymorphic loci is 64.7%, which is higher than those of temperate-zone species (48.5%), species with widespread geographic ranges (43.8%), and outcrossing-animal species (50.1%), and it is similar to that of long-lived woody perennial species (64.7%) (Hamrick and Godt, 1989). These comparisons suggest that the genetic diversity levels of G. japonica are higher than its associates, the temperate-zone species. The mean genetic diversity of G. japonica is 0.247 (SD = 0.018). This is somewhat surprising when we consider that no specialized seed dispersal mechanism is known. Flowers are visited by insects, and the present-day populations of this species are discontinuous and isolated. Furthermore, most population sizes are very small (N < 30), and the many spikes in the stem and branches of this species may limit the access of animals to the fruits. In addition, the seed coat of legume is very strong and hard for animals to digest.

One of the most notable features of the genus Gleditsia is its high percentage of polymorphic loci per population and its genetic diversity (Schnabel and Hamrick, 1995). These values, even considering the small numbers of loci examined, are much higher than those reported for seed plants in general (p = 29.0%_57.7%; Hamrick and Godt, 1989). The relatively high level of genetic variation found in G. japonica is consistent with several aspects of its biology. First, geographic range has been shown to be strongly associated with the level of variation maintained within populations and at the species level (Hamrick and Godt, 1989). Widely distributed plant species tend to maintain more variation than more narrowly distributed species. Although G. japonica is mostly found in Korea, we dare to guess that the place of native species has been taken by the descendants of plant brought intentionally or accidentally from China or Japan. Second, the breeding systems of a species is an important determinant of variability at both the species and population level. Gleditsia japonica is outcrossing, insect-pollinated species. This combination is well-known to be associated with high levels of allozyme variation (Brown, 1979; Hamrick and Godt, 1989). Third, long-lived perennial species, like G. japonica, generally maintain relatively higher levels of variation than annuals and short-lived perennials. The observation of annual rings in G. japonica revealed that the stems were at least 40_50 years old.

Nei et al. (1975) have shown that the reduction in average heterozygosity per locus depends not only on the

Figure 2. Principal components analysis of allele frequencies from 12 populations of Gleditsia japonica. The first two principal components explained 50.6% and 14.5% of the total variance, respectively. Positions for OTUs (population) and variables (alleles) are presented. aa and ab: Adh a and b; pa, pb, and pc:Pgd-1 a, b and c; p2a, p2b, and p2c: Pgd-2 a, b and c; ia and ib:Idh a and b; i2a and i2b: Idh-2 a and b; f2a, f2b, f2c, and f2d:Fe-2 a, b, c and d; f3a and f3a: Fe-3 a and b; ma, mb, and mc: dh-1 a, b, and c; ra and rb: Per-1 a and b; r3a and r3b: Per-3 a and b.

Figure 3. A dendrogram showing the phylogenic relationships among the twelve populations of G. japonica, based on data of genetic distance obtained by starch gel electrophoresis.


Hur et al. — Genetic diversity of G. japonica

size of the population bottleneck, but also on the subsequent rate of population growth. If population growth is rapid, reduction in average heterozygosity is small, even given a small number of founder. Most population sizes in Korea have a tendency to decrease gradually because young individuals have not been shown in these populations and neighborhoods (authors obs.). Regardless of growth rate, however, populations undergoing bottlenecks tend to lose low frequency alleles, reducing polymorphism and the number of alleles per polymorphic locus (Godt and Hamrick, 1991). It is of interest to note that genetic structure in G. japonica is higher than that of gymnosperms (mean GST = 0.073) with characteristics that promote very high levels of gene flow. Disconcord is similar to that of G. triacenthos (FST = 0.059; Nm = 3.987; Schnabel and Hamrick, 1990b). Gleditsia triacanthos is also a long-lived, perennial, widespread, insect-pollinated tree species. Nevertheless, the two species differ strikingly in two respects: first, G. triacanthos is subdioecious whereas flowers of G. japonica are monoecious. Second, population sizes of G. triacanthos in the United States are greater than those of G. japonica in Korea. Its species in Korea habits about 12 population with less than 30 plants per population (Table 1). Given limited gene flow, populations are expected to diverge genetically due to drift, the random loss of alleles due to small population size (Wright, 1951). It is probable that a low level of gene flow indicted by the somewhat high degree of population differentiation has occurred historically and may be currently maintained by pollen and seed dispersal. While we have no exact information about the pollination mechanisms of the species, it is known that the seed is very hard and heavy.

The observed high, significant, and positive FIS value (0.467) indicates that homozygotes were significantly in excess. This high level of inbreeding can result from a variety of causes: positive assortive mating (i.e., preferential mating among similar genotypes) (Crow and Felsenstein, 1968), selection for homozygotes, family structure within a restricted neighborhood causing mating among relatives (Levin and Kerster, 1971, 1974), and the Wahlund effect, caused by the artificial grouping of individuals from different breeding populations. Because G. japonica is a bisexual species, it is expected that high inbreeding (FIS = 0.467), first of all, is due mainly to selfing. If breeding systems and Wahlund effect the population genetic structure, all FST values for polymorphic loci should show similar patterns in a single population. This pattern was partly observed in the analysis of fixation indices, calculated for all polymorphic loci in each population.

Literature Cited

Barton, N.H. and M. Slatkin. 1986. A quasi-equilibrium theory of the distribution of rare alleles in a subpopulation. Heredity 56: 409_415.

Bennett, M.D. and I.J. Leich. 1995. Nuclear DNA amount in angiosperms. Ann. Bot. 76: 113_176.

Brown, A.D.H. 1979. Enzyme polymorphism in plant populations. Theor. Biol. 15: 1_42.

Crow, J.F. and J. Felsenstein. 1968. The effect of assortative mating on the genetic composition of a population. Eugen Q. 15: 85_97.

Godt, M.J.W. and J.L. Hamrick. 1991. Genetic variation in Lathyrus latifolius (Leguminosae). Am. J. Bot. 78: 1163_1171.

Hamrick, J.L. and M.J.W. Godt. 1989. Allozyme diversity in plant species. In A.D.H. Brown, M.T. Clegg, A.L. Kahler, and B.S. Weir (eds.), Plant Population Genetics, Breeding, and Genetic Resources. Sinauer, Sunderland, MA, pp. 43_63.

Hamrick, J.L., M.J.W. Godt, D.A. Murawski, and M.D. Loveless. 1991. Correlations between species traits and allozyme diversity: implications for conservation biology. In D.A. Falk and K.E. Holsinger (eds.), Genetics and Conservation of Rare Plants. Oxford University Press, New York, pp. 75_86.

Hamrick, J.L., M.J.W. Godt, and S.L. Sherman-Broyles. 1992. Factors influencing levels of genetic diversity in woody plant species. New For. 6: 95_124.

Haufler, C.H. 1987. Electrophoresis is modifying our concepts of evolution in homosporous pteridophytes. Am. J. Bot. 74: 953_966.

Kang, S.S. and M.G. Chung. 1997. Genetic variation and population structure in Korean endemic species: IV. Hemerocallis hakuunensis (Liliaceae). J. Plant Res. 110: 209_217.

Kiang, Y.T. and Y.C. Chiang. 1990. Comparing differentiation of wild soybean (Glycine soja Sieb. & Zucc.) populations based on isozymes and quantitative traits. Bot. Bull. Acad. Sin. 31: 129_142.

Levin, D.A. and H.W. Kerster. 1971. Neighborhood structure in plants diverse reproductive methods. Am. Nat. 105: 345_352.

Levin, D.A. and H.W. Kerster. 1974. Gene flow in seed plants. Evol. Biol. 22: 130_139.

Li, C.C. and D.G. Horvitz. 1953. Some methods of estimating the inbreeding coefficient. Am. J. Hum. Genet. 5: 107_117.

Loveless, M.D. and J.L. Hamrick. 1984. Ecological determinants of genetic structure in plant populations. Ann. Rev. Ecol. Syst. 15: 65_95.

Nei, M. 1973. Analysis of gene diversity in subdivided populations. Proc. Natl. Acad. Sci. USA 70: 3321_3323.

Nei, M. 1977. F-statistics and analysis of gene diversity in subdivided populations. Ann. Hum. Genet. 41: 225_233.

Nei, M., T. Murayama, and R. Chakraborty. 1975. The bottleneck effect and genetic variability in populations. Evolution 29: 1_10.

Rohlf, F.J. 1987. The NTSYS-pc: Numerical Taxonomy and Multivariate Analysis System for the IBM PC Microcomputer and Compatibles. Applied Biostatistics, Setauket, NY.

SAS Institute, Inc. 1989. SAS/STAT User's Guide, Ver. 6, 4th eds., Vol 1. SAS Institute, Cary, 943 pp.

Schnabel, A. and J.L. Hamrick. 1990a. Comparative analysis of population genetic structure in Quercus macrocarpa and Q. gambelii (Fagaceae). Syst. Bot. 15: 240_251.

Schnabel, A. and J.L. Hamrick. 1990b. Organization of genetic diversity within and among population of Gledista


Botanical Bulletin of Academia Sinica, Vol. 40, 1999

triacanthos (Leguminosae). Am. J. Bot. 77: 1060_1069.

Schnabel, A. and J.L. Hamrick. 1995. Understanding the population genetic structure of Gledista triacanthos L.: The scale and pattern of pollen gene flow. Evolution 49: 921_931.

Sherman-Broyles, S.L., S.B. Broyles, and J.L. Hamrick. 1992. Geographic distribution of allozyme variation in Ulmus crassifolia. Syst. Bot. 17: 33_41.

Slatkin, M. 1985. Rare alleles as indicators of gene flow. Evolution 39: 53_65.

Soltis, D.E., H. Haufler, D.C. Darrow, and G.J. Gastony. 1983. Starch gel electrophoresis of ferns: A compilation of grinding buffers, gel and electrode buffers, and staining schedules. Am. Fern J. 73: 9_27.

Weeden, N.F. and J.F. Wendel. 1989. Genetics of plant isozymes. In D.E. Soltis and P.S. Soltis (eds.), Isozymes in Plant Biology. Dioscorides Press, Portland, OR, pp. 46_72.

Workman, P.L. and J.D. Niswander. 1970. Population studies on southern Indian tribes. II. Local genetic differentiation in the Papago. Am. J. Hum. Genet. 22: 24_49.

Wright, S. 1922. Coefficients of inbreeding and relationship. Am. Nat. 56: 330_338.

Wright, S. 1951. The genetical structure of populations. Ann. Eugen. 15: 313_354.

Wright, S. 1965. The interpretation of population structure by F-statistics with special regard to systems of mating. Evolution 19: 395_420.