Bot. Bull. Acad. Sin. (1999) 40: 251-257

Thseng et al. — Glycine formosana in Taiwan

Glycine formosana Hosokawa in Taiwan: pod morphology, allozyme, and DNA polymorphism

F.S. Thseng1, 3, S.J. Tsai1, J. Abe2, and S.T. Wu1

1Department of Agronomy, National Chung Hsing University, Taichung 402, Taiwan

2Laboratory of Plant Genetic Resources, Hokkaido University, Japan

(Received April 22, 1998; Accepted January 15, 1999)

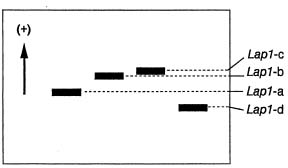
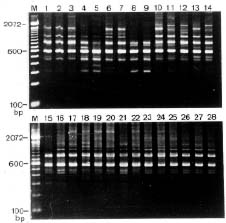
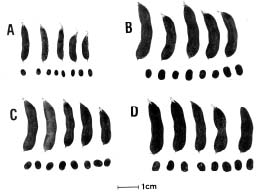
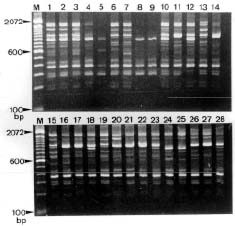
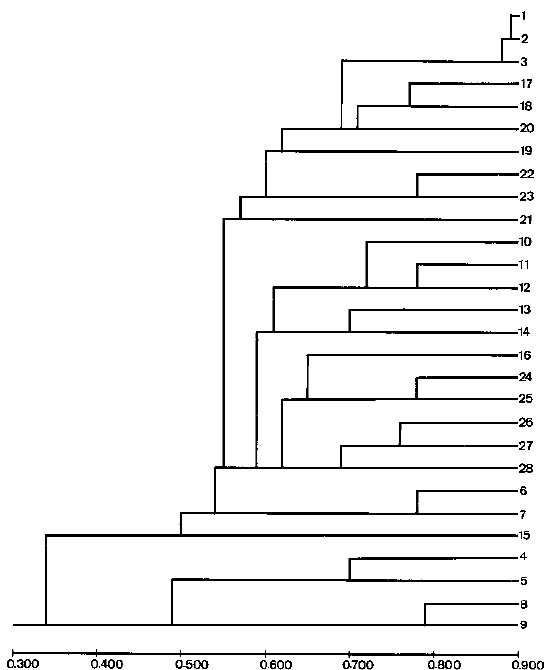
Abstract. Glycine formosana Hosokawa is distributed over the grassland along the riverside and roadside at Dahshi, Guanshi, and Herngshan in Taoyuan county, Taiwan. It is a twining annual herb. It was long considered to be of the same species as G. soja, distributed widely in East Asia. Because the plant showed a continuous variation with G. soja in appearance, Tateishi and Ohashi (1992) considered it a geographic subspecies and renamed it G. max subsp. formosana (Hosokawa) Tateishi et Ohashi. This study attempts to determine the differences between G. formosana and the G. soja collected in China, Korea, and Japan. The materials were planted at National Chung-Hsing University. The pods, allozymes, and DNA polymorphisms were investigated. Glycine formosana has small seeds which are significantly different from the G. soja in China, Korea, and Japan. Lap1-d — one of the 16 loci of 9 allozymes exists only in G. formosana. Twenty-five random sequence 10-mer primers were employed in RAPD analysis for all samples. Twenty-one produced bands, and 14 of those showed polymorphisms. One hundred and thirty-two bands were produced, and 84 bands (64%) showed polymorphisms. Based on the appearances of markers, the genetic similarity coefficients were calculated. Among different samples of G. formosana, few genetic variations were observed (0.885~0.887). However, G. formosana showed marked differences from G. soja in China and Korea and nested within the Japan accessions.

Keywords: Allozyme; DNA polymorphism; Glycine formosana; G. soja; Pod; Seed.

Abbreviation: RAPD, random amplified polymorphic DNA.

Introduction

Glycine consists of many species in two subgenera, Soja and Glycine. Subgenus Soja includes G. max, a cultivated form, and G. soja, a wild relative. Subgenus Glycine has at least 17 species including G. albicans, G. arenaria, G. argyrea, G. canescens, G. clandestina, G. curvata, G. cytoloba, G. dolichocarpa, G. falcata, G. hirticaulis, G. lactovirens, G. latifolia, G. latrobeana, G. microphylla, G. pindanica, G. tabacina, and G. tomentella (Tindale, 1984, 1986a,b; Tindale and Craven, 1988, 1993; Tateishi and Ohashi, 1992).

Glycine soja is generally distributed in China, Japan, Korea, and Taiwan (Hymowitz and Newell, 1981). In 1924, Shimada collected a wild relative in Hsinchu and Dahshi, Taiwan, and recognized it as G. ussuriensis Regal et Maack (cf: Tang and Lin, 1962). Soon after, another wild relative was collected in Hsinchu, Chutong, and Herngshan. In 1932, Hosokawa identified and classified the latter as G. formosana Hosokawa. Not until 1962 did Tang, Lin, and Hermann identify the two wild relatives as the same species as G. soja. Huang and Ohashi (1977) replaced the name G. ussuriensis with G. soja Sieb. et Zucc.

In the mid-1980s, Ohashi et al. (1984) again replaced it with G. max subsp. soja (Sieb. et Zucc.) Ohashi. Recently, considering the characteristics of its leaf, flower, pod, and seed, Tateishi and Ohashi (1992) named this wild relative found in Taiwan as G. max subsp. formosana (Hosokawa) Tateishi et Ohashi. However, all of the above were based on the result of plant morphology investigations. In contrast, this experiment is based on DNA and allozyme investigations.

Materials and Methods

Plant Materials

Three accessions (accession numbers 1~3) of G. formosana were collected from three counties in Taiwan, including Dahshi, Guanshi, and Hernshan. Each accession collected ten plants as a population from each county. Two accessions of G. soja were collected from Korea (accession numbers 4~5), four from China (accession numbers 6~9), and nineteen from Japan (accession numbers 10~28). Twenty seeds were randomly selected from each accession. The seeds served as base materials in this experiment. First, their coatings were pierced, and then the seeds were planted on plastic plates. When the seedlings had grown to about three centimeters, they were moved to pots; two in each pot and ten pots for each

3Corresponding author. Fax: (04) 286-2171.


Botanical Bulletin of Academia Sinica, Vol. 40, 1999

accession. In the flowering stage, for each accession, we took five pots and collected their leaves for DNA extraction; the pods and seeds of the other five pots were harvested when matured.

Extraction of DNA

DNA was extracted using a modified version of the method of Doyle et al. (1990). Leaf materials (1 g fresh weight) were ground to fine powder in liquid nitrogen. The powdered leaf tissue was transferred to a beaker, and 5 ml of pre-heated extraction buffer [2% CTAB (Hexadecyltrimethyl-ammonium bromide, C19H42BrN); 1.4 M NaCl; 0.2% 2-mercaptoethanol; 20 mM EDTA; and 1,000 mM Tris-HCl pH=0.8] was added. After 20 min at 60°C, 5 ml of chloroform-isoamyl alcohol was added, and the upper clear part of the solution was collected by centrifugation at 6,000 g (4°C, 10 min). Then, 5 ml of chloroform-isoamyl alcohol was again added, and the cell debris was removed by another 10 min of centrifugation at 4°C. The DNA was precipitated by the addition of 3.3 ml of isopropanol and recovered by centrifugation for 5 min at 10,000 g after incubation in a freezer (-20°C) overnight. The pellet was dried and re-dissolved in 2 ml TE [10 mM Tris-HCl pH=7.4, 1 mM EDTA], 0.2 ml 2 M NaCl, and 5 ml alcohol (95%). Then, the precipitate was collected by centrifugation at 10,000 g for 10 min at 4°C. The pellet was re-dissolved in 1 ml TE. Contaminating RNA was removed by digestion with 1 µg RNase (10 mg/ml) for 30 min at 37°C. 100 µl of 4.4 M ammonium acetate and 2.5 ml alcohol (95%) were then added. After 30 min at -20°C, the sample was centrifuged for 10 min. The final pellet was dissolved in 0.2 ml TE buffer, and the DNA concentration was determined using a fluorometer and following the procedures supplied by the manufacturer. The extracted DNA was stored at 4°C in a cooler.

RAPD Amplification

A set of 25 10-mer primers (#1~#25) obtained from the University of British Columbia were used in the reactions with G. soja and G. formosana. Each of them was then reacted with COY TempCycler 2 (COY Corporation). Components for PCR reaction and PCR reaction cycles are shown in Table 1 and 2. Fragments generated by amplification were separated according to size on 2% agarose gels run in 0.5×TBE buffer [0.089 M Tris-borate, 0.089 M

Table 2. PCR reaction cycles.

Step Temperature (°C) Time (min) Cycles

1 94 2

42 2 1

72 2

2 94 1

42 1 40

72 1

3 94 1

42 1 1

72 2

boric acid, 0.002 M EDTA], stained with ethidium bromide, examined optically with ultraviolet illumination, and photographed with Polaroid film 667.

Data Analysis

Fragments generated by amplification were separated in 2% agarose gel and photo-recorded. Clearly identifiable bands were analyzed. Using each individual plant as an OTU (operational taxonomic unit), the similarity coefficients of 28 samples of G. soja and G. formosana were generated. Data were scored for computer analysis on the basis of the presence or absence of the amplified products. If a product was present in genotype, it was designated "1". If absent, it was designated "0". Jaccard's coefficients were generated based on Jaccard's definition (1908). Using the NT-SYS (Rohlf et al., 1971) computer program, the similarity coefficients were then used to construct a dendrogram by UPGMA (unweighted pair group method with arithmetic mean).

Enzyme System Analysis

Seeds from each accession (three seeds for each) were chosen to perform the following nine enzyme system examination: Aco1, Aco2, Aco3, Aco4, and Aco5 (aconitase); Ap (acid phosphatase); Dia1 (diaphorase); Lap1 (leucine aminopetidasw); Enp (endopeptidase); Est1 (esterase); Idh1 and Idh2 (isocitrare dehydrogenase); Mpi (mannose phosphate isomersae); Pgm1, Pgm2, and Pgm3 (phosphoglucomutase). Isozyme assays were adapted from Griffin and Palmer (1987). Two electrophoretic buffer systems were used. One was the Histidine-citrate (pH= 6.5, D buffer by Cardy and Beversdorf, 1984), and the other was a modification of the method by Second (1982), which consists of 5 mM histidine HCl, 16 mM Tris-Histidne pH= 7.0 (gel buffer), 400 mM Tris, 132 mM citric acid HCl pH= 7.0 (electrode buffer). Electrodphoresis was conducted for five hours under a constant voltage of 250V in the first system, and for six hours under a constant current of 25mA in the second system. The enzymes visualized using the first system were ACO, APH, DIA, and IDH. The enzymes visualized using the second system were PGM, MPI, ENP, EST, and LAP. The staining procedure for these enzymes was adapted from Griffin and Palmer (1987) and Bult and Kiang (1989).

Table 1. Reaction mixture used in RAPD analysis.

Components Volume (µl) Concentration

Sterile water 15.2

10× buffer 2.5 1×

2.5 mM dNTP 2.5 0.25 mM

1.5 µM primer 3.3 0.2 µM

50 ng/µl Genomic DNA 1 2 ng/µl

2 U/µl Taq 0.5 0.04 µ/µl

(Dynazyme TM, Finnzymes Inc.)


Thseng et al. — Glycine formosana in Taiwan

Results and Discussion

The pods are shown in Figure 1. Pods from Taiwan are the smallest, with those from China somewhat larger and those from Korea and Japan the largest. A maximum of three seeds are in each pod of the four populations, and the seeds are oval in shape. The smallest seeds are found in the Taiwanese population while the seeds of the others are larger. This result resembles that of Abe et al. (1994) and Tateishi and Ohashi (1992). Glycine formosana from Taiwan doesn't show a continuous variation with the accessions from other locations in seeds sizes.

Sixteen loci of the allozymes of G. formosana were tested. All plants tested exhibited the same genotype, and no within-population or between-population genetic variation in accessions was detected. This is consistent with the results of Yiu (1993), which found no variations within-population (thirty accessions in each population) or between-population (three populations) in G. formosana for five allozymes. However, these results are in contrast with the findings obtained for G. soja distributed in China, Korea, and Japan, where most populations were an aggregation of different homozygotes for several loci. The paucity of allozyme variation in G. formosana suggests a severe genetic bottleneck it might have passed during evolution. The alleles observed in G. formosana are as follows: Aco1-a, Aco2-1, Aco3-a, Aco4-a, Ac05-a, Ap-a, Dial-a, Enp-a, Est1-b, Idh1-b, Idh2-b, Lap1-d, Mpi-b, Pam1-a, Pam2-b, and Pam3-b. Comparing this result with the different homozygotes shown in G. soja distributed in China, Korea, and Japan on some alleles, all have been detected in G. soja besides Lap1-d (Abe et al., 1992). This allozyme found on the Lap1-d allele of G. formosana codes for the slowest moving mobility variant (Figure 2). The Lap1-d allele has not been detected in those populations of subsp. soja and subsp. max originating in China, Korea, and Japan so far (Kiang et al., 1987; Perry et al., 1991; Abe et al., 1992; Hirata et al., 1994). As a result, the Lap1-d

Figure 2. Mobility variant of the leucine aminopetidase Isozyme in G. formosana.

Figure 3. RAPD profile of DNA from 28 samples of G. formosana and G. soja using primer #4. M, DNA marker. Note: Numbers indicated in this figure are the same as in Table 4.

allele may be an important marker in determining the taxonomy and origin of G. soja while at the same time suggesting an allied relationship among G. formosana, subsp. max, and subsp. soja.

Twenty-five primers were used in the RAPD analysis performed on three G. formosana samples and twenty five G. soja samples. The results of primer #4 are shown in Figure 3. Among thirteen bands, nine of them showed polymorphism. All samples produced 450 bp, 480 bp, 580 bp, and 800 bp bands. A 300 bp band was present in the Korea and China accessions and was absent in the other samples. Three samples from Taiwan had the same bands and had at least one DNA cluster different from the other twenty-five samples. Figure 4 presented the result of primer #25. Twelve out of thirteen bands showed polymorphism. A 380 bp band is present in all samples. Three samples from Taiwan again had the same bands, and all produced thirteen bands. Nine bands were different

Figure 1. Seed and podmorphology of G. formosana and G. soja. A, G. formosana from Taiwan; B, G. soja from Korea; C, G. soja from China; D, G. soja from Japan.


Botanical Bulletin of Academia Sinica, Vol. 40, 1999

accession) had the lowest degree of similarity (0.176), and the three Taiwanese samples had the highest degree of similarity (0.887). Based on the matrix, cluster analysis was performed using UPGMA. The results are shown in Figure 5. Apparently, two clusters were identified. The first cluster contained twenty-four accessions including all those from Japan (acc. No. 10~28, except 15) and Taiwan (acc. No. 1~3). Another cluster with four accessions included accessions 4 and 5 collected from Korea and accessions 8 an 9 collected from northeastern China. These results indicated that G. formosana nested well within all the G. soja accessions from Japan and that results of accessions from Korea and northeastern area of China were close.

Figure 4. RAPD profile of DNA from 28 samples of G. formosana and G. soja using primer #25. M, DNA marker. Note: Numbers indicated in this figure are the same as in Table 4.

among the Taiwanese accessions and two Korean samples, two among the Taiwanese accessions and two of the four Chinese samples, eight among the Taiwanese accessions and the other two Chinese samples, and two to six among the Taiwanese accessions and the Japanese accessions.

Of the twenty-five primer reactions, four had no products and twenty-one had amplified DNA products. Among those twenty-one primers, fourteen were polymorphic. One hundred and thirty-two DNA products were amplified in those fourteen primers, which showed polymorphism. As shown in Table 3, 84 products (64%) showed polymorphism. Those 84 products were used in the construction of a matrix in which "1" and "0" were inserted according to the presence or absence of amplified products. Similarity coefficients were then generated according to Jaccard's definitions (Table 4). The degree of similarity is between 0.176 and 0.887. Sample 8 (the Chinese accession) and sample 19 (the Japanese

Figure 5. Dendrogram of G. formosana and G. soja constructed based on Jaccard's similarity coefficients by using UPGMA method. Note: Numbers indicated in this figure are the same as in Table 4.

Table 3. Primers utilized in RAPD analysis of G. formosana and G. soja. The total number of DNA fragments (bands) amplified and the number that polymorphic are given for each primer.

U.B.C. Sequence Total bands U.B.C. Sequence Total bands

primers (5' to 3') (no. polymorphic) primers (5' to 3') (no. polymorphic)

#1 CCTGGGCTTC 9 (6) #9 GGTGGCGGGA 6 (4)

#2 CCTGGGCTTG 12 (9) #11 CCTGGGCCTC 8 (4)

#3 CCTGGGCTGG 11 (8) #12 GGGCCGTTTA 9 (6)

#4 CCTGGGTTCC 13 (9) #13 GCCCGGTTTA 8 (5)

#6 CCTGCGCTTA 6 (3) #15 CCTGGGTTTG 8 (4)

#7 CCTGGGGGTT 9 (5) #21 TCCGGGTTTG 11 (5)

#8 CCTGGGTTTG 9 (4) #25 ACCGGGTTTC 13 (12)

Total 132 (84)


Thseng et al. — Glycine formosana in Taiwan

Table 4. Similarity matrix for 28 samples of G. formosana and G. soja Jaccard's coefficient range of values from 0 to 1.0, with values closer to 1.0 indication increasing similarity.

Accession 1 2 3 4 5 6 7 8 9 10 11 12 13 14 15 16 17 18 19 20 21 22 23 24 25 26 27 28 No.

1 1.00 2 0.89 1.00 3 0.89 0.87 1.00 4 0.39 0.40 0.41 1.00 5 0.42 0.42 0.41 0.71 1.00 6 0.60 0.59 0.61 0.49 0.52 1.00 7 0.60 0.57 0.61 0.46 0.46 0.78 1.00 8 0.24 0.25 0.28 0.46 0.45 0.32 0.24 1.00 9 0.27 0.27 0.31 0.54 0.54 0.30 0.27 0.79 1.00 10 0.52 0.49 0.55 0.43 0.36 0.55 0.48 0.35 0.32 1.00 11 0.56 0.53 0.59 0.42 0.37 0.55 0.48 0.26 0.27 0.73 1.00 12 0.62 0.59 0.65 0.42 0.33 0.58 0.53 0.31 0.30 0.71 0.78 1.00 13 0.57 0.56 0.55 0.37 0.32 0.48 0.43 0.31 0.32 0.52 0.64 0.71 1.00 14 0.58 0.55 0.57 0.48 0.45 0.54 0.47 0.30 0.34 0.59 0.60 0.61 0.70 1.00 15 0.59 0.56 0.57 0.42 0.33 0.39 0.35 0.32 0.33 0.43 0.47 0.50 0.61 0.58 1.00 16 0.62 0.59 0.61 0.43 0.43 0.59 0.52 0.28 0.31 0.55 0.64 0.58 0.58 0.67 0.59 1.00 17 0.74 0.68 0.72 0.39 0.35 0.61 0.56 0.27 0.28 0.60 0.66 0.67 0.60 0.64 0.64 0.75 1.00 18 0.68 0.65 0.69 0.33 0.31 0.52 0.52 0.18 0.21 0.57 0.66 0.64 0.54 0.63 0.51 0.64 0.77 1.00 19 0.57 0.56 0.58 0.36 0.26 0.46 0.44 0.18 0.21 0.48 0.52 0.53 0.46 0.49 0.48 0.53 0.64 0.69 1.00 20 0.69 0.68 0.68 0.39 0.35 0.49 0.49 0.26 0.29 0.51 0.57 0.58 0.58 0.54 0.59 0.61 0.72 0.69 0.70 1.00 21 0.54 0.51 0.57 0.38 0.31 0.56 0.52 0.26 0.29 0.46 0.53 0.56 0.53 0.57 0.55 0.62 0.64 0.60 0.61 0.64 1.00 22 0.56 0.51 0.57 0.35 0.32 0.52 0.52 0.19 0.21 0.54 0.51 0.52 0.39 0.50 0.40 0.55 0.62 0.70 0.59 0.62 0.53 1.00 23 0.59 0.55 0.59 0.38 0.33 0.49 0.57 0.19 0.22 0.53 0.49 0.52 0.44 0.53 0.32 0.50 0.57 0.69 0.61 0.59 0.53 0.78 1.00 24 0.59 0.58 0.59 0.46 0.46 0.60 0.46 0.30 0.31 0.62 0.63 0.64 0.49 0.63 0.47 0.67 0.61 0.61 0.46 0.53 0.55 0.51 0.49 1.00 25 0.62 0.61 0.65 0.47 0.44 0.58 0.56 0.33 0.34 0.60 0.64 0.65 0.55 0.61 0.48 0.63 0.70 0.67 0.47 0.54 0.52 0.52 0.57 0.78 1.00 26 0.55 0.52 0.59 0.49 0.41 0.61 0.59 0.37 0.38 0.67 0.60 0.66 0.55 0.62 0.48 0.64 0.66 0.57 0.44 0.54 0.52 0.57 0.54 0.65 0.69 1.00 27 0.55 0.54 0.55 0.51 0.38 0.64 0.58 0.28 0.32 0.69 0.59 0.66 0.52 0.59 0.73 0.60 0.63 0.57 0.48 0.55 0.51 0.59 0.59 0.67 0.66 0.77 1.00 28 0.44 0.43 0.43 0.48 0.35 0.56 0.56 0.29 0.30 0.46 0.47 0.53 0.47 0.48 0.36 0.58 0.51 0.49 0.43 0.46 0.48 0.51 0.54 0.52 0.55 0.71 0.67 1.00

Note: Acc. No. 1~3: formosana from Taiwan; 4~5: soja form Korea; 6~9: soja from China; 10~28: soja from Japan.


Botanical Bulletin of Academia Sinica, Vol. 40, 1999

Kiang, Y.T., Y.C. Chiang, J.Y. Doong, and M.B. Gorman. 1987. Genetic variation of soybean germplasm. In S.C. Hsieh (ed.), Crop Exploration and Utilization of Genetic Resources. Taichung, Dist. Agri. Improv. Sta. Taiwan, pp. 93-99.

Ohashi, H., Y. Tateishi, T.C. Huang, and T.T. Chen . 1984. Taxonomic studies on the Leguminosae of Taiwan I. Sci. Rep. Tohoku Univ. 4th ser. (Biol.) 38: 277-334.

Perry, M.C., M.S. Mcintosh, and A.K. Syoner. 1991. Geographical Patterns of variation in the USDA soybean germplasm collection: II. Allozyme frequencies. Crop. Sci. 31: 1356-1360.

Rohlf, F., J. Kishpaugh, and D. Kirk. 1971. NT-SYS. Numberical Taxonomy System of Multivariate Statistical Programs. Tech Rep. State Univ. New York at Stony Brook, New York.

Second, G. 1982. Origin of the genetic diversity of cultivated rice (Oryza ssp.): study of polymorphism scored at 40 isozyme loci. Jpn. J. Genet. 57: 25-57.

Tang, W.T. and C.C. Lin. 1962. Studies on the characteristics of some Glycine ssp. found in Taiwan. J. Agri. Asso. China. 37: 15-19.

Tateishi, Y. and H. Ohashi. 1992. Taxonomic studies on Glycine of Taiwan. J. Jpn. Bot. 67: 127-147.

Tindale, M.D. 1984. Two new eastern Australian species of Willd. (Fabaceae). Brunonia 7: 207-213.

Tindale, M.D. 1986a. A new North Queensland species of Glycine willd. (Fabaceae). Brunonia 9: 99-103.

Tindale, M.D. 1986b. Taxonomic notes on three Australian and Norfolk Island species of Glycine willd. (Fabaceae: Phaseoleae) including the choice of a neotype for G. clandestina Wendl. Brunonia 9: 179-191.

Tindale, M.D. and L.A. Craven. 1988. Three new species of Glycine (Fabaceae: Syst. Phaseoleae) from North-western Australia, with notes on amphicarpy in the genus. Aust. Syst. Bot. 1: 399-410.

Tindale, M.D. and L.A. Craven. 1993. Glycine pindanica (Fabaceae, Phaseolae), a new species from West Kimberley, Western Australia. Aust. Syst. Bot. 6: 371-376.

Yiu, T.J. 1993. Intraspecific variation of wild soybean, Glycine formosana, G. tabacina and G. tomentella in Taiwan. Doctor Dissertation. Chung Hsing University, 187 pp.

Acknowledgement. This work was supported by the National Science Council of the Republic of China (NSC 85-2321-B005-066, NSC 86-2321-B005-035).

Literature Cited

Abe, J., M. Ohara, and Y. Shimamoto. 1992. New electrophoretic mobility variants observed in wild soybean (Glycine soja) distributed in Japan and Korea. Soybean Genet. Newsl. 19: 63-72.

Abe, J., F.S. Thseng, T.J. Yiu, and Y. Shimamoto. 1994. Glycine max ssp. formosana (Hosokawa) Ohashi in Taiwan: Allozyme and seed morphology. Proc. 7th Congr. SABRAO, Taipei, Taiwan, pp. 61-65.

Bult, C.J. and Y.T. Kiang. 1989. Inheritance and genetic linkage tests of an esterase locus in the cultivated soybean, Glycine max. J. Hered. 80: 82-85.

Cardy, B.J. and W.D. Beversdorf. 1984. Identification of soybean cultivars using isozyme electrophoresis. Seed Sci. Technol. 12: 943-954.

Doyle, J.D., J.L. Doyle, and L.H. Bailey. 1990. Isolation of plant DNA from fresh tissue. Focus 12: 13-15.

Griffin, J.D. and R.G. Palmer. 1987. Inheritance and linkage studies with five isozyme loci in soybean. Crop Sci. 27: 885-892.

Hermann, F.J. 1962. A revision of the genus Glycine and its immediate allies. U.S. Dept. Argic., Techn. Bull. 1268: 1-82.

Hirata, T., M. Kaneko, J. Abe, and Y. Shimamoto. 1994. Genetic structure of cultivated soybeans in Japan. Proc. 7th Congr. SABRAO, Taipei, Taiwan, pp. 241-246.

Hosokawa, T. 1932. Notulae Leguminosarum ex Asiae Orientale II. J. Soc. Trop. Agric. 4: 308-316.

Huang, T.C. and H. Ohashi. 1977. Glycine. In Flora of Taiwan 3: 293-298.

Hymowitz, T. and C.A. Newell. 1981. Taxonomy of the genus Glycine, domestication and uses of soybeans. Econ. Bot. 35: 272-288.

Jaccard, P. 1908. Nouvelles recherches sur la distribution florale. Bull. Soc. Vaud. Sci. Nat. 44: 223-270.


Thseng et al. — Glycine formosana in Taiwan

¥xÆW³¥¥Í¤j¨§ Glycine formosana ºØ¤l§ÎºA¡B¦P¥\²§ºc ú@¤Î DNA ¦h§Î©Ê¤§¬ã¨s

´¿´I¥Í1 ½²¾Ë©v1 ªü³¡¯Â2 §d¸Ö³£1

1 °ê¥ß¤¤¿³¤j¾Ç¹AÃÀ¾Ç¨t

2 ¤é¥»¥_®ü¹D¤j¾Ç´Óª«¿ò¶Ç¸ê·½¹êÅç«Ç

Glycine formosana Hosokawa ¤À¥¬©ó¥xÆW®ç¶é¿¤Ãö¦è¡B¾î¤s¡B¤j·Ë¤@±a¤§¸ô®Ç¤Îªe®Ç¤§Äé¤ì¯ó­ì¦a¡A ¬°¤@Ãk½tÄñ¶©Ê±j¤§¤@¦~¥Í´Óª«¡C¹L¥h¤@ª½³Q»{¬°»P¤¤°ê¤Î¤é¥»ªº G. soja ¦PºØ¡C³Ìªñ¡A 1992 ¦~ Tateishi and Ohashi ®Ú¾Ú´Óª«§ÎºA¡A¦]»P G. soja §e³sÄòÅܲ§¡A¦Ó»{¬°¬O¦a²z¤Wªº¨ÈºØºÙ¬° G. max subsp. formosana (Hosokawa) Tateishi et Ohashi¡C¥»¸ÕÅ笰ÁA¸Ñ³oºØ³¥¥Í¤j¨§»P¤¤°ê¡BÁú°ê¤Î¤é¥»¤§ G. soja ªº®t²§¡A±N§÷ ®ÆºØ©ó¤¤¿³¤j¾Ç¡A¶i¦æ²óªG¡B¦P¥\²§ºc ú@¤Î DNA ¦h§Î©Ê¤§±´°Q¡CGlycine formosana ¤§ºØ¤l¸û¤p¡A»P¤¤ °ê¡BÁú°ê¤Î¤é¥»ªº G. soja ¦³ÅãµÛ®t²§¡C 9 ºØ¦P¥\²§ºcú@ 16 °ò¦]®y¤¤¡A¤@­Ó°ò¦]®y Lap1-d ¶È¦s©ó G. formosana¡C¥H 25 ±ø¤Þ¤l¹ï©Ò¦³ªº¼Ë¥»¶i¦æ RAPD ¤ÀªR¡A¦³ 21 ±ø¤Þ¤l²£¥Í DNA ©ñ¤j²£ª«¡A¨ä¤¤ 14 ±ø¤Þ¤l¤§²£ª«¨ã¦³¦h§Î©Ê¡C¦@²£¥Í 132 ±ø DNA ªº©ñ¤j²£ª«¡A¦³ 84 (64%) ±ø©ñ¤j²£ª«¨ã¦h§Î©Ê¡C¨Ì±ø±a¤§ ¥X²{­pºâ¦U¼Ë«~¶¡¤§¬Û¦ü«×±o¡GG. formosana ºØ¤º¬° 0.885~0.887¡A´X¥GµL¿ò¶ÇÅܲ§¡A¦Ó»P¤¤°ê¤ÎÁú°ê¦³ ®t²§¡A¦ý»P¤é¥»ªº G. soja ¶¡¸ûÃþ¦ü¡C

ÃöÁäµü¡G ²óªG¡F¦P¥\ú@ ¡FDNA ¦h§Î©Ê¡FGlycine formosana¡FG. soja¡C