Bot. Bull. Acad. Sin. (1999) 40: 311-317

Lee and Chung — Genetic variation in Sasamorpha borealis

High levels of genetic variation in Korean populations of Sasamorpha borealis (Poaceae)

Nam Won Lee and Myong Gi Chung1

Department of Biology, Gyeongsang National University, Chinju 660-701, The Republic of Korea

(Received June 2, 1998; Accepted April 1, 1999)

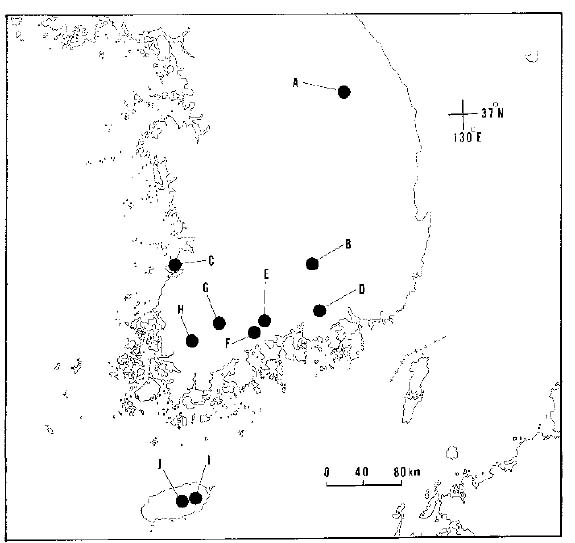
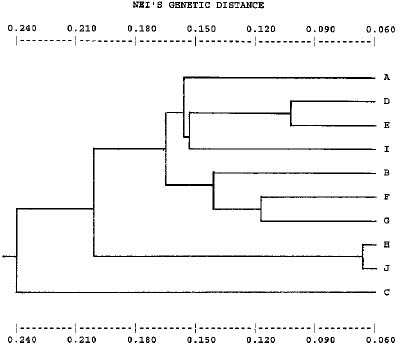
Abstract. Genetic and genotypic diversity of Korean populations in Sasamorpha borealis (Hack.) Nakai were investigated using allozymes as genetic markers. In Korea, S. borealis usually grows on hillsides under pine-oak understory. Many species of bamboos have the intermast period of "mast seeding." After spreading by extensive rhizomes for a specific period, nearly all adults in one area produce wind-pollinated flowers, set large quantities of seeds, and die. This study was undertaken to infer relationships between levels of genetic diversity and the reproductive biology of the species. Populations of S. borealis maintain high levels of genetic diversity: 51% of the loci examined were polymorphic and of mean genetic diversity (HeP = 0.219). The mean number of multilocus genotypes per population was 18.4, and the mean genotypic diversity index (DG) was 0.720. However, 31% of the total genetic variation was found among populations (GST = 0.310). Allele frequencies for all loci examined differed significantly among populations (p < 0.001). Average genetic identity for all pairs of populations was 0.833 (SD = 0.046). Indirect estimates of the number of migrants per generation (Nm) were 0.56 (calculated from GST) and 0.20 (calculated from the mean frequency of ten private alleles). Several biological and ecological traits found in S. borealis (widespread geographical distribution, long-lived habit, clonal reproduction with relatively high genotypic diversity, wind-pollinated breeding system, death of adults bearing large quantities of seeds, probable low gene flow among populations, selection for heterozyous genotypes in some of the sampled populations, the patterns of recolonization, effects of genetic drift, and local selective forces) may have played roles in shaping the population genetic structure of the species.

Keywords: Allozymes; Clonal diversity; Genetic diversity; Mast seeding; Sasamorpha borealis; Selection.

Introduction

Electrophoretic techniques for the study of clonal plants provide powerful genetic markers for recognizing individual plant genotypes (Berg and Hamrick, 1997). This approach has made it possible to better understand the spatial distributions of clones and the genotype diversity maintained within populations. According to a thorough review of studies of clonal plants (Ellstrand and Roose, 1987), species with predominantly vegetative reproduction generally have lower levels of genetic diversity than species that successfully produce progeny solely by sexual reproduction. Previous studies have revealed that vegetative reproduction and spread have a marked effect on the genetic structure of populations. As Eriksson (1993) pointed out, however, mechanisms for the maintenance of genetic variation in clonal plants are still controversial. For example, several results indicate that clonal reproduction could retard the loss of genetic diversity within populations because species with independent ramets could reduce the possibility of genet death (e.g., Parker and Hamrick, 1992; Berg and Hamrick, 1994; Lokker et al., 1994; Kim and Chung, 1995a,b; Mayers et al., 1998; Chung and Chung, 1999; Chung and Epperson, 1999). Others showed

that clonal reproduction may act as an enhancer of genetic drift by reducing the effective size of local populations (e.g., Pleasants and Wendel, 1989; Bayer, 1990; Murawski and Hamrick, 1990; Aspinwall and Christian, 1992; Chung, 1994; Chung and Kang, 1996; Yeeh et al., 1996). Since the relationship between genetic diversity and mode of reproduction remains unclear, further study of clonal plants is called for.

According to a previous review of bamboo biology (Janzen, 1976), many of the more common Asian species spread by rhizomes for a species-specific period (e.g., Sasa tessellata has an intermast period of > 115 years). After reaching a specific period, most Asian bamboos produce wind-pollinated flowers, synchronously set large quantities of seed ("mast seeding"), and die (Janzen, 1976). The biology of bamboos may be of interest to plant population biologists. Here we report levels and partitioning of allozyme diversity within and among populations and the extent of clonal reproduction within populations of Sasamorpha borealis (Hack.) Nakai (Poaceae), a small bamboo. Sasamorpha borealis is widely distributed in the Korean peninsula and Japanese archipelago. In Korea, populations of S. borealis are large and commonly found on hillsides under pine-oak understory. Unfortunately, information on reproductive biology of the study species (e.g., the exact period of masting and the range of synchronization of the masting period in Korea) is not available.

1Corresponding author. Fax: (0591) 54-0086; Tel: (0591) 751-5953; E-mail: mgchung@nongae.gsnu.ac.kr


Botanical Bulletin of Academia Sinica, Vol. 40, 1999

Materials and Methods

Population Samples

A total of 446 leaf samples were collected from ten populations of S. borealis in Korea (Figure 1). Population samples of 18 to 73 were employed. Population codes and sample sizes are given in Table 1. Because the species exhibits extensive clonal growth, samples were collected randomly at intervals of > 5m within patch or population to avoid biasing samples toward certain clones. Leaf samples were placed in plastic bags wrapped with a wet paper towel and stored on ice and transported to the laboratory. Samples were then stored at 4°C until protein extraction.

Enzyme Extraction and Electrophoresis

Leaf samples were cut finely, and crushed with a mortar and pestle. A phosphate-polyvinylpyrrolidone extraction buffer (Mitton et al., 1979) was added to the leaf samples to facilitate crushing and to aid enzyme stabilization. The crushed extract was absorbed onto 4× 6-mm wicks cut from Whatman 3 MM chromatography paper and were stored at -70°C until needed for analysis. Electrophoresis was performed using 10.5% starch gels. Fourteen putative loci for S. borealis from nine enzyme systems were resolved using a Poulik buffer system, a modification (Haufler, 1985) of Soltis et al. (1983) system 6. The nine enzyme systems were acid phosphatase (ACPH), diaphorase (DIA), fluorescent esterase (FE), glutamate dehydrogenase (GDH), leucine aminopeptidase (LAP), peroxidase (PER), phosphoglucoisomerase (PGI), phosphoglucomutase (PGM), and triosephosphate isomerase (TPI). Enzyme staining followed protocols of Cheliak and Pitel (1984) for DIA and Soltis et al. (1983) for all others. Putative loci were designated sequentially, with the most anodally migrating isozyme designated 1, the next 2, etc. Likewise, alleles were designated sequentially with the most anodally migrating alleles designated a. Although the genetic bases of the loci were not documented by controlled crosses, the isozymes expressed phenotypes that were consistent in subunit structure and genetic interpretation with other isozyme studies in plants, as documented by Weeden and Wendel (1989).

Data Analyses

A locus was considered polymorphic if two or more alleles were detected, regardless of their frequencies. Five standard genetic parameters were estimated using a computer program developed by M. D. Loveless and A. Schnabel: percent polymorphic loci (P), mean number of alleles per polymorphic locus (AP), mean number of alleles per locus (A), effective number of alleles per locus (Ae),

Figure 1. The location of the ten populations in Korea examined in this study (alphabetic codes as in Table 1).

Table 1. Summary of allozyme variation and clonal diversity for 14 loci within ten populations of Sasamorpha borealisa.

Popb ALc Nd P AP A Ae Ho (SD) He (SD) G G/N DG PG

A 950 27 42.86 2.00 1.43 1.39 0.378 (0.025) 0.200 (0.065) 4 0.148 0.556 0.593

B 480 57 64.29 2.56 2.00 1.39 0.262 (0.016) 0.227 (0.056) 38 0.667 0.978 0.123

C 20 44 35.71 2.00 1.36 1.24 0.227 (0.017) 0.125 (0.056) 3 0.068 0.342 0.795

D 350 73 57.14 2.00 1.57 1.55 0.500 (0.016) 0.281 (0.068) 2 0.027 0.106 0.862

E 450 32 50.00 2.29 1.64 1.42 0.362 (0.023) 0.222 (0.064) 15 0.469 0.938 0.156

F 430 65 57.14 2.50 1.86 1.35 0.237 (0.014) 0.209 (0.055) 32 0.492 0.514 0.185

G 320 57 64.29 2.33 1.86 1.49 0.251 (0.015) 0.270 (0.058) 42 0.737 0.983 0.105

H 300 32 57.14 2.13 1.64 1.47 0.333 (0.022) 0.245 (0.065) 24 0.750 0.976 0.125

I 750 18 35.71 2.40 1.50 1.38 0.294 (0.029) 0.183 (0.068) 8 0.444 0.883 0.222

J 1000 41 50.00 2.14 1.57 1.44 0.331 (0.020) 0.231 (0.066) 16 0.390 0.920 0.220

Mean 44.6 51.43 2.23 1.64 1.41 0.317 (0.006) 0.219 (0.020) 18.4 0.419 0.720 0.339

aAbbreviations: P, percentage of polymorphic loci; AP, mean number of alleles per polymorphic locus; A, mean number of alleles per locus; Ae, effective number of alleles per locus; Ho, observed heterozygosity; He, Hardy-Weinberg expected heterozygosity or genetic diversity; G, number of multilocus genotypes; DG, multilocus genotypic diversity indices; G/N, number of genotypes per population samples ("proportion of distinguishable genotypes" per population); PG, probability of the most common multilocus genotype.

bAlphabetic codes as in Figure 1.

cAltitude (m).

dSample size.


Lee and Chung — Genetic variation in Sasamorpha borealis

and gene diversity (He) (Berg and Hamrick, 1997). Subscripts refer to species (s) or population (p) level parameters.

Because S. borealis reproduces vegetatively, we assessed the amount of clonal diversity within and among populations. The first measure of clonal diversity we used was the "proportion of distinguishable genotypes" (Ellstrand and Roose, 1987). This is simply G/N, where G is the number of distinct genotypes in a population and N is the number of individuals sampled. The second measure was the probability of getting the most common genotype by chance in each population (PG). The third measure of multilocus genotype diversity (DG) was calculated as a modification (Pielou, 1969) of the Simpson index: DG = 1 - S {[ni(ni-1)]/[N(N-1)]}, where ni is the number of individuals of genotype i and N is the total number of individuals in the population. Finally, for comparisons of genotype diversity among populations, numbers of "widespread genotypes" (genotype occurring in more than 75% of the populations) and "local genotypes" (genotypes occurring in only one population) were counted (Ellstrand and Roose, 1987).

Nei's (1973, 1977) gene diversity formulae (HT, HS, DST, and GST) were used to evaluate the distribution of genetic diversity within and among populations. In addition, a chi-square statistic was used to detect significant differences in allele frequencies among populations for each locus (Workman and Niswander, 1970). Nei's (1972) genetic identity (I) was calculated for each pairwise combination of populations. We used NTSYS (Rohlf, 1988) to conduct a cluster analysis on genetic identities via the unweighted pairwise groups method using arithmetic average (UPGMA).

Two indirect estimates of gene flow were calculated. One estimate of Nm (the number of migrants per generation) was calculated based on FST, (equivalent to GST) as calculated in the study (Wright, 1951). The second estimate was based on the average frequency of private alleles (Slatkin, 1985; Barton and Slatkin, 1986).

Results

For Sasamorpha borealis, ten of the 14 scoreable loci were polymorphic in at least one population. Gdh, Per-2, Pgi-1, and Tpi-1 were monomorphic in all ten populations. High levels of genetic variation within populations (Table 1) and the sample as a whole were observed: PP and PS of 51.4% and 71%, APP and APS of 1.64 and 3.60, and AeP and AeS of 1.41 and 1.74, and HeP and HeS of 0.219 and 0.332.

The number of multilocus genotypes in populations ranged from four to 42 (mean = 18.4), indicating that all populations were comprised of multiple genotypes. The proportion of resolved "distinguishable genotypes" (G/N) ranged from 0.027 to 0.750 with a mean of 0.419. The probability of getting the most common genotype by chance (PG) in each population ranged from 0.105 to 0.862 with a mean of 0.339. Genotype diversity indices (DG) ranged from 0.106 to 0.983 with a mean of 0.720 (Table 1). Level of genotype diversity among populations was high. One hundred eight-four multilocus genotypes were found among the 446 samples from the ten populations. All multilocus genotypes were "local genotypes".

Significant differences in allele frequencies among populations were found for all ten polymorphic loci (p < 0.001 in each case). The GST values ranged from 0.089 for Pgi-3 to 0.597 for Pgm-2 (Table 2), and on average, about 69% of the total variation in the species was common to all populations. In addition, ten private alleles were found in five populations: A (Diae, 0.500), B (Acphb, 0,018; Lapa,e, 0.035, 0.079; Tpi-2c, 0.018), D (Lapb, 0.500), E (Fec, 0.016), G (Pgm-1c, 0.009), and I (Acpha, 0.389; Fea, 0.083). The indirect estimate of gene flow based on the mean GST was low (Nm = 0.56) and similar to the estimate based on private alleles (Nm = 0.20). Average genetic identity for all pairs of populations was low (I = 0.834, SD = 0.046).

Genetic structure among populations was also evaluated by testing whether genetic relatedness of neighboring populations was greater than expected by chance.

Table 2. Nei's (1973,1977) statistics of genetic diversity for ten polymorphic loci in Sasamorpha borealisa.

Locus HT HS DST GST

Acph 0.2304 0.1357 0.0947 0.4109***

Dia 0.4790 0.3812 0.0979 0.2043***

Fe 0.6245 0.4190 0.2055 0.3290***

Lap 0.5253 0.4209 0.1045 0.1988***

Per-1 0.3154 0.2108 0.1046 0.3315***

Pgi-2 0.5468 0.3385 0.2083 0.3809***

Pgi-3 0.4873 0.4441 0.0433 0.0888***

Pgm-1 0.2315 0.1538 0.0777 0.3355***

Pgm-2 0.7095 0.2859 0.4236 0.5971***

Tpi-2 0.4926 0.3806 0.1120 0.2274***

Average 0.4642 0.3171 0.1472 0.3104

aAbbreviations: HT, total genetic diversity; HS, genetic diversity within populations; DST, genetic diversity among populations; GST, proportion of the total genetic diversity partitioned among populations. A chi-square test for allele frequency heterogeneity between populations: *** = p < 0.001.


Botanical Bulletin of Academia Sinica, Vol. 40, 1999

Three correlation matrices were constructed comparing each pair of populations; the physical distances between populations, pairwise values of Nei's genetic distance, and pairwise FST (= GST) values (Slatkin, 1993). The Mantel Z test (carried out using NTSYS) showed no correlation in either of the two pairs of matrices (physical distances vs. Nei's genetic distance, r = 0.074, p >> 0.05; physical distances vs. pairwise FST values, r = 0.193, p >> 0.05). Again, the UPGMA phenogram shows very weak correspondence between genetic and geographic distance (Figure 2).

Discussion

The species level parameters are more useful because population level values are influenced by both the level of variation in the species as a whole as well as how that variation is distributed among the populations (Berg and Hamrick, 1997). The levels of genetic variation found in S. borealis sampled were high in relation to the mean values of long-lived herbaceous perennials. According to a recent review of plant allozyme literature (Hamrick and Godt, 1989), long-lived herbaceous perennials (N = 4) have a mean percent polymorphic loci (PS) of 39.6%, mean number of alleles per locus (AS) of 1.42, mean effective number of alleles per locus (AeS) of 1.28, and mean genetic diversity (HeS) of 0.205. For S. borealis PS is 71%, AS is 2.86, AeS is 1.74; and HeS is 0.332. The HT values (Table 2) for all the polymorphic loci are quite high indicating rather even allele frequencies from the pooled values. This is unusual since usually for most species there are at least a few loci with very common alleles (i.e., > 0.95).

Why was genetic diversity in populations of S. borealis so high? Usually, the combined traits of breeding system and geographical distribution are correlated significantly with levels of genetic diversity within populations (Hamrick and Godt, 1989). Populations of outcrossing, wind-pollinated species have considerably higher levels of genetic diversity than selfing species and animal-pollinated species with mixed mating systems (i.e., partially selfed, partially outcrossed) (Hamrick and Godt, 1989). Bamboos are apparently wind-pollinated since they have inflorescences like those of other grasses (Janzen, 1976). Plant species with geographically widespread distributions usually tend to maintain higher levels of allozyme diversity than plants with more restricted ranges (Karron et al., 1988). Sasamorpha borealis is widely distributed in Japan and Korea.

Clonal reproduction could also affect the levels of genetic diversity and population genetic structure of plant populations (Cook, 1983, 1985). The average genotypic diversity index for S. borealis is higher (DG = 0.72) than the average (0.62) reported by Ellstrand and Roose (1987) in their review of genotypic diversity in clonal plants. The mean "proportion of distinguishable genotypes" per population for S. borealis is also higher (0.42 vs. 0.17). Population D had the highest value of He (0.281), but the lowest values of G (2), G/N (0.027), and DG (0.106). This was caused by the abundance of two multilocus genotypes which are heterozygous at seven out of ten polymorphic

Figure 2. Phenogram from UPGMA cluster analysis based on Nei's (1972) genetic distance between the ten populations of Sasamorpha borealis.

loci. Population G had the highest G, G/N, and DG (42, 0.737, and 0.983, respectively), but as expected, it also had the lowest PG (0.105).

In every population but population G the level of observed heterozygosity (Ho) was higher than the expected heterozygosity (He). In fact there is a trend in the data (Table 1): the more genotypes that are observed, the closer the Ho and He values become, i.e., those populations with few genotypes have a large excess of heterozygotes (Spearman rank correlation, rs = -0.903, p < 0.001). This may indicate the existence of selection for heterozygous genotypes in these populations. The abundance of ramets with a high frequency of heterozygous genotypes at several loci in some of the sampled populations (e.g., populations A, C, D, and I) is responsible for the high levels of allozyme diversity in S. borealis.

Chung and Kang (1994) stressed the importance of high fecundities for maintaining high genetic diversity in plant populations. The adult mast-seeding bamboos usually die after bearing numerous seeds in a mast year to remove the intense shade that they often cast (Nicholson, 1922) or to decrease competition with large numbers of their own seedings (Janzen, 1976). As S. borealis has a relatively long, branched rhizome, independent ramets could reduce the probability of genet death. These factors may also be important for S. borealis maintaining high levels of allozyme variation.

The degree of population differentiation observed in S. borealis was higher than those of plants with similar life history characteristics (reviewed in Hamrick and Godt, 1989). Long-lived herbaceous perennials (N = 2, GST = 0.213), species with widespread geographic range (N = 87, GST = 0.213), and those with sexual and asexual mode of reproduction (N = 54, GST = 0.213) have lower mean GST values than S. borealis (GST = 0.310). This is supported


Lee and Chung — Genetic variation in Sasamorpha borealis

margaretta (Fagaceae). Amer. J. Bot. 81: 7-14.

Berg, E.E. and J.L. Hamrick. 1997. Quantification of genetic diversity at allozyme loci. Can. J. For. Res. 27: 415-424.

Cheliak, W.M. and J.A. Pitel. 1984. Techniques for starch gel electrophoresis of enzymes from forest species. Information Report PI-X-42, Petawawa National Forestry Institute, Agriculture Canada, Canadian Forestry Service, Chalk River, Ontario, pp. 1-49.

Chung, M.G. 1994. Low levels of genetic diversity within populations of Hosta clausa (Liliaceae). Plant Species Biol. 9: 177-182.

Chung, M.G. and S.S. Kang. 1994. Genetic variation and population structure in Korean populations of Eurya japonica (Theaceae). Amer. J. Bot. 81: 1077-1082.

Chung, M.G. and S.S. Kang. 1996. Allozyme genetic and clonal diversity within populations of Chimaphila japonica and Pyrola japonica (Pyrolaceae). Isr. J. Plant Sci. 44: 259-271.

Chung, M.G. and B.K. Epperson. 1999. Spatial genetic structure of clonal and asexual reproduction in populations of Adenophora grandiflora (Campanulaceae). Evolution 54: 1068-1078.

Chung, M.Y. and M.G. Chung. 1999. Allozyme diversity and population structure in Korean populations of Cymbidium goeringii (Orchidaceae). J. Plant Res. 112: 139-144.

Cook, R.E. 1983. Clonal plant populations. Amer. Sci. 71: 244-253.

Cook, R.E. 1985. Growth and development in clonal plant populations. In J.B.C. Jackson, L.W. Buss and R.E. Cook (eds.), Population Biology and Evolution of Clonal Organisms. Yale Univ. Press, New Haven, Connecticut, pp. 259-296.

Ellstrand, N.C. and M.L. Roose. 1987. Patterns of genotypic diversity in clonal plant species. Amer. J. Bot. 74: 123-131.

Eriksson, O. 1993. Dynamics of genets in clonal plants. Trends Ecol. Evol. 8: 313-316.

Hamrick, J.L. and M.J.W. Godt. 1989. Allozyme diversity in plant species. In A. H. D. Brown, M. T. Clegg, A. L. Kahler and B. S. Weir (eds.), Plant Population Genetics, Breeding and Genetic Resources. Sinauer Associates, Sunderland, Massachusetts, pp. 43-63.

Haufler, C.H. 1985. Enzyme variability and modes of evolution in Bommeria (Pteridaceae). Syst. Bot. 10: 92-104.

Janzen, D.H. 1976. Why bamboos wait so long to flower. Ann. Rev. Ecol. Syst. 7: 347-391.

Karron, J.D., Y.B. Linhart, C.A. Chaulk and C.A. Robertson. 1988. The genetic structure of populations of geographically restricted and widespread species of Astragalus (Fabaceae). Amer. J. Bot. 75: 1114-1119.

Kim, S.T. and M.G. Chung. 1995a. Genetic and clonal diversity in Korean populations of Calystegia soldanella (Convolvulaceae). Israel J. Plant Sci. 43: 213-226.

Kim, S.T. and M.G. Chung. 1995b. Genetic and clonal structure in Korean populations of Calystegia japonica (Convolvulaceae). Bot. Bull. Acad. Sin. 36: 135-141.

Lokker, C., D. Susko, L. Lovett-Doust, and J. Lovett-Doust. 1994. Population genetic structure of Valisneria americana, a dioecious clonal macrophyte. Amer. J. Bot. 81: 1004-1012.

Mayers, S.G., M.A. McGinley, and C.R. Werth. 1998. Clonal

by low mean genetic identities for each pairwise combination of populations (mean I = 0.834). In addition, significant differences were found in allele frequencies among populations for all nine polymorphic loci (p < 0.001). Genotypic diversity among populations was large. No "widespread genotypes" were observed. In addition, all multilocus genotypes were "local genotypes." These data suggest that the present populations might have been founded from sexually produced seed rather than by asexual fragmentation and dispersal of preexisting clones. The high GST value suggests that gene flow among populations is low. Indirect estimates of the number of migrants per generation (Nm) were 0.56, calculated from GST, and 0.20, calculated from the mean frequency of ten private alleles.

Other explanations for the high GST value, however, could be suggested. It is probable that populations become established and reestablished by an infrequent reproductive event. Most or all of the adult plants flower and then die to be replaced by seedlings. If the population is reestablished from only a few seedlings, the resulting adult population will consist of only a few reproductive adults and experience a genetic bottleneck. Such a bottleneck could also develop if several seedlings become established but only a few genets survive. Thus, it may be the pattern of recolonization rather than gene flow that has produced the large population structure observed. In addition, the relatively high GST value observed may have resulted in part from the fact that some of the sampled populations have very few genetically distinct individuals. Thus, regardless of the sample size these low number of genets could cause elevated GST values. The mean GST value (0.209) based on six populations (populations B, E, F, G, and J) with higher numbers of multilocus genotypes (>15) was lower than that for all populations (0.310).

Acknowledgments. The paper represents part of a thesis submitted by NWL to the Graduate School of Gyeongsang National University, in partial fulfillment of the requirements for the degree of Master of Education. We are grateful to two anonymous reviewers for valuable comments and suggestions on the manuscript. This research was supported in part by a Korea Science Engineering Foundation grant (96-0500-006-2) to MGC.

Literature Cited

Aspinwall, N. and T. Christian. 1992. Clonal structure, genotypic diversity, and seed production in populations of Filipendula rubra (Rosaceae) from the north central United States. Amer. J. Bot. 79: 294-299.

Barton, N.H. and M. Slatkin. 1986. A quasi-equilibrium theory of the distribution of rare alleles in a subdivided population. Heredity 56: 409-415.

Bayer, R.J. 1990. Patterns of clonal diversity in the Antennaria rosea (Asteraceae) polyploid agamic complex. Amer. J. Bot. 77: 1313-1319.

Berg, E.E. and J.L. Hamrick. 1994. Spatial and genetic structure of two sandhills oaks: Quercus laevis and Quercus


Botanical Bulletin of Academia Sinica, Vol. 40, 1999

population structure and genetic variation in sand-shinnery oak, Quercus havardii (Fagaceae). Amer. J. Bot. 85: 1609-1617.

Mitton, J.B., Y.B. Linhart, K.B. Sturgeon, and J.L. Hamrick. 1979. Allozyme polymorphisms detected in mature needle tissue of ponderosa pine. J. Hered. 70: 86-89.

Murawski, D.A. and J.L. Hamrick. 1990. Local genetic and clonal structure in the tropical terrestrial bromeliad, Aechmea magdalenae. Amer. J. Bot. 77: 1201-1208.

Nei, M. 1972. Genetic distance between populations. Am. Nat. 106: 283-292.

Nei. M. 1973. Analysis of gene diversity in subdivided populations. Proc. Natl. Acad. Sci. USA 70: 3321-3323.

Nei, M. 1977. F-statistics and analysis of gene diversity in subdivided populations. Ann. Human Genet. 41: 225-233.

Nicholson, J.W. 1922. Note on the distribution and habit of Dendrocalamus strictus and Bambusa arundinacea in Orissa. Ind. For. 48: 425-428.

Parker, K.C. and J.L. Hamrick. 1992. Genetic diversity and clonal structure in a columnar cactus, Lophocereus schottii. Amer. J. Bot. 79: 86-92.

Pielou, C.E. 1969. An Introduction to Mathematical Ecology. Wiley-Interscience, New York, 327 pp.

Pleasants, J.M. and J.F. Wendel. 1989. Genetic diversity in a clonal narrow endemic, Erythronium propullans, and in its

widespread progenitor, Erythronium albidium. Amer. J. Bot. 76: 1136-1151.

Rohlf, F.J. 1988. Numerical taxonomy and multivariate analysis system. Exeter publishing, Setauket, New York, pp. 10-2

Slatkin, M. 1985. Rare alleles as indicators of gene flow. Evolution 39: 53-65.

Slatkin, M. 1993. Isolation by distance in equilibrium and non-equilibrium populations. Evolution 47: 264-279.

Soltis, D.E., C.H. Haufler, D.C. Darrow, and G.J. Gastony. 1983. Starch gel electrophoresis of ferns: A compilation of grinding buffers and staining schedules. Amer. Fern J. 73: 9-27.

Weeden, N.F. and J.F. Wendel. 1989. Genetics of plant isozymes. In D.E. Soltis and P.S. Soltis (eds.), Isozymes in Plant Biology. Dioscorides Press, Portland, Oregon, pp. 46-72.

Workman, P.L. and J.D. Niswander. 1970. Population studies on southwestern Indian tribes. II. Local genetic differentiation in the Papago. Amer. J. Human Genet. 22: 24-49.

Wright, S. 1951. The genetic structure of populations. Ann. Eugen. 15: 313-354.

Yeeh, Y., S.S. Kang, H.G. Chung, M.S. Chung, and M.G. Chung. 1996. Genetic and clonal diversity in Korean populations of Vitex rotundifolia (Verbenaceae). J. Plant Res. 109: 161-168.


Lee and Chung — Genetic variation in Sasamorpha borealis

Áú°ê Sasamorpha borealis (Poaceae) ±Ú¸sªº°ª«×

¿ò¶ÇÅܲ§
Nam Won Lee and Myong Gi Chung

Department of Biology, Gyeongsang National University

Chinju 660-701, The Republic of Korea
§Q¥Î²§·½»Ã¯À (allozyme) §@¬°¿ò¶Ç¼Ð»x¨Ó¬ã¨s±´°QÁú°ê Sasamorpha borealis (Hack.) ±Ú¸s¤§¿ò¶Ç¤Î°ò ¦]«¬ª[²§©Ê (genotypic diversity)¡A¦bÁú°ê S. borealis ³q±`¥Íªø©ó¤s¸¡¦ì©óªQ¾ð¤@¾ó¾ð¤U¼h¡C«Ü¦hºØ¦Ë¤l ³£¦³²£¥ÍºØ¤lªº®É´Á¡A·í¸g¹L¼sªxªº¦a¤U²ô¥Íªø´²§G¤@¬q®É´Á«á¡A¦P¤@°Ï°ì¤º´X¥G©Ò¦³ªº¦¨®è³£·|²£¥Í­· ±Â¯»¹Lªºªá¡A¨Ãµ²¤j¶qªººØ¤l¡AµM«á¦º¤`¡C¥»¬ã¨s¥D­n±´°QºØªº¿ò¶Çª[²§©Ê»P¥Í´Þ¥Íª«¾Ç¶¡ªºÃö«Y¡C S. borealis ±Ú¸sºû«ù¬Û·í°ªªº¿ò¶Çª[²§©Ê¡G¬ù 51% À˸ժº°ò¦]®y¬O¦h«¬©Êªº¥B¨ä¥­§¡¿ò¶Çª[²§©Ê¬° Hep = 0.219¡A¨C¤@±Ú¸s¤§¦h°ò¦]®y°ò¦]«¬ªº¥­§¡¼Æ¥Ø¬° 18.4¡A¥­§¡°ò¦]«¬ª[²§©Ê«ü¼Æ (DG) ¬° 0.720 ¡CµM¦Ó±Ú¸s¶¡ (GST = 0.310) ¬ù¦³ 31% ªº¿ò¶ÇÅܲ§¡A¤£¦P±Ú¸s¶¡ (P<0.001) ©Ò¦³À˸ժº°ò¦]®y¨ä¹ï°¸°ò¦]ÀW²v¦³·¥ ÅãµÛªº®t²§¡A¨ä©Ò¦³¤ñ¹ï«áªº¥­§¡¿ò¶Ç¦P¤@©Ê (average genetic identity) ¬ù¬° 0.833 (SD = 0.046)¡A¶¡±µ¦ôºâ¨C¥N¶¡²¾°ÊªÌªº¼Æ¥Ø¬ù¬° 0.56 (±q GST ¤W­pºâ) ¤Î 0.20 (±q¨C¤Q­Ó¹ï°¸°ò¦]ªº¥­§¡ÀW²v¤W­pºâ)¡CS. borealis ¤§´X­Ó¥Íª«¾Ç¤Î¥ÍºA¾Ç¤Wªº©Êª¬¡]¼sªxªº¦a½è¤W¤À§G¡Bªø´Á¦s¯dªº´Ï®§¦a¡B¨ã°ª«×°ò¦]«¬ª[²§ ©ÊªºÀç¾i¨tÁc´Þ¡B­·±Â¯»ªº¨|ºØ¨t²Î¡B¦¨®è¦º¤`®É²£¥Í¤j¶qªººØ¤l¡B¥i¯àªº§Cªº±Ú¸s¶¡¿ò¶Ç¬y°Ê (genetic flow)¡B¬Y¨Ç¨ú¼Ë±Ú¸s¤¤²§·½°ò¦]«¬ªº¿z¿ï¡B¦A²¾´Þªº«¬¦¡¡B¿ò¶Çº}ÅÜ (genetic drift) ªº®ÄÀ³¡B¤Î§½³¡ªº¿z ¿ï¤O¶q¡^©Î³\¹ï©óºØ¤§±Ú¸s¿ò¶Çµ²ºc¤§§Î¦¨§êºt­«­n¨¤¦â¡C

ÃöÁäµü¡G ²§·½»Ã¯À¡FÀç¾i¨tª[²§©Ê¡F¿ò¶Çª[²§©Ê¡FªG¹ê¤ºµ²¦¨ºØ¤l¡FSasamorpha borealis¡F¿z¿ï¡C