Bot. Bull. Acad. Sin. (2001) 42: 23-33

Yuan et al. — Glutamine synthetase from Scynechococcus RF-1

Purification and characterization of glutamine synthetase from the unicellular cyanobacterium Synechococcus RF-1

Hso-Freng Yuan*, Chiung-Min Wang, and Han-Wei Kung

Institute of Botany, Academia Sinica, Taipei, Taiwan 11529, Republic of China

(Received March 24, 2000; Accepted July 17, 2000)

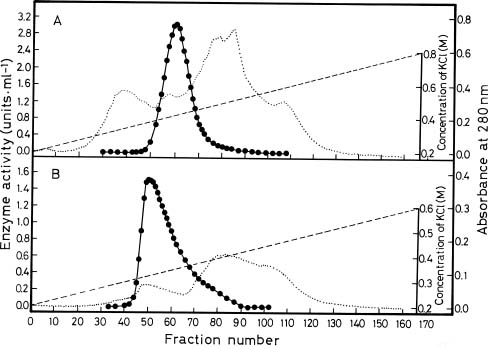
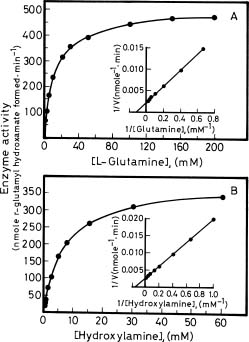
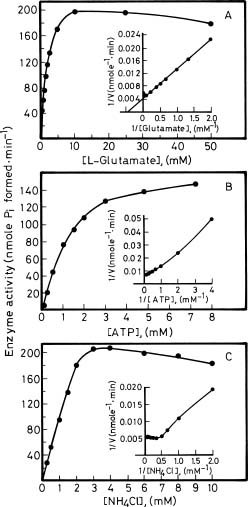
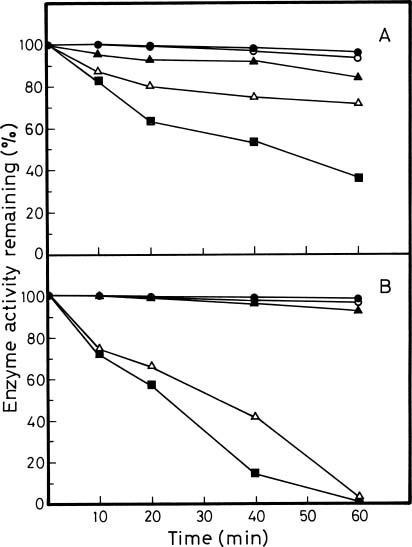
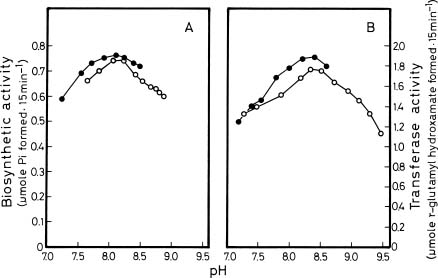
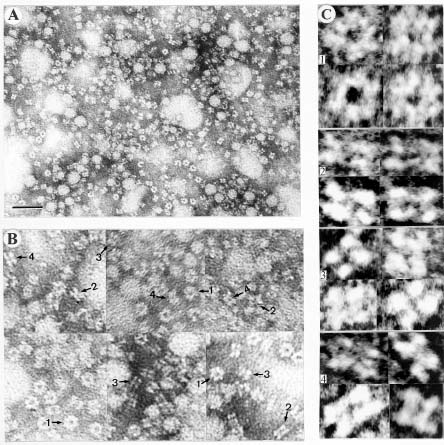
Abstract. Glutamine synthetase (GS; EC 6.3.1.2) from the Synechococcus RF-1 was purified to homogeneity by ion exchange, molecular sieving, and hydroxyapatite chromatographies. The native enzyme has a molecular mass of about 456 kDa, and the molecular mass of its subunit was about 56 kDa. Electron micrographs of the enzyme revealed two parallel protein layers in cubic symmetry with quaternary structure. The actual data indicated that the enzyme could consist of eight identical subunits. The enzyme had an apparent Km value for L-glutamate of 2.33 mM, but it exhibited positive cooperativity for ATP (nH = 1.5 and S0.5 = 0.94 mM) and NH4Cl (nH = 2, and S0.5 = 1.33 mM) in the biosynthetic assay. The enzyme had apparent Km values for L-glutamine and hydroxylamine of 8.70 mM and 7.04 mM, respectively, in the transferase assay. This enzyme was quite stable in Tris-HCl buffer (pH 7.5) containing EDTA, MgCl2 and 2-mercaptoethanol. The pH optima for both the biosynthetic and transferase activities of the enzyme were 8.1 and 8.4, respectively. The enzyme required a divalent metal ion as an activator. Mg2+ was the most effective metal ion for biosynthetic activity, followed by Co2+. Mn2+ was the most effective metal ion for transferase activity. Ca2+ and Mn2+ strongly inhibited Mg2+-supported biosynthetic activity, but Co2+ stimulated it.

Keywords: Cyanobacteria; Glutamine synthetase; Synechococcus RF-1.

Abbreviations: DEAE, diethylaminoethyl; EDTA, ethylenediamine tetraacetic acid; EPPS, N-(2-hydroxymethyl)piperazine-N'-3-propanesulfonic acid; GS, glutamine synthetase; Pi, inorganic phosphate; SDS, sodium dodecyl sulfate; TCA, trichloroacetic acid; Tris, tris(hydroxymethyl)aminomethane.

Introduction

Glutamine synthetase (GS; EC 6.3.1.2) in collaboration with glutamate synthase (EC 1.4.7.1) plays a central role in ammonia assimilation in a wide range of cyanobacteria (Guerrero and Lara, 1987). GS carries out the ATP-dependent synthesis of glutamine from ammonium nitrogen and glutamate while glutamate synthase carries out the reductive transamidation from glutamine to a-ketoglutaric acid that assimilates one molecule of ammonium nitrogen. The incorporation of ammonium nitrogen into carbon skeletons takes place a key junction between nitrogen and the carbon metabolism. Although it does not directly link amino acids with the carbohydrate metabolism, it influences their connection by regulating the glutamine/a-ketoglutarate ratio.

GSs from both N2-fixing and non-N2-fixing cyanobacteria, such as Anabaena (Sampaio et al., 1979; Orr et al., 1981), Anacystis nidulans (Emond et al., 1979; Florencio and Ramos, 1985), Phormidium (Sawa et al., 1988; Blanco et al., 1989) and Synechocystis (Mérida et al.,

1990) have been purified and well characterized. All of these GSs were quite similar in molecular mass, subunit composition, and the requirement of divalent metal ions for enzyme activity. The activity of GSs from Escherichia coli (Shapiro and Stadtman, 1970a) and other gram-negative bacteria (Johansson and Gest, 1977) are regulated by covalent modification through adenylylation/de-adenylylation, but the regulation of cyanobacterial GS activity does not follow the classical adenylylation mechanism present in many prokaryotes. There is no evidence of covalent modification of GS from any cyanobacterium (Fisher et al., 1981). By contrast, the activity of Synechocystis 6803 GS is controlled by a different mechanism that involves the direct interaction of two inhibitory polypeptides with the GS (García-Domínguez et al., 1999).

The unicellular cyanobacterium Synechococcus RF-1 fixes N2 aerobically either under continuous light or in an alternating light/dark cycle (Grobbelaar et al., 1986; Huang and Chow, 1986). Under continuous light, the culture fixes N2 continuously at a variable rate. In a diurnal light/dark regimen, it fixes N2 at a high rate but almost exclusively during the dark periods. In this paper, we describe a complete purification method of GS from the Synechococcus RF-1. We also discuss the properties of the RF-1 GS and the effect of divalent metal ions on enzyme activity.

*Corresponding author. Tel: 886-2-27899590; Fax: 886-2-27827954.


Botanical Bulletin of Academia Sinica, Vol. 42, 2001

Materials and Methods

Chemicals

All biochemicals and hydroxyapatite were purchased from Sigma Chemical Company (St. Louis, USA). Inorganic chemicals of analytical grade were obtained from Merck (Darmstadt, Germany) or Wako Pure Chemical Industries (Tokyo, Japan). The DE-52 (DEAE-cellulose) was obtained from Whatman Biochemicals (United Kingdom). Sepharose 6B, DEAE-Sephacel, Sephacryl S-300 HR and protein molecular mass standards for molecular sieving and gel electrophoresis were obtained from Pharmacia Fine Chemicals (Uppsala, Sweden).

Organism and Growth Conditions

The unicellular cyanobacterium Synechococcus RF-1 strain (PCC 8801) was originally from Huang and Chow (1986). Axenic cultures of the RF-1 strain were cultivated in 1000-ml culture bottles containing 800 ml of nitrogen-free BG-11 medium (Stanier et al., 1971) supplemented with 10 mM EPPS (pH 8.0). The cells were incubated at 28°C under continuous illumination with white fluorescent lamp (35 µmole photons•m-2•s-1) and bubbled with a filtered air stream (200 ml/min) about 13-14 days until they reached a stationary growth stage. The cultures were then harvested by centrifugation (8,000 g for 10 min) and washed once with buffer A (50 mM Tris-HCl buffer, pH 7.5, containing 2 mM EDTA, 5 mM MgCl2 and 10 mM 2-mercaptoethanol). The pelleted cells were re-suspended in buffer A in a concentration about 1.3 × 10⁹ cells/ml and stored at -70°C until use.

Preparation of Cell-Free Extract

The frozen cell suspension of Synechococcus RF-1 was thawed and sonicated with 15-s bursts (100 W, 20 kHz) in an ice bath until the cell suspension changed its color from blue-green to green-red. The total time of sonicating was 30 min for 200 ml of the cell suspension. The cell-free extract was then obtained by centrifugation at 16,000 g for 20 min. The following operations were carried out at 4°C.

Purification of GS

The cell-free extract was directly applied to a DEAE-Sephacel column (2.0 × 20 cm) that was equilibrated with buffer B (10 mM Tris-HCl buffer, pH 7.5, containing 2 mM EDTA, 5 mM MgCl2 and 10 mM 2-mercaptoethanol). After washing with buffer B containing 0.2 M KCl, proteins were eluted with 500-ml linear gradient of 0.2-0.8 M KCl in buffer B. Fractions of 3 ml were collected, and these containing GS activity were combined. Proteins were precipitated by adding solid (NH4)2SO4 to 70% saturation. Precipitates were collected by centrifugation and dissolved as well as possible in a small volume of buffer A. They were then subjected to gel filtration through a Sepharose 6B column (2.6 × 80 cm) with buffer B. Active fractions were combined and directly applied to a DE-52 column (2.0 × 20 cm) that had been equilibrated with buffer B. After washing with buffer B containing 0.2 M KCl, proteins were

eluted with a 500-ml linear gradient of 0.2-0.6 M KCl in buffer B. Active fractions were combined and dialyzed against buffer C (10 mM K, Na-phosphate buffer, pH 7.0, containing 10 mM 2-mercaptoethanol) with three changes of the buffer to remove salts. The dialyzed protein solution was applied to a hydroxyapatite column (2.5 × 3 cm) that had been equilibrated with buffer C and washed with the same buffer. Proteins were eluted with a 200-ml linear gradient of 10-200 mM K, Na-phosphate buffer (pH 7.0) containing 10 mM 2-mercaptoethanol. Active fractions were combined and concentrated by membrane filtration (Amicon Diaflo membrane PM10). They were then subjected to gel filtration again through a Sephacryl S-300 HR column (1.6 × 80 cm) with buffer B. Active fractions were collected and concentrated by membrane filtration. The purified enzyme retained more than 90% of its activity for one month at 4°C.

Enzyme Assays

Both the transferase and biosynthetic activities of the RF-1 GS were determined on the basis of Shapiro and Stadtman (1970b). The assay mixture for transferase activity consisted of 40 mM imidazole-HCl (pH 7.0), 30 mM L-glutamine, 3 mM MnCl2, 0.4 mM ADP, 20 mM sodium arsenate, 60 mM NH2OH and the enzyme solution in a final volume of 3 ml. The L-glutamine was omitted in the blank test. The reaction was started by adding NH2OH (prepared freshly, and neutralized to pH 7.0 with NaOH) and incubated at 30°C. The reaction was stopped by adding 1.0 ml of a mixture (1:1:1) of 10% FeCl3•6H2O (in 0.2 N HCl), 24% TCA and 6 N HCl after 15 min. The appearance of g -glutamyl hydroxamate was measured by the increased absorbance at 540 nm. The assay mixture for biosynthetic activity consisted of 50 mM imidazole-HCl (pH 7.0), 7.5 mM ATP, 100 mM L-glutamate, 50 mM NH4Cl, 50 mM MgCl2 and the enzyme solution in a final volume of 0.4 ml. The enzyme solution was omitted in the blank test. The reaction was started by adding the enzyme solution and incubating at 30°C. It was stopped by adding 3.6 ml of FeSO4•7H2O (0.8% in 0.015 N H2SO4, prepared freshly) after 15 min. The released Pi was determined by adding 0.3 ml of (NH4)6Mo7O24 •4H2O (6.6% in 7.5 N H2SO4), and the absorbance was measured at 600 nm.

Protein Determination

In the cell-free extract and purification steps up to DE-52 ion exchange chromatography, protein content was determined by the micro-biuret method (Itzhaki and Gill, 1964). In the subsequent purification steps, protein content was estimated by the dye-binding method (Bradford, 1976). The crystalline bovine serum albumin was used as the standard.

Polyacrylamide Gel Electrophoresis

Non-denaturing gel electrophoresis of the native enzyme protein was performed on a 7.5% polyacrylamide slab gel as described by David (1964). SDS-Polyacrylamide gel electrophoresis was carried out on 12.5% poly


Yuan et al. — Glutamine synthetase from Scynechococcus RF-1

by the biosynthetic reaction; and those for L-glutamine and hydroxyamine were determined by the transferase reaction.

The stability of the enzyme activity was detected by incubating the enzyme at various designated temperatures for 10 min. The enzyme was then cooled in an ice bath, and the residual activity was determined by biosynthetic and transferase assays. To detect the thermostability of the enzyme activity in the presence of stabilizing ligands, the purified enzyme was dialyzed against 10 mM Tris-HCl buffer (pH 7.5) with three changes of the buffer. The enzyme was then incubated at 45°C in 10 mM Tris-HCl buffer (pH 7.5) with or without stabilizing ligands. The biosynthetic and transferase activities of the enzyme were determined at different time intervals.

The pH optima of biosynthetic and transferase activities were determined by assaying the enzyme activity at various designated pH values in Tris-HCl and 2-amino-2-methyl-1,3-propanediol-HCl buffer solutions.

To detect the effect of divalent metal ions on the enzyme activity, the purified enzyme was dialyzed against 10 mM Tris-HCl buffer (pH 7.5) containing 2 mM EDTA and 10 mM 2-mercaptoethanol with three changes of the buffer. The requirement of divalent metal ions for the enzyme activity and the effects of various divalent metal ions on the Mg2+-supported biosynthetic activity and Mn2+-supported transferase activity were examined. And MgCl2•6H2O, MnCl2•4H2O, CaCl2•2H2O, CuSO4•5H2O, FeSO4•7H2O, CoCl2•6H2O, ZnSO4•7H2O and NiSO4•7H2O were used as the source of divalent metal ions.

Results

Enzyme Purification

The GS from Synechococcus RF-1 was purified to electrophoretic homogeneity by ion exchange, molecular sieving and hydroxyapatite chromatographies. The successive purification steps are summarized in Table 1. Elution profiles corresponding to DEAE-Sephacel and DE-52 steps are shown in Figure 1. Only one GS peak was eluted at 0.37-0.47 M KCl from the DEAE-Sephacel column (Figure 1A) and 0.30-0.38 M KCl from the DE-52 column

acrylamide slab gel in 0.1% SDS as described by Laemmli (1970). Protein bands were made visible on the slab gel by means of Coomassie brilliant blue R staining. The GS activity was detected on the non-denaturing slab gel by using the assay mixture for transferase activity as described by Barratt (1980).

Molecular Mass Determination

Molecular mass of the native enzyme was estimated by molecular sieving on a Sephacryl S-300 HR column (1.6 × 80 cm) with buffer A containing 0.1 M NaCl. The column was calibrated with markers of known molecular masses including aldolase (158 kDa), catalase (232 kDa), ferritin (440 kDa), and thyroglobulin (669 kDa). The partition coefficient (Kav) of each protein was calculated. The molecular mass of its subunit was estimated by SDS-polyacrylamide gel electrophoresis using a-lactalbumin (14.4 kDa), trypsin inhibitor (20.1 kDa), carbonic anhydrase (30 kDa), ovalbumin (43 kDa), albumin (67 kDa), and phosphorylase b (94 kDa) as markers of known molecular masses. The relative mobility (Rf) of each protein to the tracking dye was calculated.

Electron Microscopy of Negatively Stained GS

Prior to electron microscopy the purified RF-1 GS was dialyzed against sodium phosphate buffer (50 mM, pH 7.0) for overnight with three changes of the buffer, and the enzyme solution was adjusted to 30 µg of protein per ml. A carbon-coated grid was then touched on to a drop of the dialyzed enzyme solution for 30 s and blotted with a piece of filter paper to remove the excess solution. A drop of 2% (w/v) phosphotungstic acid (pH 7.0) was loaded on to the grid for 1 min and also blotted with filter paper. The grid was then dried at room temperature, and the samples were examined with a Philips CM 100 electron microscope set at 80 kV. Electron micrographs of enzyme molecules were taken at a magnification of 105,000×.

Characterization of Properties

Kinetic measurement of the enzyme was made on the protein purified to the Sephacryl S-300 step. Apparent Km values for L-glutamate, ATP and NH4Cl were determined

Table 1. Purification of glutamine synthetase from Synechococcus RF-1.

Purification step Total protein Total activity Recovery Specific activity Purification (mg) (units)b (%) (units/mg protein) (fold)

Crude extracta 462.77 141.25 100 0.305 1

DEAE-Sephacel eluate 59.40 130.10 92 2.190 7.18

0-70% (NH4)2SO4 fraction 53.16 127.58 90 2.400 7.87

Sepharose 6B eluate 34.50 120.71 85 3.499 11.47

DE-52 eluate 13.70 106.50 75 7.771 25.46

Hydroxyapatite 4.12 87.59 62 21.241 69.64

Sephacryl S-300 eluate 3.56 89.76 64 25.200 82.60

aCrude extract was prepared from 114 ml of RF-1 cell suspension (1.3 × 10⁹ cells/ml).

bGlutamine synthetase activity was determined by the transferase assay. One unit of the enzyme was defined as the amount of enzyme catalyzing the formation of 1.0 µmole of g-glutamyl hydroxamate per min at 30°C.


Botanical Bulletin of Academia Sinica, Vol. 42, 2001

(Figure 1B). Purification with Sephacryl S-300 HR column produced a homogeneous enzyme preparation that was checked with non-denaturating polyacrylamide gel electrophoresis (Figure 2A). Sample lanes contained only one Coomassie brilliant blue-stained band that was identified as GS by the activity staining (Barratt, 1980). The results of the activity staining are not shown owing to the rapid diffusion of the g-glutamyl hydroxamate formed. When the purified enzyme was subjected to SDS-polyacrylamide gel electrophoresis (Figure 2B) and stained with Coomassie brilliant blue, only one protein band was visualized on the gel. The specific activity of the enzyme was routinely increased about 83-fold with a recovery of about 64%.

Substrate Affinity

Kinetic properties of the purified GS were studied by analyzing both the biosynthetic and transferase activities. The substrate affinities were calculated from kinetic measurements of the reaction rates by varying the concentration of one substrate with the other substrates in excess. The apparent Km values were extrapolated from Lineweaver-Burk plots of the data obtained. In the biosynthetic reaction, the enzyme followed the Michaelis-Menten kinetics for L-glutamate (Figure 3A) with an apparent Km value of 2.33 mM, and the L-glutamate exhibited a somewhat inhibitory effect on the enzyme activity when its concentration was higher than 20 mM. In contrast, the enzyme exhibited positive kinetic cooperativity toward ATP and NH4Cl (Figures 3B and 3C). The Hill coefficient was estimated from the slope of log[v/(Vm-v)] against log[S] plot. The estimated Hill coefficients for ATP and NH4Cl were 1.5 and 2.0, and S0.5 values were 0.94 mM and 1.33 mM, respectively. In the transferase reaction, the enzyme followed the Michaelis-Menten kinetics for L-glutamine and hydroxylamine (Figures 4A and 4B) with apparent Km

Figure 2. Polyacrylamide gel electrophoresis of the Synechococcus RF-1 GS with standard protein markers. A, Nondenaturing gel electrophoresis of the native GS on 7.5% polyacrylamide slab gel; B, SDS-Polyacrylamide gel electrophoresis of the GS subunit on 12.5% polyacrylamide slab gel in 0.1% SDS. The GS protein content in each lane was 7.0 µg (lane 1) and 3.5 µg (lane 2) either in A or B. The standard protein markers are shown in lane 3.

values of 8.70 mM and 7.04 mM, respectively. However, the apparent Km value for ADP was so low that no accurate estimation could be made.

Stability of GS Activity

The stability of the GS activity in buffer B at various temperatures was determined. The enzyme was quite stable within 10 min as the temperature was lower than 50°C, but the enzyme activity decreased markedly within 10 min as the temperature was higher than 50°C. The transferase activity of the enzyme appeared to decrease more rapid than the biosynthetic activity.

The thermostability of the enzyme in the presence or absence of stabilizing ligands is shown in Figure 5. When the enzyme was incubated at 45°C for 60 min in 10 mM Tris-HCl buffer (pH 7.5) containing 2 mM EDTA, 5 mM MgCl2 and 10 mM 2-mercaptoethanol, about 96% and 98%, respectively, of the biosynthetic and transferase activities were retained. When the enzyme was incubated for 60 min in 10 mM Tris-HCl buffer (pH 7.5) with stabilizing ligands excluded, about 36% of the biosynthetic activity was retained and no transferase activity was detected. When the enzyme was incubated for 60 min in 10 mM Tris-HCl buffer (pH 7.5) containing 5 mM MgCl2 or 10 mM 2-mercaptoethanol, about 84% or 72% of the biosynthetic activity was retained, and about 93% or 2% of the transferase activity was retained respectively. When the enzyme was incubated for 60 min in 10 mM Tris-HCl buffer (pH 7.5) containing 5 mM MgCl2 and 10 mM 2-mercaptoethanol, about 84% and 93% of the biosynthetic and transferase activities were retained, respectively. The results indicated that the Mg2+ is the most important sta

Figure 1. Elution profiles of Synechococcus RF-1 GS on DEAE-Sephacel (A) and DE-52 (B) columns in the size of 2.0 × 20 cm. Fractions of 3 ml were collected with a flow rate of 35 ml per hour. The enzyme activity was determined by the transferase assay based on the rate of g-glutamyl hydroxamate formation. l-l, enzyme activity; ••••, absorbance at 280 nm; and ----, KCl gradient.


Yuan et al. — Glutamine synthetase from Scynechococcus RF-1

bilizing ligand for both biosynthetic and transferase activities.

Effect of pH

The effects of pH on the biosynthetic and transferase activities of the GS are shown in Figure 6. The biosynthetic activity had a pH optimum ranging from pH 7.9 to 8.4 and centered at pH 8.1 (Figure 6A). The transferase activity had a pH optimum ranging from pH 8.2 to 8.5 and centered at pH 8.4 (Figure 6B).

Figure 4. Substrate saturation curves and double reciprocal plots (insets) with L-glutamine (A) and hydroxylamine (B) as variable substrates for the transferase activity of Synechococcus RF-1 GS.

Molecular Mass

The molecular mass of the native enzyme was determined by molecular sieving on a Sephacryl S-300 HR column as indicated in Materials and Methods. The column was calibrated with marker proteins of known molecular masses. Then about 280 µg of purified enzyme protein (7 units) was loaded onto the column, and the enzyme activity was determined by its transferase activity. The enzyme activity eluted from the column as a single peak coincident with a peak in absorbance at 280 nm (data not shown). The partition coefficient (Kav) of each marker protein and the GS were calculated. The molecular mass of the GS was estimated from the logarithm of known molecular mass against the Kav plot. The native enzyme showed a molecular mass of about 456 ± 2.7 kDa (n = 4). When the enzyme was subjected to 12.5% SDS-polyacrylamide gel electrophoresis, the denatured enzyme showed a single protein band indicating that the native GS is composed of polypeptides of equal molecular mass (Figure 2B). The relative mobility (Rf) of each marker protein and the polypeptide to the tracking dye were calculated. The molecular mass of the polypeptide was estimated from the logarithm of known molecular mass against Rf plot. The polypeptide showed a molecular mass of about 56 ± 1.3

Figure 3. Substrate saturation curves and double reciprocal plots (insets) with L-glutamate (A), ATP (B) and NH4Cl (C) as variable substrates for the biosynthetic activity of Synechococcus RF-1 GS.


Botanical Bulletin of Academia Sinica, Vol. 42, 2001

kDa (n = 8). Therefore, the native enzyme appears to have eight identically-sized subunits.

Electron Microscopic Examination of GS Molecules

The image processing of electron micrographs of negatively stained GS molecules showed the presence of these molecules in various projections (Figure 7A). These projections can be classified into four types (Figure 7B). The first type is the frontal projection showing a round shape with many protrusions over the molecule circumference and a distance about 11.8 ± 0.5 nm (n = 11) across each side (Figure 7C1). The three other types are the lateral projections showing a tetrahedral arrangement with two parallel protein layers in different shapes. There appears to be a 1.6 ± 0.3 nm (n = 7) space between two protein layers. The second and third types of projections are rectangular, but they differ in length and image details (Figures 7C2 and 7C3). The fourth type of projection is in the form of a trapezium (Figure 7C4). These micrographs are very similar to micrographs of GSs from the cytosol of pea leaf (Pushkin et al., 1985) and soya-bean root nodules (McParland et al., 1976). Therefore, we considered the native enzyme to have an octameric structure according to the actual data of molecular masses. However, some micrographs still seem to have a dodecameric structure compared with micrographs of other cyanobacterial GSs (Sampaio et al., 1979; Sawa et al., 1988; Mérida et al., 1990). Thus, though the actual data indicate the enzyme has an octameric structure, the dodecameric structure cannot be excluded. Further study is required to clarify this ambiguity.

Effect of Divalent Metal Ions

Various divalent metal ions were added into the reaction mixture individually with four different concentrations (1 mM, 5 mM, 10 mM and 50 mM) to detect the effect of divalent metal ion on GS activity. The relative reaction rates of biosynthetic activity showed that Mg2+ was the most effective ion, and the next was Co2+, which could support about 56% of the enzyme activity at a 50 mM concentration relatively to Mg2+. At 50 mM of each ion, the observed order of effectiveness of different metal ions was Mg2+>Co2+>Fe2+ >Mn2+>Cu2+>Zn2+ . Ca2+ and Ni2+ had no effect on biosynthetic activity. The relative reaction rate of transferase activity showed that Mn2+ was the most effective ion. Mg2+, Co2+, Ca2+ and Fe2+ were less effective, and the Ni2+ had no effect on transferase activity.

The effect of different divalent metal ions on the Mg2+-supported biosynthetic activity and the Mn2+-supported transferase activity of the enzyme are given in Table 2. Ca2+ and Mn2+ strongly inhibited biosynthetic activity. When 1 mM of Ca2+ or Mn2+ was in the reaction mixture individually, about 13% or 29% of the relative biosynthetic activity was retained, respectively. When the concentration of each ion was higher than 20 mM in the reaction mixture individually, Cu2+, Fe2+, Zn2+, and Ni2+ also showed strong inhibitory effects on biosynthetic activity. However, Co2+ showed a stimulatory effect on biosyn

Figure 5. Thermal inactivation on the biosynthetic (A) and transferase (B) activities of Synechococcus RF-1 GS in the presence or absence of stabilizing ligands. The enzyme was incubated at 45°C in 10 mM Tris-HCl buffer (pH 7.5) containing 2 mM EDTA, 5 mM MgCl2 and 10 mM 2-mercaptoethanol (l); or in Tris-HCl buffer containing 5 mM MgCl2 and 10 mM 2-mercaptoethanol (m); or in Tris-HCl buffer containing 5 mM MgCl2 (p); or in Tris-HCl buffer containing 10 mM 2-mercaptoethanol (r); or in Tris-HCl buffer without any ligand (n). The enzyme was then cooled in an ice bath at designated time intervals, and the residual activity was determined by both biosynthetic and transferase assays.

Figure 6. Effect of pH on the biosynthetic (A) and transferase activities (B) of Synechococcus RF-1 GS. The biosynthetic activity was expressed as µmole Pi produced in 15 min. The transferase activity was expressed as µmole g-glutamyl hydroxamate formed in 15 min. The enzyme activity was assayed at various designated pH values in Tris-HCl (l) and 2-amino-2-methyl-1,3-propanediol-HCl (m) buffers.


Yuan et al. — Glutamine synthetase from Scynechococcus RF-1

thetic activity when its concentration was below 20 mM. The relative biosynthetic activity increased to 158% when 5 mM of Co2+ was present in the reaction mixture, but Co2+ also showed an inhibitory effect at concentrations of 50 mM. Cu2+, Fe2+ and Zn2+ strongly inhibited transferase activity when the concentration of each exceeded 1 mM in the reaction mixture individually, but Mg2+, Co2+, Ca2+, and Ni2+ had less inhibitory effect on transferase activity.

Discussion

GSs from a number of N2-fixing (Stacey et al., 1977; Sampaio et al., 1979; McMaster et al., 1980; Orr et al., 1981) and non-N2-fixing (Florencio and Ramos, 1985; Blanco et

al., 1989; Mérida et al., 1990) cyanobacteria have been purified to homogeneity and characterized. The cyanobacterial GSs purified so far are soluble except that the enzyme from Anacystis nidulans (Emond et al., 1979; Florencio and Ramos, 1985) was membrane-associated. The GS from Synechococcus RF-1 was apparently soluble and was easily extracted without any detergent. The GS could be purified to electrophoretic homogeneity (Figure 2) by a relatively rapid and facile procedure (Table 1) in the presence of EDTA, MgCl2 and 2-mercaptoethanol. According to yield and specific activity in the final purification step, it was estimated that the GS represented approximately 1.2% of the total soluble protein in extracts of cells grown in the nitrogen-free medium. Its comprising

Figure 7. Electron microscopy of Synechococcus RF-1 glutamine synthetase negatively stained with 2% phosphotungstic acid at pH 7.0. The Philips CM 100 electron microscope was set at 80 kV. Electron micrographs of the enzyme molecules were taken at a magnification of 105,000×. Further magnifications by photographic enlargements are shown as Figures 7A (210,000×; the bar marker represents 50 nm) and 7B (420,000×, arrows indicating: 1, the frontal projection of particles in round shape; 2,3 and 4, the lateral projection of particles in different shapes from different sides). Electron micrographs are shown as Figure 7C (1,700,000×).


Botanical Bulletin of Academia Sinica, Vol. 42, 2001


Table 2. Effect of divalent metal ions on the Mg2+-supported biosynthetic activity and Mn2+-supported transferase activity of glutamine synthetase from Synechococcus RF-1a.

Divalent Metal Relative biosynthetic activity (%)b Relative transferase activity (%)b

ion added Concentration of metal ions (mM) Concentration of metal ions (mM)

1 5 20 50 0.1 1 5 10

Nonec 100 100

Mg2+ nod no no no 96 100 84 62

Mn2+ 29 10 6 3 no no no no

Co2+ 119 158 121 72 97 94 68 37

Cu2+ 76 47 1 3 82 36 10 4

Fe2+ 77 39 23 11 97 56 10 7

Ca2+ 13 0 0 0 101 96 47 24

Zn2+ 78 29 1 1 91 87 12 2

Ni2+ 87 35 8 1 94 92 74 47

aA series of designated concentrations of various divalent metal ions were added to both reaction mixtures for assay of the biosynthetic and transferase activities. The glutamine synthetase was preincubated with those reaction mixtures at 30°C for 10 min and assays were performed as described in Materials and Methods except that the biosynthetic reaction was started by adding the L-glutamate. The biosynthetic and transferase activities were determined from the rate of Pi and g-glutamyl hydroxamate formation, respectively.

bThe relative activity is expressed as a percentage of the activity in the standard reaction mixture.

cNone: The activity in the standard reaction mixture.

dno: Without any other divalent metal ion added into the standard reaction mixture.


such a large portion of the total soluble protein demonstrates the importance of GS to the cell under N2-fixing conditions. The elution pattern from the ion exchange column indicated that the GS was eluted with the KCl concentration higher than 0.3 M (Figure 1). It was very similar to the enzyme from some other cyanobacteria (Florencio and Ramos, 1985; Blanco et al., 1989). GSs from both prokaryotic and eukaryotic sources are always purified by various types of affinity chromatography such as Blue Sepharose, Affi-gel Blue, and 2'5'ADP-Sepharose affinity resins (Dowton and Kennedy, 1994). However, the RF-1 GS did not bind to either of these resins even under a variety of different conditions (data not shown).

Three types of GS (GS-I, GS-II and GS-III) have been described based on the molecular size and the number of subunits in the holoenzyme (Woods and Reid, 1993). GS-Is are found uniquely in prokaryotes as dodecameric enzymes with molecular masses of approximately 600 kDa that are composed of 12 identical subunits ranging between 44-60 kDa arranged in two superimposed hexagonal rings (Valentine et al., 1968; Yamashita et al., 1990). GS-IIs are found typically in eukaryotes as octameric enzymes with molecular masses of approximately 350 kDa that are composed of eight identical subunits ranging between 35-50 kDa arranged in the vertices of two superimposed tetrahedron (Meister, 1974; Forde and Cullimore, 1989). However, GS-IIs are also found in plant symbiotic bacteria Rhizobiaceae (Darrow and Knotts, 1977; Fuchs and Keister, 1980; Carlson and Chelm, 1986; Shatters and Kahn, 1989), Frankiaceae (Rochefort and Benson, 1990) and free-living Streptomyces (Behrmann et al., 1990; Kumada et al., 1990). GS-IIIs are also found uniquely in prokaryotes as hexameric enzymes with molecular masses of approximately 500 kDa that are composed of six identical subunits ranging between 70-80 kDa (Goodman and Woods, 1993;

García-Domínguez et al., 1997; Crespo et al., 1998). On the other hand, the GS from photosynthetic bacterium Rhodospirillum rubrum (Soliman and Nordlund, 1989) has a molecular mass of 500-530 kDa, and its subunit has a molecular mass of 52 kDa, indicating that the GS possibly has a decameric structure. Furthermore, the GS from Anabaena flos-aquae (McMaster et al., 1980) has a molecular mass of 430 kDa and appears to belong to a GS-II type enzyme. The GS from Synechococcus RF-1 has a molecular mass of 456 kDa, and its subunit has a molecular mass of 56 kDa. Therefore, the RF-1 GS appears to fall into the GS-II type enzyme that consists of eight apparently identical subunits with octameric structure, and many electron micrographs indicate that the RF-1 GS has a cubic symmetry with a quaternary structure (Figure 7). However, some micrographs also seem to have a dodecameric structure. Thus, the actual data could indicate that the RF-1 GS has an octameric structure, but the dodecameric structure cannot yet be excluded. The interesting thing is that the molecular mass of the native RF-1 GS is much lower than that of the GS-I type enzymes, but the molecular mass of its subunit falls into the range of GS-I type enzymes. Therefore, the Synechococcus RF-1 strain provides an interesting system for studying the molecular evolution from prokaryotes to eukaryotes.

The RF-1 GS showed significant differences in substrate affinities in comparison with other cyanobacterial GSs. In the biosynthetic reaction, the apparent Km value for L-glutamate (2.33 mM) was similar to other reported cyanobacterial GSs, but the enzyme showed positive cooperativity for NH4Cl and ATP. The S0.5 values for NH4Cl (1.33 mM) and ATP (0.94 mM) were higher than the apparent Km values reported for other cyanobacterial GSs (Stacey et al., 1977; Sampaio et al., 1979; Orr et al., 1981; Florencio and Ramos, 1985; Mérida et al., 1990). In the


Yuan et al. — Glutamine synthetase from Scynechococcus RF-1

ing the axenic culture of the RF-1 strain. We also thank Dr. W.N. Jane for assistance in processing electron micrographs, and Ms. H.M. Huang for assistance in computerized image processing of electron micrographs. This research was financed by the Institute of Botany, Academia Sinica, Taipei, Taiwan, ROC.

Literature Cited

Barratt, D.H.P. 1980. Method for detection of glutamine synthetase activity on starch gels. Plant Sci. Lett. 18: 249-250.

Behrmann, Y., D. Hillemann, A. Pühler, E. Statuch, and W. Wohlleben. 1990. Overexpression of a Streptomyces viridochromogenes gene (glnII) encoding a glutamine synthetase similar to those of eukaryotes confers resistance against the antibiotic phosphinothricyl-alanyl-alanine. J. Bacteriol. 172: 5326-5334.

Blanco, F., A. Alaña, M.J. Llama, and J.L. Serra. 1989. Purification and properties of glutamine synthetase from the non-N2-fixing cyanobacterium Phormidium laminosum. J. Bacteriol. 171: 1158-1165.

Bradford, M.M. 1976. A rapid sensitive method for the quantitation of microgram quantities of protein utilizing the principle of protein-dye binding. Anal. Biochem. 72: 248-257.

Carlson, T.A. and B.K. Chelm. 1986. Apparent eukaryotic origin of glutamine synthetase II from the bacterium Bradyrhizobium japonicum. Nature 322: 568-570.

Chen, J. and I.R. Kennedy. 1985. Purification and properties of lupin nodule glutamine synthetase. Phytochemistry, 24: 2167-2172.

Crespo, J.L., M. García-Domíngguez, and F.J. Florencio. 1998. Nitrogen control of the glnN gene that codes for GS type III, the only glutamine synthetase in the cyanobacterium Pseudanabaena sp. PCC 6903. Mol. Microbiol. 30: 1101-1112.

Darrow, R.A. and R.R. Knotts. 1977. Two forms of glutamine synthetase in free-living root-nodule bacteria. Biochem. Biophys. Res. Commun. 78: 554-559.

David, B.J. 1964. Disc electrophoresis. II. Method and application to human serum proteins. Ann. NY Acad. Sci. 121: 404-427.

Dowton, M. and I.R. Kennedy. 1994. Purification of glutamine synthetase by adenosine-affinity chromatography. J. Chromatogr. A, 664: 280-283.

Emond, D., N. Rondeau, and R.J. Cedergren. 1979. Distinctive properties of glutamine synthetase from the cyanobacterium Anacystis nidulans. Can. J. Biochem. 57: 843-851.

Fisher, R., R. Tuli, and R. Haselkorn. 1981. A cloned cyanobacterial gene for glutamine synthetase function in Escherichia coli, but the enzyme is not adenylylated. Proc. Natl. Acad. Sci. USA 78: 3393-3397.

Florencio, F.J. and J.L. Ramos. 1985. Purification and characterization of glutamine synthetase from the unicellular cyanobacterium Anacystis nidulans. Biochem. Biophys. Acta. 838: 39-48.

Forde, B.G. and J.V. Cullimore. 1989. The molecular biology of glutamine synthetase in higher plants. Oxf Surv Plant Mol. Cell Biol. 6: 247-296.

Fuchs, R.L. and D.L. Keister. 1980. Comparative properties of glutamine synthetases I and II in Rhizobium and Agrobacterium spp. J. Bacteriol. 144: 641-648.

transferase reaction, the apparent Km values for L-glutamine (8.70 mM) and hydroxylamine (7.04 mM) were lower than that reported for other cyanobacterial GSs (McMaster et al., 1980; Mérida et al., 1990). The exception is that the enzyme from Phormidium laminosum (Blanco et al., 1989) had an S0.5 value for ATP of 1.90 mM and an apparent Km value for hydroxylamine of 4.10 mM.

The activity of Synechococcus RF-1 GS was very stable at 4°C in the presence of stabilizing ligands, and it seemed more thermostable than the GS from Phormidium laminosum (Blanco et al., 1989). Mg2+ and 2-mercaptoethanol effectively protected both the biosynthetic and transferase activities of the RF-1 GS (Figure 5), and Mg2+ was more effective than 2-mercaptoethanol. The pH optima for both the biosynthetic (pH 8.1) and transferase (pH 8.4) activities of the RF-1 GS (Figure 6) were at least one unit higher than that reported for other cyanobacterial GSs (Stacey et al., 1977; Florencio and Ramos, 1985; Blanco et al., 1989; Mérida et al., 1990). The high pH optima of the enzyme might be an environmental adaptation of the RF-1 cells that grew in the nitrogen-free BG-11 medium (Stanier et al., 1971) at pH 8.0.

Since the GS is an ATP-dependent enzyme, a divalent metal ion is required for enzyme activity. The Synechococcus RF-1 GS requires one also. Mg2+ was the most effective ion for the biosynthetic activity. Co2+ could support about 56% of the enzyme activity at a 50 mM concentration relative to Mg2+. The requirement of different concentrations of different divalent metal ions for enzyme activity might indicate that these metal ions stabilize different conformational states of the enzyme (Sawhney and Nicholas, 1978).

Some reports have indicated that divalent metal ions play an important role in regulating the Mg2+-supported biosynthetic activity of GS (Kingdon et al., 1968; Shapiro and Stadtman, 1970a; Stacey et al., 1979). Our study of divalent metal ions and the Mg2+-supported biosynthetic activity of RF-1 GS showed that Ca2+ and Mn2+ strongly inhibited such activity. In contrast, Co2+ showed a marked stimulating effect on GS activity (Table 2). This is in agreement with the results from Anabaena AC (Stacey et al., 1979), Anabaena cylindrica (Ip et al., 1983) and lupin nodule (Chen and Kennedy, 1985). It can deduce that these metal ions compete for the Mg2+ binding site and have a higher binding constant, or they may have binding sites that are distinct or partially distinct from the Mg2+ binding site. Thus, the initial binding is followed by secondary reactions that vary with the kind of metal ion bound and yield a different conformational state for each metal ion to make different kinetic properties (Segal and Stadtman, 1972). This agrees with the suggestion of Ip et al. (1983) that cyanobacterial GSs may possess two types of metal ion binding sites: one catalytic site involved in substrate binding, and more than one regulatory site, to which activating and inhibitory metal ions bind.

Acknowledgement. We are grateful to Dr. T.-C. Huang of the Institute of Botany, Academia Sinica for providing the pure Synechococcus RF-1 strain and technical assistance in produc


Botanical Bulletin of Academia Sinica, Vol. 42, 2001

García-Domínguez, M., J.C. Reyes, and F.J. Florencio. 1997. Purification and characterization of a new type of glutamine synthetase from cyanobacteria. Eur. J. Biochem. 244: 258-264.

García-Domínguez, M., J.C. Reyes, and F.J. Florencio. 1999. Glutamine synthetase inactivation by protein-protein interaction. Proc. Natl. Acad. Sci. USA 96: 7161-7166.

Goodman, H.J.K. and D.R. Woods. 1993. Cloning and nucleotide sequence of the Butyrivibrio fibrisolvens gene encoding a type III glutamine synthetase. J. Gen. Microbiol. 139: 1487-1493.

Grobbelaar, N., T.-C. Huang, H.-Y. Lin, and T.-J. Chow. 1986. Dinitrogen-fixing endogenous rhythm in Synechococcus RF-1. FEMS Microbiol. Lett. 37: 173-177.

Guerrero, M.G. and C. Lara. 1987. Assimilation of inorganic nitrogen. In P. Fay and C. Van Baalen (eds.), The Cyanobacteria, Elsevier, Amsterdam, pp. 163-186.

Huang, T.-C. and T.-J. Chow. 1986. New type of N2-fixing unicellular cyanobacterium (blue-green alga). FEMS Microbiol. Lett. 36: 109-110.

Ip, M.S., P. Rowell, and W.D.P. Stewart. 1983. The role of specific cations in regulation of cyanobacterial glutamine synthetase. Biochem. Biophys. Res. Commun. 114: 206-213.

Itzhaki, R.F. and D.M. Gill. 1964. A micro-biuret method for estimation proteins. Anal. Biochem. 9: 401-404.

Johansson, B.C. and H. Gest. 1977. Adenylylation/deadenylylation control of the glutamine synthetase of Rhodopseudomonas capsulata. Eur. J. Biochem. 81: 365-371.

Kingdon, H.S., J.S. Hubbard, and E.R. Stadtman. 1968. Regulation of glutamine synthetase. XI. The nature and implications of a lag phase in the Escherichia coli glutamine synthetase reaction. Biochemistry 7: 2136-2142.

Kumada, Y., E. Takano, K. Nagaoka, and C. Thompson. 1990. Streptomyces hygroscopicus has two glutamine synthetase genes. J. Bacteriol. 172: 5343-5351.

Laemmli, U.K. 1970. Cleavage of structural proteins during the assembly of the head of bacteriophage T4. Nature 227: 680-685.

McMaster, B.J., M.S. Danton, T.A. Storch, and V.L. Dunham. 1980. Regulation of glutamine synthetase in the blue green alga Anabaena flos-aquae. Biochem. Biophys. Res. Commun. 96: 975-983.

McParland, R.H., J.G. Guevara, R.R. Becker, and H.J. Evans. 1976. The purification and properties of the glutamine synthetase from the cytosol of soya-bean root nodules. Biochem. J. 153: 597-606.

Meister, A. 1974. Glutamine synthetase of mammals. In P.D. Boyer (ed.), The Enzymes. Vol. 10. Academic Press. New York, pp. 699-754.

Mérida, A., L. Leurentop, P. Candau, and F.J. Florencio. 1990. Purification and properties of glutamine synthetase from the cyanobacteria Synechocystis sp. strain PCC 6803 and Calothrix sp. strain PCC 7601. J. Bacteriol. 172: 4732-4735.

Orr, J., L.M. Keefer, P. Keim, T.D. Nguyen, T. Wellems, R.L. Heinrikson, and R. Haselkorn. 1981. Purification, physical characterization and NH2-terninal sequence of glutamine synthetase from the cyanobacterium Anabaena 7120. J. Biol. Chem. 256: 13091-13098.

Pushkin, A.V., L.P. Antoniuk, N.A. Solovieva, V.V. Shubin, Z.

G. Evstigneeva, W.L. Kretovich, T.V. Cherednikova, V.L. Tsuprun, O.N. Zograf, and N.A. Kiselev. 1985. Glutamine synthetases of pea leaf and seed cytosol. Structure and properties. Biochim. Biophys. Acta 825: 336-350.

Rochefort, D.A. and D.R. Benson. 1990. Molecular cloning, sequencing, and expression of the glutamine synthetase II (glnII) gene from the actinomycete root nodule synbionte Frankia sp. Strain Cpl1. J. Bacteriol. 172: 5335-5342.

Sampaio, M.J., P. Rowell, and W.D.P. Stewart. 1979. Purification and some properties of glutamine synthetase from the nitrogen-fixing cyanobacteria Anabaena cylindrica and a Nostoc sp. J. Microbiol. 111: 181-191.

Sawa, Y., H. Ochiai, K. Yoshida, K. Tanizawa, H. Tanaka, and K. Soda. 1988. Glutamine synthetase from a cyanobacterium Phormidium lapideum: Purification, characterization, and comparison with other cyanobacterial enzymes. J. Biochem. 104: 917-923.

Sawhney, S.K. and D.J.D. Nicholas. 1978. Some properties of glutamine synthetase from Anabaena cylindrica. Planta 139: 289-299.

Segal, A. and E.R. Stadtman. 1972. Variations of the conformational states of Escherichia coli glutamine synthetase by interaction with different divalent cations. Arch. Biochem. Biophys. 152: 367-377.

Shapiro, B.M. and E.R. Stadtman. 1970a. The regulation of glutamine synthetase in microorganisms. Annu. Rev. Microbiol. 24: 501-524.

Shapiro, B.M. and E.R. Stadtman. 1970b. Glutamine synthetase (Escherichia coli). In H. Tabor and W.C. Tabor (eds.), Methods in Enzymology, Vol. 17A. Academic Press, New York and London, pp. 910-912.

Shatters, R.G. and J.L. Kahn. 1989. Glutamine synthetase II in Rhizobium: reexamination of the proposed horizontal transfer of DNA from eukaryotes to prokaryotes. J. Mol. Evol. 29: 422-428.

Soliman, A. and S. Nordlund. 1989. Purification and partial characterization of glutamine synthetase from the photosynthetic bacterium Rhodospirillum rubrum. Biochem. Biophys. Acta 994: 138-141.

Stacey, G., C. van Baalen, and F.R. Tabita. 1979. Nitrogen and ammonia assimilation in the cyanobacteria: Regulation of glutamine synthetase. Arch. Biochem. Biophys. 194: 457-467.

Stacey, G., F.R. Tabita, and C. van Baalen. 1977. Nitrogen and ammonia assimilation in the cyanobacteria: Purification of glutamine synthetase from Anabaena sp. strain AC., J. Bacteriol. 132: 596-603.

Stanier, R.Y., R. Kunisawa, M. Mandel, and G. Cohen-Bazire. 1971. Purification and properties of unicellular blue-green algae (order Chroociccales). Bacteriol. Rev. 35: 171-205.

Valentine, R.C., B.M. Shapiro, and E.R. Stadtman. 1968. Regulation of glutamine synthetase. XII. Electron microscopy of the enzyme from Escherichia coli. Biochemistry 7: 2143-2152.

Woods, D.R. and S.J. Reid. 1993. Recent developments on the regulation and structure of glutamine synthetase enzymes from selected bacterial groups. FEMS Microbiol. Rev. 11: 273-284.

Yamashita, M.M., R.J. Almassy, C.A. Janson, D. Cascio, and D. Eisenberg. 1990. Refined atomic model of glutamine synthetase at 3.5Å resolution. J. Bio. Chem. 264: 17681-17690.


Yuan et al. — Glutamine synthetase from Scynechococcus RF-1

­ì®Ö»E²yĦ RF-1 ¤¤¾¢ñQÓi¦X¦¨ ²¡¤§¯Â¤Æ»P¯S©Ê¤§ÀË´ú

°K¦u¤è¤ýã±Ó©x¿«Þm

¤¤¥¡¬ã¨s°|´Óª«¬ã¨s©Ò

»E²yĦ RF-1 ¤¤¤§¾¢ñQÓi¦X¦¨ ²¡ ¡]GS; EC 6.3.1.2¡^¡A¥iÂÇÂ÷¤l¥æ´«¡B¤À¤l¿zÂo¤Î²B®ñÁC¦Ç¥Û ¡]hydroxyapatite¡^ §lµÛµ¥¼hªR¨BÆJ¡A¯Â¤Æ¦Ü§¡¤@ªºµ{«×¡C¦ÛµMºAªº GS¡A¨ä¤À¤l¶q¬° 456 kDa¡A¨ä¦¸³æ¤¸ ¤§¤À¤l¶q¬° 56 kDa¡C¥Ñ¹q¤lÅã·LÃè¹Ï¤ù¤¤¥i¥H¬Ý¥X¡A¸Ó ²¡¦³¨â¼h³J¥Õ½è¥­¦æ±Æ¦C¡A¥H¥|³æ¤¸¤@²Õ§e¥ßÅé ¹ïºÙªºµ²ºc¡C¦]¦¹¨Ì¹ê»Ú¼Æ¾Ú¡A»{¬°¸Ó ²¡¬O¥Ñ¤K­Ó¤j¤p¬Û¦P¤§¦¸³æ¤¸©Ò²Õ¦¨¡C©ó¥Í¦X¦¨ ²¡¤ÏÀ³¤¤¡A¸Ó ²¡¹ï©ó L-Glutamate ¤§µø Km ­È¬° 2.33 mM¡A¦ý¹ï©ó ATP ( nH = 1.5, S0.5 = 0.94 mM) ¤Î NH4Cl (nH = 2, S0.5 = 1.33 mM) «h§e²{¥¿¨ó¦P©Ê¤§§@¥Î¡C©óÂಾ ²¡¤ÏÀ³¤¤¡A¸Ó ²¡¹ï©ó L-Glutamine ¤Î Hydroxyamine ¤§µø Km ­È¤À§O¬° 8.70 mM ¤Î7.04 mM¡C¸Ó²¡¤§¬¡©Ê©ó§t¦³ EDTA¡BMgCl2 ¤Î 2-Mercaptoethanol ¤§ Tris-HCl ½w½Ä²G (pH 7.5) ¤¤«D±`í©w¡C©ó¥Í¦X¦¨ ²¡¤ÏÀ³¤ÎÂಾ ²¡¤ÏÀ³¤¤¡A³Ì¾A©ó¸Ó ²¡¬¡©Ê¤§ pH ­È¤À§O¬°8.1 ¤Î 8.4¡C¸Ó²¡»Ý­n¨â»ùª÷ÄÝÂ÷¤l¨Ó§@¬°¬¡¤Æ¾¯¡F¹ï©ó¥Í¦X¦¨ ²¡¤§¬¡©Ê¦Ó¨¥¡A Mg2+ ¬°³Ì¦³®Äªºª÷ÄÝÂ÷ ¤l¡A¨ä¦¸¬° Co2+¡F¹ï©óÂಾ ²¡¤§¬¡©Ê¦Ó¨¥¡A Mn2+ ¬°³Ì¦³®Äªºª÷ÄÝÂ÷¤l¡C Ca2+ ¤Î Mn2+ ¹ï©ó¥Ñ Mg2+ Â÷¤l¤ä«ùªº¥Í¦X¦¨ ²¡¤§¬¡©Ê¡A¦³±j¯Pªº§í¨î§@¥Î¡A¦Ó Co2+ «h¦³«P¶i¥Í¦X¦¨ ²¡¬¡©Ê¤§§@¥Î¡C

ÃöÁäµü¡G ÄxºñĦ¡F¾¢ñQÓi¦X¦¨ ²¡¡F»E²yĦ RF-1¡C