Bot. Bull. Acad. Sin. (2001) 42: 173-179

Hwang et al. — RAPD differentiation of Taiwan native Chamaecyparis

RAPD variation in relation to population differentiation of Chamaecyparis formosensis and Chamaecyparis taiwanensis

Shih-Ying Hwang1,*, Huei-Wen Lin1, Yi-Shou Kuo1, and Tsan-Piao Lin2,3

1Graduate Institute of Biotechnology, Chinese Culture University, 55 Hwagan Rd., Yangmingshan, Taipei, Taiwan

2Division of Silviculture, Taiwan Forestry Research Institute, 53 Nanhai Rd., Taipei 100, Taiwan

(Received August 25, 2000; Accepted January 19, 2001)

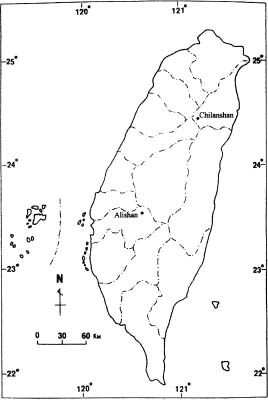
Abstract. The population differentiation of Chamaecyparis formosensis and Chamaecyparis taiwanensis based on random amplified polymorphic DNA (RAPD) variation is described. Two populations (Chilanshan and Alishan) of these two Chamaecyparis species are investigated for population differentiation. Shannon's phenotypic index was used to estimate Ho of these two Chamaecyparis species based on RAPD variation. RAPD analysis showed that the Chilanshan population had higher genetic diversity than the Alishan population in both Chamaecyparis species. These results correlated with the large population found in Chilanshan for both species. Based on RAPD analysis, there was 15.13% population differentiation between Chilanshan and Alishan of C. formosensis compared with 14.73% for C. taiwanensis. Higher levels of genetic variation and population differentiation indicated dynamic evolution in these two Chamaecyparis species in Taiwan as revealed by variation at RAPD loci.

Keywords: Chamaecyparis formosensis; Chamaecyparis taiwanensis; Population differentiation; RAPD.

Introduction

Information on the amount of genetic variation within a species, and its distribution within and between populations would aid in tree conservation planning. Allozyme has been employed to estimate the genetic variation and population divergence in many plant species (Hamrick et al., 1992). However, with the new types of molecular markers one may gain insight into DNA sequences other than nuclear coding loci for population genetic structure and the life history of long-living tree species.

Chamaecyparis formosensis and C. taiwanensis are endemic to Taiwan and are the most valuable timber produced from old-growth forest. According to Lin et al. (1994) there was only 4.6 and 3.9% genetic differentiation among populations of C. formosensis and C. taiwanensis, respectively, based on allozyme data. Chamaecyparis formosensis is found in the elevational range of 800 to 2,500 m, but is most abundant from 1,500 to 2,100 m; C. taiwanensis grows at an elevation of 1,200 to 2,800 m (Liu, 1966). High gene flow would have occurred between populations in these two Chamaecyparis species with low population differentiation based on allozyme analysis. Polymorphisms in the chloroplast genome of C. formosensis and C. taiwanensis were investigated by a PCR-based RFLP (Hwang et al., 2000). No restriction fragment length differences were detected for trnV-trnM or

petG-trnP chloroplast intergenic spacers between Chilanshan and Alishan populations in both Chamaecyparis species.

RAPD, developed by Williams et al. (1990) and Welsh and McClelland (1990), uses random primers to reveal nucleotide sequence variation. RAPD markers are based on the amplification of unknown DNA sequences using single, short, random oligonucleotide primers. The RAPD system has been used in linkage map construction (Grattapaglia and Sedroff, 1994), insect resistance gene localization (Dweikat et al., 1997), hybrid origin identification (Friesen et al., 1997), and breeding utilization (Durham and Korban, 1994; Baril et al., 1997). RAPDs may also be useful for the design of collection strategies to maximize the sampling of genetic variation within the available gene pool (Dawson et al., 1993; Huff et al., 1993; Liu and Furnier, 1993; Nesbitt et al., 1995). Moreover, RAPD markers are capable of detecting variation in non-coding regions of the genome.

The objective of this study was to use RAPD markers to investigate the genetic variation and population differentiation in these two Chamaecyparis species between two populations located in two distant sites separated by high mountains and deep valleys.

Materials and Methods

Plant Materials

Two populations of young needle leaves were collected from natural stands for both C. formosensis and C. taiwanensis from Chilanshan (from 1,500 to 1,700 m in

3Present Address: Department of Botany, National Taiwan University, Taipei 10167, Taiwan.

*Corresponding author. Tel: (02) 28610511 ext. 628; Fax: (02) 28618266; E-mail: hsy9347@ms34.hinet.net


Botanical Bulletin of Academia Sinica, Vol. 42, 2001

elevation) and Alishan (from 2,000 to 2,200 m in elevation) in Taiwan. Chilanshan is located in the north of the central mountain range and Alishan is located in the south of the central mountain range (Figure 1). Chilanshan is a large pure stand for both Chamaecyparis species, and Alishan is a much smaller population for these two species. In addition, the central mountain ridge that straddles from north to south separates the Chilanshan and Alishan populations. Thirty samples each for both species in Chilanshan and Alishan population were collected.

DNA Extraction and Quantification

Leaves (0.3 g) were ground with sea sand and liquid nitrogen, and the ground leaf powder was then placed in 5 ml of extraction buffer for genomic DNA extraction based on a modified CTAB procedure (Doyle and Doyle, 1990). DNA was precipitated with ethanol, and after washing with 70% ethanol, it was dissolved in 200 µl TE buffer, pH 8.0, and placed in 4°C. The DNA concentration was determined for each sample using the GeneQuant II RNA/DNA Calculator (Amersham Pharmacia Biotech).

RAPD Amplification

RAPD reactions were conducted on a DNA Programmable Thermal Cycler (PTC-100, MJ Research) with three steps: Step 1 was 3 min at 94°C. Step 2 was 45 cycles of 1 min at 94°C for denaturation, 1 min at 37°C for annealing, and 2 min at 72°C for polymerization. The last step was 10 min at 72°C for final polymerase reaction. Each reaction contained 500 mM KCl, 15 mM MgCl2, 0.01% gelatin, 100 mM Tris-HCl (pH 8.3), 1 mM dNTPs, 2 µM

Figure 1. Collection localities of Chamaecyparis formosensis and Chamaecyparis taiwanensis.

Table 1. Attributes of oligonucleotide primers used for generating RAPD markers from 60 individuals of Chamaecyparis formosensis sampled from two populations in Taiwan.

Primer Sequence (5'-3') Total number of markers PM and %P

Chilanshan Alishan

P01 CCTGGGCTTC 7 3 (42.9) 4 (57.1)

P04 CCGGCCTTAC 10 3 (30.0) 3 (30.0)

P08 GCGCCCGAGG 12 5 (41.7) 4 (33.3)

P12 TAGCCCGCTT 10 6 (60.0) 5 (50.0)

P13 TAGCCGAGAC 12 10 (83.3) 7 (58.3)

P14 TGACCGAGAC 11 8 (72.7) 6 (54.5)

P15 TACGATGACG 13 11 (84.6) 9 (69.2)

P16 ATTGGGCGAT 9 8 (88.9) 3 (33.3)

P17 GTAGACGAGC 10 7 (70.0) 6 (60.0)

P18 ATCTGGCAGC 9 4 (44.4) 3 (33.3)

P19 GAAACAGCGT 11 7 (63.6) 5 (45.5)

P21 AAGCTGCGAG 11 11(100.0) 1 ( 9.1)

P27 TCCATGCCGT 11 9 (81.8) 6 (54.5)

P38 CAAGGGAGGT 10 4 (40.0) 4 (40.0)

P40 ATGACGACGG 10 9 (90.0) 7 (70.0)

P42 CAAACGGCAC 9 4 (44.4) 2 (22.2)

Pab3 CATCCCCCTG 8 4 (50.0) 3 (37.5)

Total 173 113 (65.3) 78 (45.1)

PM: no. of polymorphic markers; %P: percent of polymorphism.


Hwang et al. — RAPD differentiation of Taiwan native Chamaecyparis

Primer, 20 ng template DNA, 1 µg RNase, and 1.7 unit Taq polymerase (Amersham Pharmacia Biotech), to a final volume of 20 µl. Products amplified by PCR were resolved using 1.75% (w/v) Nusieve 3:1 agarose (FMC BioProducts) gel containing 0.1 g/ml ethidium bromide electrophoresed in 1X TBE under constant voltage (50V) for 2 h. A molecular size marker (fX 174/HaeIII, Stratagene) was used to assign molecular weights for RAPD bands. Images of each gel were viewed by UV illumination, captured by "Grab It" software through a CCD camera, and stored as TIF files. Fifty primers designed by Mosseler et al. (1992) and another 20 primers (AB-0320-Kit 1) purchased from Advanced Biotechnologies (UK) were screened based on band resolution and band number for template DNA samples.

Data Collection and Analysis

All gel photographs were scored for the presence/absence of RAPD bands. The POPGENE computer package (Yeh and Boyle, 1996) was used to calculate Shannon's index of phenotypic diversity for RAPD diploid data according to Ho= -åPi log2Pi. Pi was the frequency of the presence or absence of the amplified fragment. A pairwise matrix of the genetic distances between individuals was obtained using an Euclidean distance measure (Huff et al., 1993), calculated from presence/absence data using RAPD istance (Armstrong et al., 1994). Components of variance partitioned into within and between populations were estimated from this matrix using AMOVA version 1.8 (Analysis of Molecular Variance, Excoffier et al., 1992). The number of permutations for significant testing was set at

1,000 for analysis. AMOVA variance components were used as estimates of the genetic diversity within and between populations.

Results

RAPD Polymorphism

To identify primers that detect polymorphism, 70 primers were screened using genomic DNA from needle leaves of both C. formosensis and C. taiwanensis. Seventeen and twenty primers produced polymorphic RAPD banding profiles for C. formosensis and C. taiwanensis, respectively (Tables 1 and 2). In total, 17 and 20 random primers yielded a total of 173 and 239 reproducible bands for C. formosensis and C. taiwanensis, respectively. On average 55.2% of 173 fragments scored in C. formosensis were polymorphic (65.3 and 45.1% for the Chilanshan and Alishan populations, respectively). For C. taiwanensis, on average 77.8% of 239 scored bands were polymorphic (81.6 and 78.1% for the Chilanshan and Alishan populations, respectively). The number of markers scored per primer ranged from 7 to 13 and from 8 to 17, respectively for C. formosensis and C. taiwanensis (Tables 1 and 2).

Shannon's Phenotypic Index Based on RAPD Variation

Table 3 presents the estimates of Shannon's phenotypic diversity for C. formosensis and C. taiwanensis for RAPD variation. The two Chamaecyparis species differed in the amount of Ho. The amount of Ho for Chilanshan and

Table 2. Attributes of oligonucleotide primers used for generating RAPD markers from 60 individuals of Chamaecyparis taiwanensis sampled from two populations in Taiwan.

PM and %P

Primer Sequence (5'-3') Total number of markers Chilanshan Alishan

P04 CCGGCCTTAC 12 11 (91.7) 11 (91.7)

P05 CCGGCCTTCC 16 14 (87.5) 14 (87.5)

P08 GCGCCCGAGG 12 11 (91.7) 10 (83.3)

P11 GGTGGGGACT 8 1 (12.5) 3 (37.5)

P13 TAGCCGAGAC 14 13 (92.9) 12 (85.7)

P14 TGACCGAGAC 13 11 (84.6) 9 (69.2)

P17 GTAGACGAGC 11 10 (90/9) 9 (81.8)

P19 GAAACAGCGT 12 10 (83.3) 8 (66.7)

P21 AAGCTGCGAG 12 9 (75.0) 9 (75.0)

P22 GGTCTCTCCC 10 7 (70.0) 6 (60.0)

P23 GTCGCATTTC 12 11 (91.7) 11 (91.6)

P27 TCCATGCCGT 12 11 (91.7) 10 (83.3)

P28 GCCTGGTTGC 9 6 (66.7) 3 (33.3)

P30 GAGCCCGTAC 11 7 (63.6) 4 (36.4)

P32 GAAGGCACTG 8 7 (87.5) 2 (25.0)

P34 ACGACGTAGG 10 9 (90.0) 10 (100.0)

P38 CAAGGGAGGT 13 10 (76.9) 10 (76.9)

P40 ATGACGACGG 16 16 (100.0) 15 (93.8)

P44 GCTGGACATC 11 6 (54.5) 5 (45.5)

Pab3 CATCCCCCTG 17 15 (88.2) 16 (94.1)

Total 239 195 (81.6) 177 (78.1)

PM: no. of polymorphic markers; %P: percent of polymorphism.


Botanical Bulletin of Academia Sinica, Vol. 42, 2001

Table 3. Estimates of Shannon's phenotypic diversity index (Ho) for RAPDs for Chilanshan and Alishan populations of Chamaecyparis formosensis and Chamaecyparis taiwanensis.

Chamaecyparis formosensis Chamaecyparis taiwanensis

Shannon's index Shannon's index

Primer Chilanshan Alishan Primer Chilanshan Alishan

P01 0.31 0.358 P04 0.460 0.484

P04 0.187 0.130 P05 0.449 0.419

P08 0.205 0.145 P08 0.537 0.455

P12 0.341 0.333 P11 0.063 0.200

P13 0.536 0.361 P13 0.536 0.408

P14 0.417 0.336 P14 0.447 0.395

P15 0.523 0.402 P17 0.565 0.522

P16 0.481 0.219 P19 0.457 0.368

P17 0.410 0.373 P21 0.418 0.476

P18 0.256 0.187 P22 0.359 0.350

P19 0.383 0.287 P23 0.550 0.572

P21 0.632 0.060 P27 0.556 0.528

P27 0.559 0.319 P28 0.411 0.216

P38 0.229 0.247 P30 0.430 0.225

P40 0.538 0.373 P32 0.503 0.165

P42 0.283 0.154 P34 0.475 0.594

Pab3 0.337 0.257 P38 0.415 0.453

-- P40 0.603 0.557

-- P44 0.264 0.269

-- Pab3 0.469 0.518

Mean 0.390 0.267 Mean 0.448 0.409


Alishan also differed in the same species for RAPD markers. The mean RAPD Ho for C. formosensis was 0.329, with Chilanshan having the higher Ho (0.390) and Alishan the lower (0.267). The mean RAPD Ho for C. taiwanensis was 0.429 with Chilanshan having the higher (0.448) and Alishan the lower (0.409). RAPD Ho also varied among primers within population. For C. formosensis, primer P04 detected the lowest RAPD Ho (0.187) and P21 detected the highest RAPD Ho (0.632) in Chilanshan. Primer P04 also detected the lowest RAPD Ho (0.130), but primer P15 detected the highest RAPD Ho (0.402) in Alishan's C. formosensis. RAPD Ho in C. taiwanensis varied from 0.063 (primer P11) to 0.603 (primer 40) in Chilanshan and from 0.165 (primer P32) to 0.594 (primer P34) in Alishan.

Analysis of Molecular Variance

The results of the AMOVA partitioning of RAPD variance are shown in Table 4. There were highly significant

(P<0.001) genetic differences between the Chilanshan and Alishan populations for both Chamaecyparis in Taiwan. Of the total genetic diversity, 84.9% was attributable to within population and only 15.1% to between populations in C. formosensis. For C. taiwanensis, 85.3% of the total genetic diversity was attributable to within population and 14.7% to between populations.

Discussion

A study of allozyme diversity showed that the average percentage of polymorphic loci per population was 20.6 and 22.5% for C. formosensis and C. taiwanensis, respectively (Lin et al., 1994). Moreover, no restriction length difference was observed for PCR amplified chloroplast DNA fragments among 60 individuals of both Taiwan Chamaecyparis species (Hwang et al., 2000). However, high levels of polymorphism based on RAPD were found

Table 4. Analysis of molecular variance for two populations of Chamaecyparis formosensis and Chamaecyparis taiwanensis based on RAPD variations.

Source of variation df MSD Variance component % Total P value*

Chamaecyparis formosensis

Between populations 1 103.47 2.91 15.13 <0.001

Within populations 58 16.30 16.30 84.87 <0.001

Chamaecyparis taiwanensis

Between populations 1 200.45 5.60 14.73 <0.001

Within populations 58 32.43 32.43 85.27 <0.001

*Nonparametric randomization test (1000 permutation).


Hwang et al. — RAPD differentiation of Taiwan native Chamaecyparis

et al., 1997a). Most RAPD markers (53%) were mapped in the low-copy number region in Eucalyptus grandis and E. urophylla (Grattapaglia and Sedroff, 1994). Thus, it is likely that RAPDs provide an unbiased sample of DNA variation along the whole genome. The greater sensitivity of RAPDs to population divergence may be derived from rapid evolution of non-coding, repetitive DNA sequences detected by RAPDs (Plomion et al. 1995). Although variation detected by RAPD amplification may possibly have no phenotypic consequences, plant gene expression controlled by microsatellites has been reported (Ayers et al., 1997). Moreover, the maintenance of repetitive DNA sequences is important for plants to adapt to unfavorable changes in their environment (Rogers and Bendich, 1987). In conclusion, high levels of genetic polymorphism and genetic differentiation revealed by RAPD analysis might play a role in the dynamic evolution of Chamaecyparis species in Taiwan.

Acknowledgements. We thank Mrs. C.T. Wang and J.C. Yang for their assistance in the field. Financial support provided by the Council of Agriculture (Grant no. 87AST-1.2-FOD-04) to S.Y. Hwang is gratefully acknowledged.

Literature Cited

Aagaard, J.E., S.S. Vollmer, F.C. Sorensen, and F.C. Strauss. 1995. Mitochondrial DNA products among RAPD profiles are frequent and strongly differentiated between races of Douglas-fir. Mol. Ecol. 4: 441-446.

Armstrong, J., A. Gibbs, R. Peakall, and G.F. Weiller. 1994. RAPDistance: Random Amplified Polymorphic DNA Analysis. Computer program distributed by the Australian National University. http://life.anu.edu.au/molecular/software/rapid.html.

Ayers, N.M., A.M. McClung, P.D. Larkin, H.F.J. Bligh, C.A. Jones, and W.D. Park. 1997. Microsatellites and a single-nucleotide polymorphism differentiate apparent amylose classes in an extended pedigree of US rice germ plasm. Theor. Appl. Genet. 94: 773-781.

Baril, C.P., D. Vehaegen, P.H. Vigneron, J.M. Bouvet, and A. Kremer. 1997. Structure of the specific combining ability between two species of Eucalyptus. I. RAPD data. Theor. Appl. Genet. 94: 796-803.

Bradshaw, Jr. H.D., M. Villar, B.D. Watson, K.G. Otto, S. Stewart, and R.F. Stettler. 1994. Molecular genetics of growth and development in Populus. III. A genetic linkage map of a hybrid poplar composed of RFLP, STS, and RAPD markers. Theor. Appl. Genet. 89: 167-178.

Bucci, G., T.L. Kubisiak, W.L. Nance, and P. Menozzi. 1997a. A population `consensus', partial linkage map of Picea abies Karst. based on RAPD markers. Theor. Appl. Genet. 95: 643-654.

Bucci, G., G.G. Vendramin, L. Lelli, and F. Vicario. 1997b. Assessing the genetic divergence of Pinus leucodermis Ant. Endangered populations: use of molecular markers for conservation purposes. Theor. Appl. Genet. 95: 1138-1146.

Dawson, K., K.J. Chalmers, R. Waugh, and W. Powell. 1993. Detection and analysis of genetic variation in Hordeum spontaneum populations from Israel using RAPD markers.

in this study (Tables 1 and 2) for both Chamaecyparis in Taiwan. The genetic parameters estimated from RAPD data indicated that there were substantial levels of genetic diversity in the natural stands of both Taiwan Chamaecyparis species. Based on RAPD variation, a higher percentage of polymorphic loci and higher Shannon's phenotypic diversity (Ho) were observed in Chilanshan compared with Alishan for both Chamaecyparis species. The results probably correlated with the large population size of Chilanshan, which contains more genetic variation.

The majority of RAPD variation in C. formosensis and C. taiwanensis was found within rather than between populations, which agrees with the data collected by allozyme analyses (Lin et al., 1994). That most genetic diversity existed within populations for the two Chamaecyparis species in Taiwan is consistent with the general trend in other outcrossing species (Huff et al., 1993; Nesbitt et al., 1995) based on RAPD variation. Plant species differ markedly in the way genetic diversity is partitioned between populations. The pattern of partitioning is correlated with the mating system and life-history parameters (Hamrick and Godt, 1989). Species that are primarily outcrossing and long-lived have most of their genetic diversity partitioned within populations. Our results are consistent with this pattern. It was reported that during the late Pleistocene, C. formosensis and C. taiwanensis along with other conifers dominated in the Tali glacial stage in Taiwan (Tsukada, 1967). Moreover, Liu (1966) reported that the distribution of the two wind-pollinated Chamaecyparis species is continuous in Taiwan. Therefore, most genetic variation apportioned within populations is not surprising and is possibly due to the high level of gene flow.

It was reported that in red pine (Mosseler et al., 1992) and Amentotaxus formosana Li (Wang et al., 1996), RAPD data concurred with the allozyme data in the level of population differentiation. Agreement between patterns of population structure revealed by isozyme and RAPD markers might suggest that neutral forces are more likely to be invoked than selection (Yeh et al., 1995). However, genetic differentiation between populations by RAPD analysis has been observed among races of Douglas fir with genetic differentiation revealed by RAPD exceeding by three times that for allozymes (Aagaard et al., 1995). Greater genetic divergence between populations revealed by RAPD markers in comparison with allozyme markers was also reported in bigtooth aspen and Pinus leucodermis (Liu and Furnier, 1993; Bucci et al., 1997b). In the present study, genetic differentiation between populations based on RAPD variation was observed to be about three times higher than that based on allozyme analysis (Lin et al., 1994).

Although it is not clear where in the genome RAPD bands are amplified, they are likely to be randomly distributed in the genome as suggested by moderate- and high-resolution RAPD genetic maps (Bradshaw et al., 1994; Grattapaglia and Sedroff, 1994; Gochmen et al., 1996; Bucci


Botanical Bulletin of Academia Sinica, Vol. 42, 2001

Mol. Ecol. 2: 151-159.

Doyle, J.J. and J.L. Doyle. 1990. Isolation of plant DNA from fresh tissue. Focus 12: 13-14.

Durham, R.E. and S.S. Korban. 1994. Evidence of gene introgression in apple using RAPD markers. Euphy. 79: 109-114.

Dweikat, I., H. Ohm, F. Patterson, and S. Cambron. 1997. Identification of RAPD markers for 11 Hesian fly resistance genes in wheat. Theor. Appl. Genet. 94: 419-423.

Excoffier, L., P.E. Smouse, and J.M. Quattro. 1992. Analysis of molecular variance inferred from metric distances among DNA haplotypes: application to human mitochondrial DNA restriction data. Genetics 131: 479-491.

Friesen, N., R. Fritsch, and K. Bachmann. 1997. Hybrid origin of some ornamentals of Allium subgenus Melanocrommyum verified with GISH and RAPD. Theor. Appl. Genet. 95:1229-1238.

Gochmen, B., K.D. Jermstad, D.B. Neale, and Z. Kaya. 1996. Development of random amplified polymorphic DNA markers for genetic mapping in Pacific Yew (Taxus brevifolia). Can. J. For. Res. 26: 497-503.

Grattapaglia, D. and R. Sedroff. 1994. Genetic linkage maps of Eucalyptus grandis and Eucalyptus urophylla using a Pseudo-Testcross mapping strategy and RAPD markers. Genetics 137: 1121-1137.

Hamrick, J.L. and M.J.W. Godt. 1989. Allozyme diversity in plants. In A.H.D. Brown, M.T. Clegg, A.L. Kahler, and B.S. Weir (eds.), Plant Population Genetics, Breeding and Genetic Resources, Sinauer, Sunderland, Massachusetts, pp. 43-63.

Hamrick, J.L., M.J.W. Godt, and S.L. Sherman-Broyles. 1992. Factors influencing levels of genetic diversity in woody plant species. In W.T. Adams, S.H. Strauss, D.L. Copes, and A.R. Griffin (eds.), Population Genetics of Forest Trees, Kluwer Academic, Dordrecht, The Netherland, pp. 95-124.

Huff, D.R., R. Peakall, and P.E. Smouse. 1993. RAPD variation within and among natural populations of outcrossing buffalograss [Buchloe dactyloides (Nutt.) Engelm.]. Theor. Appl. Genet. 86: 927-934.

Hwang, L.H., S.Y. Hwang, and T.P. Lin. 2000. Low chloroplast DNA variation and population differentiation of Chamaecyparis formosensis and Chamaecyparis taiwanensis. Taiwan J. For. Sci. 15: 229-236.

Lin, T. P., T.Y. Lee, L.F. Yang, Y.L. Chung, and J.C. Yang. 1994.

Comparison of the allozyme diversity in several populations of Chamaecyparis formosensis and Chamaecyparis taiwanensis. Can. J. For. Res. 24: 2128-2134.

Liu, T. 1966. Study on the phytogeography of the conifers and taxads of Taiwan. Bull. Taiwan For. Res. Inst. 122: 1-33.

Liu, Z. and G.R. Furnier. 1993. Comparison of allozyme, RFLP, and RAPD markers for revealing genetic variation within and between trembling aspen and bigtooth aspen. Theor. Appl. Genet. 87: 97-105.

Mosseler, A., K.N. Egger, and G.A. Hughes. 1992. Low levels of genetic diversity in red pine confirmed by random amplified polymorphic DNA markers. Can. J. Forest Res. 22: 1332-1337.

Nesbitt, K.A., B.M. Potts, R.E. Vaillancourt, A.K. West, and J.B. Reid. 1995. Partitioning and distribution of RAPD variation in a forest tree species, Eucalyptus globulus (Myrtaceae). Heredity 74: 628-637.

Plomion, C., N. Bahrman, C.E. Durel, and D.M. O'Malley. 1995. Genomic mapping in Pinus pinaster (Maritime pine) using RAPD and protein markers. Heredity 74: 661-668.

Rogers, S.O. and A.J. Bendich. 1987. Ribosomal RNA genes in plants: variability in copy number number and in the intergenic spacer. Plant Mol. Biol. 9: 509-520.

Tsukada, M. 1967. Vegetation in subtropical Formosa during the Pleistocene glaciations and the Holocene. Palaeogeogr. Palaeoclim. Palaeoecol. 3: 49-64.

Wang, C.T., W.Y. Wang, C.H. Chiang, Y.N. Wang, and T.P. Lin. 1996. Low genetic variation in Amentotaxus formosana Li revealed by isozyme analysis and random amplified polymorphic DNA markers. Heredity 77: 388-395.

Welsh, J. and McClelland, M. 1990. Fingerprinting genomes using PCR with arbitrary primers. Nucl. Acids Res. 18: 7213-7218.

Williams, J.G.K., A.R. Kubelik, K.J. Livak, J.A. Rafalski, and S.V. Tingey. 1990. DNA polymorphisms amplified by arbitrary primers are useful as genetic markers. Nucl. Acids Res. 18: 6531-6535.

Yeh, F.C., K.X. Chong, and R.C. Yang. 1995. RAPD variation within and among natural populations of trembling aspen (Populus tremuloides Michx.) from alberta. J. Hered. 86: 454-460.

Yeh, F.C. and T. Boyle. 1996. POPGENE version 1.11, Microsoft Windows-base Software for Population Genetic Analysis.


Hwang et al. — RAPD differentiation of Taiwan native Chamaecyparis

¬õÀÌ»P¥xÆW«ó¬f RAPD ±Ú¸s¤À¤Æ

¶À¤h¿o1 ªL´f¤å1 ³¢©É¨q1 ªLÆg¼Ð2

1 ¤¤°ê¤å¤Æ¤j¾Ç¥Íª«¬ì§Þ¬ã¨s©Ò
2 ¦æ¬F°|¹A©e·|ªL·~¸ÕÅç©Ò¨|ªL¨t

(²{§}¡G¥xÆW¤j¾Ç´Óª«¾Ç¨t)

¥»¤å±´°Q¬õÀÌ»P¥xÆW«ó¬f¤§±Ú¸s¤À¤Æ°ÝÃD¡C¬õÀÌ»P¥xÆW«ó¬fªº´ÏÄõ¤s»Pªü¨½¤s¨â­Ó±Ú¸s¥H³{¾÷ÂX¼W ¦h«¬©Ê DNA ¤À¤l¼Ð°O¬ã¨s±Ú¸s¤À¤Æ¤§°ÝÃD¡C RAPD Åܲ§¥H Shannon's phenotypic index ¨Ó¦ôºâ Ho¡CµL½×¬O¬õÀÌ©Î¥xÆW«ó¬f¤§´ÏÄõ¤s±Ú¸s³£¸ûªü¨½¤s±Ú¸s¦³¸û°ª¤§¿ò¶ÇÅܲ§¡C¤W­zµ²ªG¥i¯à»P´ÏÄõ¤s¬°¬õÀÌ»P¥xÆW «ó¬f¤§¤j±Ú¸s¦³Ãö¡C°ò©ó RAPD ¤§¤ÀªRµo²{¬õÀÌ´ÏÄõ¤s»Pªü¨½¤s±Ú¸s¶¡¦³ 15.14% ¤§¤À¤Æ­È¡A¦Ó¥xÆW«ó ¬f´ÏÄõ¤s»Pªü¨½¤s±Ú¸s¶¡¤À¤Æ­È¬° 14.73%¡CRAPD °ò¦]®y¤§°ªªº¿ò¶ÇÅܲ§»P±Ú¸s¤À¤Æµ{«×¥i¯à¥Nªí¬õÀÌ »P¥xÆW«ó¬f¤§°ÊºAºt¤Æ¦³Ãö¡C

ÃöÁäµü¡G ¬õÀÌ¡F¥xÆW«ó¬f¡F±Ú¸s¤À¤Æ¡F³{¾÷ÂX¼W¦h«¬©Ê DNA ¡C