Bot. Bull. Acad. Sin. (2001) 42: 201-206

Cheng et al. — Genetic relationship among peach cultivars

Genetic diversity and relationship among peach cultivars based on Random Amplified Microsatellite Polymorphism (RAMP)

Hsiu-Yu Cheng, Wei-Chen Yang, and Ju-Ying Hsiao1

Deptartment of Botany, National Chung Hsing University, Taichung, Taiwan, Republic of China

(Received August 24, 2000; Accepted January 11, 2001)

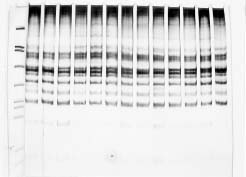
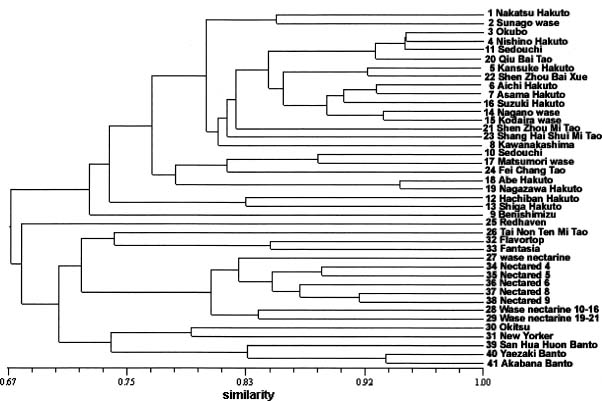
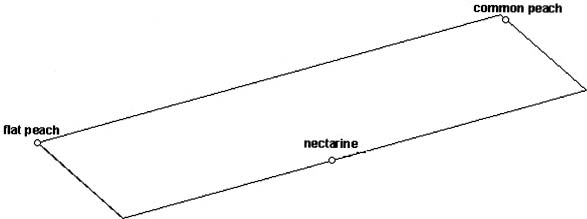
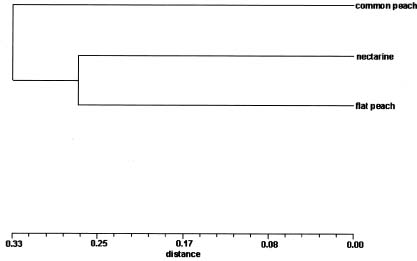
Abstract. Peach (Prunus persica (L.) Batsch) is a common fruit tree species, mainly in the temperate region. It is an important economic plant in Taiwan. In the present study, the genetic relationships among 26 cultivars of common peach (P. persica var. vulgaris Maxim.), 12 cultivars of nectarine (P. persica var. nectarina Maxim.), and three cultivars of flat peach (P. persica var. platycarpa Bailey) were estimated using RAMP markers. Eighty-two polymorphic bands were obtained using ten combinations of primers. The cluster analysis based on RAMP data revealed that the groupings were generally consistent with the classification of the varieties and the regions of origin of cultivars. The common peach cultivars originating in China and Japan formed a cluster. A possible explanation is that the Japanese cultivars may be developed from cultivars introduced from China. Within flat peach cultivars, the groupings also indicated that the genetic relationship among cultivars is correlated with the regions of origin of cultivars. Analysis of molecular variance (AMOVA) revealed that the variance components among and within three peach groups expressed as percentages of the total variation were 30.3% and 69.7%, respectively.

Keywords: Peach; Prunus persica; Genetic relationship; RAMP; AMOVA.

Introduction

Peach (Prunus persica (L.) Batsch) is a common fruit tree in temperate regions. It is considered the queen of temperate-zone fruits and, next to apple, is the world's most widely grown fruit tree (Bailey and Bailey, 1976). Three varieties can be recognized taxonomically based on fruit morphology. The common peach (P. persica var. vulgaris Maxim.) has rounded and hairy fruits. The nectarine (P. persica var. nectarina Maxim.) has rounded fruits without hairs. The flat peach (P. persica var. platycarpa Bailey) has flat fruits. Peach is one of the important economic plants in Taiwan. Besides traditional cultivars, many cultivars of common peach and nectarine were introduced from Japan and United States recently and grown in high altitude areas. The over-utilization of high altitude mountain slopes resulted in soil erosion and the destruction of natural environments. Peach breeding programs in Taiwan, aimed at producing cultivars suitable for lower altitudes, could reduce the destruction of natural environments. Molecular markers such as isozymes (Arulsekar et al., 1986; Durham et al., 1987; Chaparro et al., 1994), RFLP (Eldredge et al., 1992; Rajapakse et al., 1995; Quarta et al., 1996), and RAPD (Chaparro et al., 1994; Rajapakse et al., 1995; Warburton et al., 1996), have been useful in estimating the genetic relationship and in the genetic linkage mapping of the peach genome. The estimation of genetic relationships among cultivars provides the basic information for

breeding programs. Molecular markers could also be used in assisting the process of artificial selection. Random amplified microsatellite polymorphism (RAMP; Wu et al., 1994) has been demonstrated to be another potentially valuable molecular marker for the study of genetic relationships in cultivated plant species. The combination of a simple sequence repeat (SSR; microsatellite) and a random sequence was used to amplify genomic DNA fragments in RAMP. RAMP has been employed in studies of the cultivars of barley (Wu et al., 1994; Becker and Heun, 1995; Sanchez de la Hoz et al., 1996). The usefulness of the RAMP molecular marker has not been widely tested in other plant species. The objectives of the present study are to investigate the genetic relationship of some peach cultivars available in Taiwan and to estimate the genetic diversity among and within major peach groups using RAMP markers.

Materials and Methods

The leaf samples of 41 peach cultivars (Table 1) were collected from the Lona division of the Taiwan Agriculture Research Institute and Mountain Experimental Farm of National Taiwan University and stored at -70°C before DNA extraction. DNA extraction followed the method of Doyle and Doyle (1990). The DNA concentration was measured using a Hoefer TKO 100 fluorometer with Hoechst dye solution. Ten combinations of primers selected between three SSR-primers (RM21, RM23, RM24) and five random primers (A1, A4, B1, Q5, V6; Operon Tech. Inc., USA) were used for RAMP amplifications. The five random primers were also used singularly for RAPD amplifi

1Corresponding author. Tel: 886-4-22840417 ext. 315; Fax: 886-4-22874740; E-mail: jyhsiao@dragon.nchu.edu.tw


Botanical Bulletin of Academia Sinica, Vol. 42, 2001

cations under the same conditions as RAMP. RAMP markers are the bands resulting from the subtraction of the bands of RAPD amplification from the bands of RAMP amplification (Wu et al., 1994). The nucleotide sequences of these SSR and random primers together with the primer combinations used in the present study are listed in Table 2. Reactions were performed in 25 µL volumes containing 1x reaction buffer (12.5 mM Tris-HCl, 1.9 mM MgCl2, 62.4 mM KCl, gelatin 0.12% (w/v), Triton X-100 1.2% (w/v)), 120 µM dATP, dGTP, dTTP, dCTP, 0.2 µM primer, 0.2 units Taq DNA polymerase (HT Biotechnology) and 5 ng of genomic DNA. A thermocycler (Model PTC-100, MJ Research, USA) was programmed for an initial denaturation of 1 min at 94°C followed by one cycle of 150 s at 92°C, 1 min at 40°C, and 2 min at 72°C and 45 cycles of 1 min at 92°C, 1 min at 40°C, and 2 min at 72°C. The amplification was completed after 5 min at 72°C. Reaction products were separated by electrophoresis (Model P9DS, Owl Scientific, Inc., USA) in 7% polyacrylamide gel at 300 V for 130 min at 1°C in 1x TBE buffer and visualized by silver staining (Plusone TM DNA Silver Staining Kit; Pharmacia Biotech Inc., Sweden). A molecular size marker (pGEM DNA Markers, Promega Corporation) was used on each run.

The presence or absence of 82 polymorphic and reproducible RAMP markers were scored for each cultivar. The data were used to calculate a similarity matrix among cultivars employing Dice (1945) algorithm. The similarity matrix was employed in the UPGMA cluster analysis. In the analysis of molecular variance (AMOVA; Excoffier et al., 1992), the Dice similarity was converted into distance by subtracting similarity from one, and then the variance components among and within common peach, nectarine, and flat peach groups were calculated from the distance matrix. The variance components were expressed as percentages, and the significance of each variance component was tested by 10,000 random permutations. The Fst distance matrix among peach groups derived from AMOVA was used in a UPGMA cluster analysis and a principal coordinate analysis.

Results and Discussion

All Cultivars Included

An example of the polymorphism detected among some test samples using SSR primer RM23 and random primer OPV6 is shown in Figure 1. The similarity matrix among peach cultivars based on 82 polymorphic RAMP markers is shown in Table 3. The dendrogram (Figure 2) derived from this similarity matrix revealed that the groupings of common peach were generally consistent with the classification of varieties and the regions of the origin of cultivars. The common peach cultivars originating in China (codes 20-24) and Japan (codes 1-19) formed a cluster while the remaining cultivars (codes 25 and 26) distantly linked to the cluster of nectarine (codes 27-38) and flat peach (codes 39-41). All three cultivars of the flat peach were linked together as a small group before being joined by the nectarine cultivars "Okitsu" (code 30) and "New Yorker" (code 31). Other cultivars of nectarine and a common peach cultivar "Tai Non Ten Mi Tao" (code 26) were linked together as a larger group. Common peach originating in China and Japan did not separate into two distinct clusters. The cophenetic correlation coefficient of this cluster analysis was 0.80.

Common Peach Cultivars Only

When 26 cultivars of common peaches only were considered, the dendrogram (Figure 2) indicated that cultivars originating in China and Japan were linked as a cluster without separating into two groups. A possible explanation is that the Japanese cultivars may be developed from cultivars introduced from China. Cultivars "Redhaven" (codes 25) and "Tai Non Ten Mi Tao" (code 26) that showed relationship with nectarine cultivars were the two most isolated cultivars. Cultivar "Redhaven" originated in the United States while cultivar "Tai Non Ten Mi Tao" is a sport of cultivar "Premier", which was introduced from Brazil. Cultivars "Okubo" (code 3), "Nishino Hakuto" (code 4), and "Odama Hakuto" (code 11) of Japan have the closest relationship. Cultivar "Nishino" was derived from a seedling in a mixed planting of "Okubo" and

Table 1. Peach cultivars studied.

Common peach Nectarine

Originated in Japan Originated in Japan

1 Nakatsu Hakuto 27 Wase nectarine

2 Sunago wase 28 Wase nectarine 10-16

3 Okubo 29 Wase nectarine 19-21

4 Nishino Hakuto 30 Okitsu

5 Kansuke Hakuto

6 Aichi Hakuto Originated in USA

7 Asama Hakuto 31 New Yorker

8 Kawanakashima 32 Flavortop

9 Benishimizu 33 Fantasia 10 Sedouchi 34 Nectared 4

11 Odama Hakuto 35 Nectared 5

12 Hachiban Hakuto 36 Nectared 6

13 Shiga Hakuto 37 Nectared 8

14 Nagano wase 38 Nectared 9

15 Kodaira wase

16 Suzuki Hakuto

17 Matsumori wase

18 Abe Hakuto

19 Nagazawa Hakuto

Flat peach

Originated in China Originated in China

20 Qiu Bai Tao 39 San Hua Huon Banto

21 Shen Zhou Mi Tao

22 Shen Zhou Bai Xue Originated in Japan 23 Shang Hai Shui Mi Tao 40 Yaezaki Banto

24 Fei Chang Tao 41 Akabana Banto

Originated in other countries

25 Redhaven (USA)

26 Tai Non Ten Mi Tao,

a sport of Premier (Brazil)


Cheng et al. — Genetic relationship among peach cultivars

"Hakuto" (which means white peach in Japanese) and one pair of "Wase" (which means early fruiting in Japanese).

Nectarine Cultivars Only

When 12 cultivars of nectarine only were considered, the dendrogram (Figure 2) indicated that cultivars "Nectared 4" (code 34), "Nectared 5" (code 35), "Nectared 6" (code 36),"Nectared 8" (code 37), and "Nectared 9"

"Hakuto" (Yoshida, 1991). This close genealogical relationship was observed in the dendrogram. Other cultivars showing close relationships include "Abe Hakuto" (code 18) and "Nagazawa Hakuto" (code 19); "Nagano Wase" (code 14) and Kodaira Wase" (code 15); "Aichi Hakuto" (code 6) and Asama Hakuto" (code 7). Although we do not know the genealogy of these cultivars, the dendrogram showed a close relationship between two pairs of

Table 2. Nucleotide sequences of the primers and primer combination used.

Primer Sequence

SSR primer

RM21 5'-CTCCGCCGCCG-3'

RM23 5'-GGCACCACCAC-3' RM24 5'-GCAACAACAAC-3' Random primer

OPA1 5'-CAGGCCCTTC-3'

OPA4 5'-AATCGGGCTG-3'

OPB1 5'-GTTTCGCTCC-3'

OPQ5 5'-CCGCGTCTTG-3'

OPV6 5'-ACGCCCAGGT-3'

Primer combination

A1/RM23 Q5/RM23

A4/RM23 Q5/RM24

A4/RM24 V6/RM21

B1/RM23 V6/RM23

B1/RM24 V6/RM24

Figure 1. An example of the polymorphism detected among some test samples using ISS primer RM23 and random primer OPV6. (left to right: lane 1, 100 bp marker; lane 2 - lane 14, cultivar codes 27, 34-38, 28-33, and 40).

Figure 2. Dendrogram of all peach cultivars studied based on polymorphic RAMP markers.


Botanical Bulletin of Academia Sinica, Vol. 42, 2001

Table 3. Simility matrix among peach cultivars based on polymorphic RAMP bands.

cultivar 1 2 3 4 5 6 7 8 9 10 11 12 13 14 15 16 17 18 19 20 21 22 23 24 25 26 27 28 29 30 31 32 33 34 35 36 37 38 39 40 41 codes

1 1.000

2 0.854 1.000

3 0.846 0.847 1.000

4 0.824 0.826 0.945 1.000

5 0.750 0.777 0.846 0.843 1.000

6 0.843 0.844 0.873 0.889 0.863 1.000

7 0.800 0.804 0.870 0.830 0.840 0.925 1.000

8 0.763 0.788 0.800 0.816 0.804 0.854 0.851 1.000

9 0.659 0.652 0.711 0.727 0.756 0.750 0.721 0.723 1.000

10 0.698 0.688 0.766 0.783 0.884 0.804 0.778 0.782 0.784 1.000

11 0.863 0.844 0.945 0.944 0.863 0.870 0.849 0.816 0.750 0.804 1.000

12 0.747 0.769 0.696 0.719 0.795 0.764 0.742 0.690 0.686 0.730 0.719 1.000

13 0.737 0.784 0.777 0.772 0.842 0.752 0.747 0.708 0.617 0.729 0.772 0.833 1.000

14 0.796 0.781 0.830 0.846 0.837 0.904 0.863 0.848 0.714 0.805 0.827 0.706 0.722 1.000

15 0.825 0.827 0.857 0.854 0.866 0.913 0.871 0.837 0.747 0.828 0.854 0.786 0.771 0.929 1.000

16 0.825 0.827 0.857 0.835 0.887 0.913 0.891 0.857 0.771 0.841 0.874 0.786 0.750 0.869 0.918 1.000

17 0.708 0.757 0.750 0.745 0.833 0.804 0.800 0.845 0.732 0.884 0.765 0.723 0.716 0.816 0.845 0.804 1.000

18 0.742 0.729 0.722 0.716 0.719 0.779 0.817 0.778 0.720 0.810 0.758 0.734 0.659 0.791 0.822 0.800 0.809 1.000

19 0.739 0.727 0.740 0.735 0.739 0.776 0.813 0.796 0.744 0.805 0.755 0.732 0.681 0.787 0.839 0.796 0.848 0.941 1.000

20 0.835 0.855 0.919 0.936 0.835 0.862 0.822 0.827 0.742 0.753 0.917 0.725 0.745 0.819 0.827 0.846 0.757 0.729 0.747 1.000

21 0.723 0.752 0.824 0.840 0.830 0.840 0.776 0.758 0.750 0.782 0.820 0.691 0.731 0.833 0.863 0.800 0.787 0.667 0.711 0.832 1.000

22 0.796 0.800 0.868 0.846 0.918 0.904 0.843 0.747 0.762 0.818 0.846 0.776 0.804 0.840 0.869 0.848 0.816 0.703 0.723 0.838 0.833 1.000

23 0.755 0.743 0.830 0.788 0.796 0.865 0.882 0.768 0.643 0.809 0.827 0.698 0.680 0.820 0.828 0.869 0.755 0.769 0.745 0.781 0.750 0.800 1.000

24 0.652 0.687 0.720 0.735 0.783 0.796 0.729 0.731 0.795 0.857 0.714 0.684 0.681 0.809 0.817 0.774 0.783 0.729 0.705 0.687 0.800 0.809 0.702 1.000

25 0.584 0.646 0.660 0.653 0.674 0.674 0.667 0.644 0.640 0.625 0.695 0.597 0.591 0.659 0.711 0.711 0.652 0.634 0.659 0.646 0.667 0.659 0.637 0.682 1.000

26 0.591 0.632 0.604 0.617 0.614 0.617 0.565 0.584 0.514 0.691 0.617 0.560 0.598 0.644 0.629 0.629 0.682 0.593 0.595 0.589 0.651 0.622 0.578 0.643 0.568 1.000

27 0.680 0.731 0.743 0.718 0.680 0.777 0.792 0.735 0.602 0.636 0.738 0.612 0.604 0.768 0.755 0.755 0.701 0.711 0.667 0.712 0.632 0.687 0.727 0.645 0.711 0.629 1.000

28 0.696 0.747 0.740 0.755 0.630 0.776 0.771 0.753 0.634 0.627 0.755 0.642 0.659 0.766 0.753 0.710 0.717 0.729 0.727 0.727 0.689 0.702 0.681 0.682 0.706 0.667 0.817 1.000

29 0.714 0.800 0.736 0.750 0.673 0.769 0.725 0.727 0.612 0.607 0.750 0.667 0.660 0.760 0.788 0.747 0.714 0.681 0.723 0.762 0.750 0.700 0.660 0.681 0.725 0.622 0.747 0.842 1.000

30 0.645 0.680 0.693 0.687 0.645 0.687 0.680 0.596 0.675 0.635 0.707 0.561 0.565 0.653 0.660 0.681 0.645 0.651 0.674 0.680 0.615 0.653 0.632 0.629 0.674 0.659 0.745 0.711 0.695 1.000

31 0.558 0.602 0.596 0.630 0.558 0.630 0.600 0.644 0.740 0.623 0.630 0.533 0.518 0.591 0.575 0.575 0.628 0.633 0.634 0.624 0.571 0.568 0.523 0.659 0.633 0.615 0.621 0.723 0.636 0.795 1.000

32 0.596 0.653 0.686 0.700 0.532 0.660 0.633 0.611 0.617 0.612 0.680 0.530 0.538 0.667 0.653 0.611 0.638 0.690 0.667 0.693 0.652 0.604 0.625 0.667 0.621 0.698 0.716 0.791 0.708 0.681 0.714 1.000

33 0.607 0.674 0.624 0.681 0.581 0.681 0.659 0.644 0.632 0.684 0.652 0.564 0.565 0.719 0.652 0.607 0.682 0.699 0.667 0.667 0.667 0.629 0.629 0.729 0.543 0.785 0.667 0.753 0.711 0.744 0.759 0.851 1.000

34 0.625 0.699 0.712 0.706 0.667 0.725 0.700 0.701 0.610 0.667 0.706 0.612 0.653 0.714 0.722 0.742 0.667 0.652 0.652 0.680 0.702 0.633 0.673 0.696 0.764 0.705 0.845 0.804 0.796 0.753 0.651 0.723 0.705 1.000

35 0.584 0.674 0.645 0.659 0.628 0.723 0.681 0.621 0.640 0.634 0.652 0.564 0.588 0.674 0.652 0.652 0.636 0.627 0.619 0.624 0.690 0.652 0.629 0.706 0.667 0.709 0.778 0.786 0.756 0.814 0.709 0.690 0.767 0.886 1.000

36 0.645 0.740 0.693 0.707 0.667 0.768 0.742 0.723 0.582 0.674 0.687 0.659 0.652 0.800 0.787 0.723 0.731 0.698 0.674 0.680 0.747 0.695 0.737 0.742 0.674 0.682 0.809 0.809 0.800 0.667 0.602 0.725 0.800 0.839 0.800 1.000

37 0.673 0.743 0.755 0.750 0.694 0.788 0.765 0.727 0.643 0.667 0.731 0.667 0.701 0.780 0.788 0.747 0.735 0.703 0.702 0.705 0.771 0.740 0.720 0.766 0.747 0.711 0.828 0.851 0.840 0.737 0.659 0.771 0.787 0.898 0.854 0.905 1.000

38 0.713 0.778 0.771 0.766 0.713 0.822 0.781 0.745 0.690 0.674 0.785 0.674 0.680 0.777 0.784 0.765 0.752 0.723 0.701 0.741 0.727 0.757 0.718 0.722 0.745 0.688 0.882 0.887 0.816 0.755 0.703 0.768 0.745 0.871 0.851 0.837 0.913 1.000

39 0.624 0.680 0.713 0.707 0.645 0.707 0.701 0.660 0.675 0.667 0.707 0.585 0.630 0.674 0.723 0.681 0.731 0.721 0.719 0.680 0.659 0.695 0.632 0.674 0.698 0.706 0.723 0.800 0.737 0.733 0.747 0.813 0.744 0.753 0.744 0.733 0.779 0.796 1.000

40 0.571 0.593 0.609 0.622 0.595 0.622 0.614 0.659 0.648 0.658 0.644 0.575 0.627 0.605 0.659 0.635 0.690 0.727 0.725 0.615 0.585 0.581 0.558 0.600 0.649 0.658 0.659 0.716 0.651 0.691 0.757 0.707 0.649 0.690 0.623 0.667 0.698 0.697 0.815 1.000

41 0.541 0.587 0.624 0.615 0.612 0.615 0.652 0.651 0.667 0.701 0.659 0.514 0.571 0.621 0.674 0.651 0.706 0.744 0.741 0.609 0.578 0.598 0.598 0.617 0.692 0.649 0.698 0.732 0.644 0.732 0.773 0.747 0.667 0.706 0.641 0.659 0.690 0.711 0.854 0.932 1.000


Cheng et al. — Genetic relationship among peach cultivars

Table 4. Variance components of common peach, nectarine, and flat peach groups based on RAMP data.

Source of variation d.f. SSD MSD Variance component % Total variance P-value*

Among groups 2 116.48 58.24 4.59 30.3 < 0.001

Within groups 38 401.20 10.56 10.56 69.7 < 0.001

*After 10,000 permutations.

(code 38) that have one or two common parents (Yamaguchi, 1985; Yoshida, 1991; Baird et al., 1992) were linked as a cluster. The Japanese "Wase nectarine" (code 27) showed a relationship with this cluster. Other cultivars showing close relationships include "Flavortop" (code 32) and "Fantasia" (code 33); "Wase nectarine 10-16" (code 28) and "Wase nectarine 19-21" (code 29). The cultivar "Okitsu" (code 30), which originated in Japan from "Precoce de Croncels" x "Lord Napier" (Okie, 1998), was most closely related to the cultivar "New Yorker" (code 31). The cultivars "Precoce de Croncels" and "Lord Napier" were not included in the present study.

Flat Peach Cultivars Only

Three cultivars of flat peaches were analyzed in the present study. Dendrogram (Figure 2) indicated that the Japanese "Yaezaki Banto" (code 40) linked to Japanese "Akabana Banto" (code 41) first and was then joined by the Chinese "San Hua Huon Banto" (code 39). The genealogy of these cultivars is unknown. However, the result also indicated that the genetic relationship among cultivars is correlated with the regions of cultivar origin.

AMOVA

The result of AMOVA (Table 4) indicated that the variance components expressed as percentages of the total variation among and within groups were 30.3% and 69.7%, respectively. The random permutation test revealed that both variance components were highly significant (p< 0.001). Considerable genetic differentiation was observed among three peach groups based on RAMP data, and a large percentage (30.3%) of the total variation was attributable to the difference among groups.

Table 5. Fst distance matrix among common peach, nectarine, and flat peach groups.

Common peach Nectarine Flat peach

Common peach 0.000

Nectarine 0.282 0.000

Flat peach 0.378 0.266 0.000

Figure 4. The result of principal coordinate analysis based on Fst distance matrix among groups.

Dendrogram Among Peach Groups

The Fst distances between groups (Table 5) were derived from AMOVA. The result of the cluster analysis based on Fst distance matrix is shown in Figure 3. The dendrogram indicated that nectarine and flat peach are closely related while common peach is a more isolated group. However, the cophenetic correlation coefficient of this cluster analysis was only 0.61, indicating a large distortion in the clustering. The result of principal coordinate analysis is shown in Figure 4. The three coordinates accounted for 100% of the total variation without any distortion. Nectarine is located between common peach and flat peach in this diagram. Table 5 shows that nectarine is also closely related to common peach with Fst of 0.282. The largest distance (0.378) exists between common peach and flat peach.

Acknowledgements. This work was made possible by a grant (NSC88-2311-B005-015) from the National Science Council of the Republic of China. The authors thank an anonymous reviewer for the helpful suggestions and critical review of the manuscript.

Literature Cited

Arulsekar, S., D.E. Parfitt, and D.E. Kester. 1986. Comparison of isozyme variability in peach and almond cultivars. J.

Figure 3. Dendrogram of peach varieties based on Fst distances.


Botanical Bulletin of Academia Sinica, Vol. 42, 2001

Hered. 77: 272-274.

Bailey, L.H. and E.Z. Bailey. 1976. Hortus Third. MacMillan Publishing Co., Inc., New York.

Baird, V., L. Belthoff, R. Ballard, R. Scorza, A. Callahan, R. Monet, and A. Abbott. 1992. Analysis of the nuclear genome, and construction of a genetic map for peach (Prunus persica (L.) Batsch). HortScience 27: 92.

Becker, J. and M. Heun. 1995. Mapping of digested and undigested random amplified microsatellite polymorphisms in barley. Genome 38: 991-998.

Chaparro, J.X., D.J. Werner, D. O'Malley, and R.R. Sederoff. 1994. Targeted mapping and linkage analysis of morphological, isozyme and RAPD markers in peach. Theor. Appl. Genet. 87: 805-815.

Dice, L.R. 1945. Measures of the amount of ecologic association between species. Ecology 26: 297-302.

Doyle, J.J. and J.L. Doyle. 1990. Isolation of plant DNA from fresh tissue. Focus 12: 13-15.

Durham, R.E., G.A. Moore, and W.B. Sherman. 1987. Isozyme banding patterns and their usefulness as genetic marker in peach. J. Amer. Soc. Hort. Sci. 112: 1013-1018.

Eldredge, L., R. Ballard, W.V. Baird, and A. Abbortt. 1992. Application of RFLP analysis to genetic linkage mapping in peaches. HortScience 27(2): 160-163.

Excoffier, L., P.E. Smouse, and J.M. Quattro. 1992. Analysis of molecular variance inferred from metric distances among DNA haplotypes: application to human mitochondrial

DNA restriction data. Genetics 131: 479-491.

Okie, W.R. 1998. Handbook of Peach and Nectarine Varieties. USDA-ARS Agriculture Handbook.

Quarta, R., M.T. Dettori, I. Verde, P. Laino, S. Sabatini, A. Vantaggi, and R. Sciarroni. 1996. Restriction fragment length polymorphism analysis in peach. Acta Hort. 374: 61-65.

Rajapakse, S., L.E. Belthoff, G. He, A.E. Estager, R. Scorza, I. Verde, R.E. Ballard, W.V. Barid, A. Callahan, R. Monet, and A.G. Abbott. 1995. Genetic linkage mapping in peach using morphological, RFLP and RAPD markers. Theor. Appl. Genet. 90: 503-510.

Sanchez de la Hoz, M.P., J.P. Davila, Y. Loarce, and E. Ferrer. 1996. Simple sequence repeat primers used in polymerase chain reaction amplifications to study genetic diversity in barley. Genome 39: 112-117.

Warburton, M.L., V.L. Becerra-Velasquez, J.C. Goffreda, and F.A. Bliss. 1996. Utility of RAPD markers in identifying genetic linkages to genes of economic interest in peach. Theor. Appl. Genet. 93: 920-925.

Wu, K.S., R. Jones, L. Danneberger, and P. Scolnik. 1994. Detection of microsatellite polymorphisms without cloning. Nucleic Acids Res. 22: 3257-3258.

Yamaguchi, M. 1985. Encyclopedia of fruit tree: peach and plum. Nosangiosonbunkakyokai (in Japanese).

Yoshida, M. 1991. The newest horticultural technique of fruit tree. Asakurashoden (in Japanese).

À³¥Î³{¾÷ÂX¼W·L½Ã¬P¦h«¬©Ê¬ã¨s®ç®â°ö«~ºØ¶¡¤§¿ò¶Ç
ª[²§«×¤Î¿ò¶ÇÃö«Y

¾G¨q¥É ·¨°¶¨° ¿½¦p­^

°ê¥ß¤¤¿³¤j¾Ç´Óª«¾Ç¨t

®ç¡]Prunus persica (L.) Batsch¡^¬°¤@ºØ±`¨£·Å±aªG¾ð¡A¦b¥xÆW¬O¤@ºØ­«­n¸gÀÙ§@ª«¡C¥»¬ã¨sÀ³¥Î³{¾÷ ÂX¼W·L½Ã¬P¦h«¬©Ê¤À¤l¼Ð°O±´°Q 26 ­Ó¥Í­¹®ç®â°ö«~ºØ¡B 12 ­Óªo®ç®â°ö«~ºØ¤Î 3 ­ÓÂÏ®ç®â°ö«~ºØ¶¡¤§¿ò ¶ÇÃö«Y¡C±Ä¥Î 10 ²Õ¤Þ¤l²Õ¦X±o¨ì 82 ±ø¦h«¬©Ê±ø±a¡A®Ú¾Ú¦¹µ¥¦h«¬©Ê±ø±a¼Æ¾Ú¶i¦æÂk¸s¤ÀªR¡AÂk¸sµ²ªG Åã¥Ü¤j­P»PÅܺؤÀÃþ¤Î²£¦a§k¦X¡C²£¦Û¤¤°ê©M¤é¥»ªº¥Í­¹®ç«~ºØÂk¬°¤@¸s¡A¥i¯àªº­ì¦]¬O¤é¥»ªº«~ºØ¤D¥Ñ ¤¤°ê«~ºØ¨|ºØ¦Ó¦¨¡C¤TºØÂÏ®ç«~ºØ¶¡ªºÃö«Y¤]Åã¥Ü»P²£¦a¦³Ãö¡C¤À¤lÅܤè¤ÀªR¤§µ²ªGÅã¥Ü¤T¸s®ç¤§¸s¶¡©M ¸s¤ºÅܤ覨¤À¦U¦ûÁ`Åܤ覨¤À¤§ 30.3% ©M 69.7%¡C

ÃöÁäµü¡G ®ç¡FÁ¥Á¨¬ì¡F¿ò¶ÇÃö«Y¡F RAMP¡FAMOVA¡C