Bot. Bull. Acad. Sin. (2003) 44: 43-52

Chang and Yang — Microalgae for biofixation of carbon dioxide

Some characteristics of microalgae isolated in Taiwan for biofixation of carbon dioxide

Ed-Haun Chang1 and Shang-Shyng Yang*

Department of Agricultural Chemistry, National Taiwan University, Taipei, Taiwan 10617

(Received February 22, 2002; Accepted August 13, 2002)

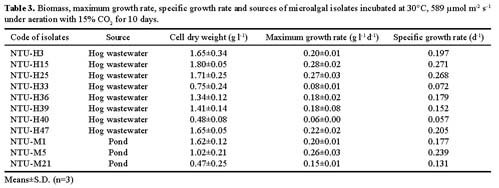
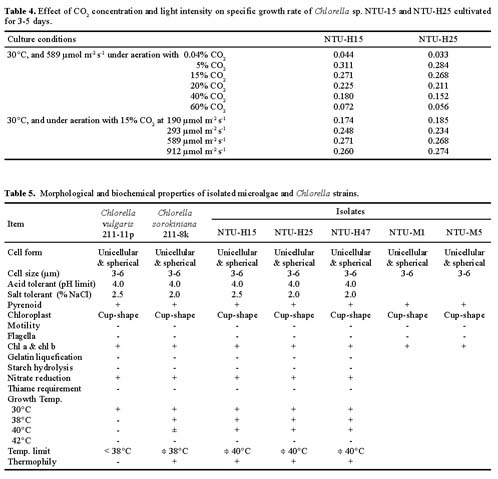
Abstract. To contribute the biological mean of CO2 fixation, more than 200 microalgal isolates were screened from lakes, ponds, sediments, hog wastewater, paddy fields, hot springs, and seawater in Taiwan. Two unicellular microalgae, Chlorella sp. NTU-H15 and Chlorella sp. NTU-H25, were isolated from hog wastewater. In the laboratory, they were able to grow up even in aeration containing CO2 up to 40% and have growth rates of 0.21 to 0.22 g dry wt l-1 d-1 at 20% CO2. Both algae had the same growth rate in the range from 5 to 40% CO2 and had a similar light response between 190 and 589 µmol m-2 s-1. Chlorella sp. NTU-H15 had a higher growth rate than Chlorella sp. NTU-H25 at pH 4.0 and ³35°C. Chlorella sp. NTU-H15 was able to tolerate high concentrations of CO2, high cell density, and a broad-range of temperature and pH. Each liter of Chlorella sp. NTU-H15 produced 1.8 g of dry cell. The maximum growth rate was 0.28 g dry wt l-1 d-1, and the specific growth rate was 0.27 d-1 at 15% CO2. Each mg of chlorophyll produced 1.6 mM O2 min-1 at 700 µmol m-2 s-1 at 30°C and 10 mM NaHCO3. While each liter of Chlorella sp. NTU-H25 produced 1.7 g of dry cell, the maximum growth rate was 0.27 g dry wt l-1 d-1, and the specific growth rate was 0.27 d-1. Both isolates are suitable for dense cultivation to fix CO2 directly and to produce cell biomass.

Keywords: Biofixation; Carbon dioxide; Chlorella; Growth rate and microalga.

Introduction

Global warming induced by increasing concentrations of greenhouse gases in the atmosphere is a matter of great environmental concern. Carbon dioxide is the principal greenhouse gas. Atmospheric CO2 has increased from 280 to 368 ppmv in the last 200 years and is responsible for about 50% enhancement in the greenhouse effect (Karube et al., 1992). Annual anthrophogenic emissions of CO2 are estimated to be 2 × 10¹⁰ tons, primarily from combustion of fossil fuels in association with an increasing population and industrialization. Recently, many attempts have been made to reduce atmospheric CO2. Physical and chemical treatments have been used to separate and recover CO2. Microalgal photosynthesis has increasingly received attention as a means of reducing the emission of CO2 into the atmosphere and producing industrially valuable compounds (Kodama et al., 1993; Kurano et al., 1995a; Lee et al., 1998; Yang et al., 2000).

Biofixation and utilization of CO2 by microalgae are among the most productive biological methods of treating industrial waste emissions, and the yield of biomass per acre is three to fivefold greater than from typical crops (Law and Berning, 1991; Akimoto et al., 1994). Direct use of flue gas reduces the cost of pretreatment, but the high concentration of CO2 and the presence of SOx and NOx inhibit the growth of cyanobacteria and microalgae

(Kurano et al., 1995b). A few works have recently reported the isolation of highly CO2-tolerant microalgae and cyanobacteria for biological fixation of CO2, such as Anacystis, Botryococcus, Chlamydomonas, Chlorella, Emiliania, Monoraphidium, Rhodobacter, Scenedesmus, Spirulina and Synechococcus (Hanagata et al., 1992; Takeuchi et al., 1992; Kodama et al., 1993; Sawayama et al., 1995; Takano and Matsunaga, 1995; Watanabe and Hall, 1995; Yamada et al., 1995; Zeiler et al., 1995; Ike et al., 1996; Yun and Park, 1997; Sung et al., 1999). The goal of this study is to isolate microalgae in Taiwan which can tolerate high CO2 concentrations and high temperatures in order to biofix carbon dioxide and discover the optimal conditions for biomass production.

Materials and Methods

Sources of Isolates

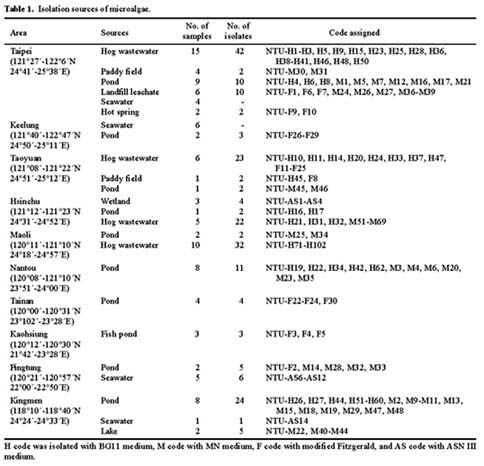
Microalgae were isolated from several samples taken from rivers, lakes, ponds, paddy fields, sediments, hog wastewater, ocean and hot springs in Taiwan (Table 1).

Culture Media

Medium BG-11 contained (g l-1): NaNO3, 1.5; K2HPO4•3H2O, 0.04; MgSO4•7H2O, 0.075; CaCl2•2H2O, 0.036; citric acid, 0.006, ferric ammonium citrate, 0.006; Na2EDTA, 0.001; Na2CO3, 0.02 and trace metal solution 1 ml (including H3BO3 2.86 g, MnCl2•4H2O 1.81 g, ZnSO4•7H2O 0.222 g, Na2MoO4•2H2O 0.390 g, CuSO4•5H2O 79 mg and Co(NO3)2•6H2O 49.4 mg per liter) at pH 7.4. Me

1Present address: Mackay Junior College of Nursing.

*Corresponding author. Tel: 886-2-23621519; Fax: 886-2-23679827; E-mail: ssyang@ccms.ntu.edu.tw


Botanical Bulletin of Academia Sinica, Vol. 44, 2003

dium M4N contained (g l-1): KNO3, 5.0; KH2PO4, 1.25; CaCl2, 0.01; FeSO4•7H2O, 0.003; MgSO4•7H2O, 2.5 and A5 solution, 1 ml (containing H3BO3 2.86 g, MnCl2•4H2O 1.81 g, CuSO4•5H2O 80 mg, ZnSO4•7H2O 220 mg, Na2MoO4 210 mg and 1 drop of conc. H2SO4 per liter). Both media were used for the isolation of cyanobacteria and microalgae from fresh water (Rippka et al., 1979).

Medium ASN III contained (g l-1): NaNO3, 0.75; K2HPO4•3H2O, 0.002; MgSO4•7H2O, 0.038; CaCl2•2H2O, 0.018; citric acid, 0.003, ferric ammonium citrate, 0.003; Na2EDTA, 0.0005; Na2CO3, 0.02, seawater, 750 ml and trace metal solution 1 ml at pH 8.3, and was used for the isolation of cyanobacteria and microalgae from sea water (Rippka et al., 1979). MN medium contained (g l-1): KNO3, 1; MgSO4•7H2O, 0.25; NaCl, 0.1; Na2EDTA, 0.016; FeSO4•7H2O, 0.002 and trace element solution 1 ml

(containing H3BO3, 2.86 g; MnSO4•4H2O, 1.30 g; CuSO4•5H2O, 1.8 g, ZnSO4•7H2O, 0.22 g; Na2MoO4, 0.021 g per 1iter) and was used for the isolation of microalgae from lakes and ponds (Mayo, 1997). Modified Fitzgerald medium contained (g l-1): NaNO3, 0.496; KH2PO4, 0.039; CaCl2, 0.036; Na2EDTA, 0.001; MgSO4•7H2O, 0.075, Na2CO3, 0.020; Na2SiO3•9H2O, 0.058; ferric citrate, 0.006; citric acid, 0.006 and Caffron solution 1 ml (containing H3BO3 3.1 g, MnSO4•4H2O, 2.23 g; ZnSO4•7H2O, 287 mg; (NH4)6 Mo7O24•4H2 O, 88 mg; Co(NO3)2•4H2O, 146 mg; Na2WO4•2H2O, 33 mg; KBr, 119 mg; KI, 83 mg; Cd(NO3)2 •4H2O, 154 mg; NiSO4(NH4)2SO4•6H2O, 198 mg; VOSO4•2H2O, 20 mg; Al2(SO4)3•K2SO4•24H 2O, 474 mg and 0.05 M H2SO4 1 drop per liter), and was used for the isolation of microalgae from hot spring and fresh water (Takeuchi et al., 1992).


Chang and Yang — Microalgae for biofixation of carbon dioxide

Light Response

To measure the photosynthetic capacity of isolates, cells were harvested by centrifugation at 3,000 g for 10 min and then resuspended in 50 mM pH 7.0 Hepes buffer to give a density of 20 to 24 µg chl ml-1 in the presence of 10 mM NaHCO3. Light was supplied by a quartz-halogen bulb in the range from 0 to 2,300 µmol m-2 s-1, and the intensity was controlled with neutral filter. Light response curve was determined using a Clark-type electrode (Yellow Springs, USA) at 30°C.

Chemical and Physical Analyses

pH. Sample pH was determined directly with a pH meter (Mode Sentron 2001).

Nitrate content. Nitrate concentration was assayed according to Cawse (1967). A sample of 1 ml was mixed with alumina cream (4 ml) and then centrifuged at 3,000 g for 5 min. The supernatant (1 ml) was reacted with sulfuric acid solution (1 ml) for 2 min, then diluted with 5% perchloric acid to 10 ml, and the absorbance measured at 210 nm. Authentic potassium nitrate was used as a standard in the concentration range from 0 to 10,000 µM.

Phosphate content. Phosphate was assayed as described by Strickland and Parsons (1968). Phosphomolybdate complex in acid molybdate solution was reduced by ascorbic acid to a blue color, and the absorbance was measured at 885 nm. Authentic dibasic potassium phosphate was used as a standard in the range from 0 to 30 µM.

Light intensity. Light intensity was determined with Toshiba API-5 photometer.

Chlorophyll content. Chlorophyll was extracted by 95% ethanol, and the absorbance was measured at 649, 655 and 665 nm. The chlorophyll a and b content was calculated by the following equations:

Ca (µg ml-1) = 13.7 A665nm - 5.76 A649nm,

Cb (µg ml-1) = 25.8 A649nm - 7.60 A665nm, and

Ca+b (µg ml-1) = 1000/39.8 ×A655nm) (Wintermans and De Mots, 1965; Liu et al., 1981).

Results and Discussion

Isolation of CO2 Tolerant Microalgae

217 colonies of cyanobacteria and microalgae were isolated from 110 water samples taken from lakes, ponds, rivers, landfill leachates, hog wastewater, paddy fields, wetlands, hot springs, sediments, and seawater in Taiwan with the appropriate media (Yang et al., 2000). After a series of transfers, 98 isolates survived. Hog wastewater was the major source for the isolation of cyanobacteria and microalgae (119 isolates), followed by ponds (63 isolates), landfill leachates (10 isolates), and seawater (7 isolates). These isolates were primarily cultivated at 30°C, 392 µmol m-2 s-1, and aerated with air at 0.15 vvm for 10 days. The culture broth had absorption peaks between 440 and 480 nm, between 680 and 690 nm, and a shoulder at 660 nm

Isolation of Carbon Dioxide-Fixing Microalgae

Samples were precultivated in an appropriate broth at 30°C and 392 µmol m-2 s-1 for 1 week and subcultivated for another week. Then the culture broth was smeared on different solid media and cultivated at 30°C and 392 µmol m-2 s-1 for 1 week. Colonies were picked and transferred to the same media for purification. To isolate the high CO2-tolerant strains, the culture broth was aerated with 10% and 20% CO2 at 30°C and 589 µmol m-2 s-1 for 1 week. Microbial growth was detected by the optical density at 680 nm, and isolates with optical densities higher than 2.0 after 4 days incubation were selected for further study.

Measurement of Growth Rate

Microalgae was cultivated in 1 l flat bottles and at 30°C and 392 (or 589) µmol m-2 s-1 under aeration with air or air containing different concentrations of CO2 at 0.15 vvm for 1 week. The growth rate of microalgae was measured by both the optical density at 680 nm and by the cell dry weight. Cells were harvested by Millipore (0.45 µm) filtration, washed twice with distilled water, and dried at 105°C overnight. Linear growth rate was calculated from the logarithmic growth over 2 to 4 days cultivation. Specific growth rate was calculated from the slope of growth rate and biomass yield at each cultivation condition.

Morphological Observation and Biochemical Test

Morphological properties of isolates were observed under a light microscope (Olympus BH-2, Japan). Biochemical and physiological characters used for the identification of isolates included nitrate reduction, mannitol utilization, vitamin requirement, acidity, salinity and temperature tolerance, gelatin liquefaction, and starch hydrolysis.

Carbon Dioxide Determination

Carbon dioxide concentration was analyzed by gas chromatography using a thermal conductivity detector as follows: Gas sample (1 ml) was injected into a Shimadzu 14A gas chromatograph (Shimadzu Co., Japan) with a glass column (0.26 mm × 2.0 m) packed with Porapack Q (80/100 mesh). The column temperature was set at 150°C, and the injection and the detector temperatures were set at 200°C. Carbon dioxide concentration was calculated with a standard curve from 0.1 to 1000 mg kg-1 (v/v) (Yang and Chang, 1997; Chang et al., 2001).

Effect of Carbon Dioxide on Cell Growth

Isolates were precultivated at 30°C and 589 µmol m-2 s-1 in a 500 ml conical flask with 300 ml BG-11 medium and bubbled with air or air containing 5 to 40% CO2 at 0.15 vvm for 6 days. Then, the cultures were transferred to 1 l flat bottles with 800 ml medium at an initial algal concentration of 0.02 g l-1 (wet weight) and cultivated under the same conditions for 8 to 10 days. Microalgae growth was determined by both the optical density at 680 nm and by the cell dry weight.


Botanical Bulletin of Academia Sinica, Vol. 44, 2003


Chang and Yang — Microalgae for biofixation of carbon dioxide

(data not shown). There was a linear correlation between the optical density at 680 nm and the cell dry weight. The log of optical density and the dilution factors were Y= 9.748X - 0.069 (R2=0.999), Y=9.339X - 0.008 (R2=0.999), Y= 8.138X - 0.053 (R2=0.999) and Y= 9.146X - 0.052 (R2=0.997) for isolates NTU-H15, NTU-H25, NTU-H47 and NTU-M1, respectively, where Y is the log of optical density and X is the dilution factor. Therefore, the optical density at 680 nm was used as the growth parameter of the isolated cyanobacteria and microalgae.

Effect of CO2 Concentration on Cell Growth

To investigate the effect of CO2 concentration on the growth of the isolated cyanobacteria and microalgae, the isolates were incubated at 30°C and 589 µmol m-2 s-1 under aeration with different concentrations of CO2 at 0.15 vvm for 6 to 10 days. It was shown that most microalgae grew slowly in air aeration conditions; only isolate NTU-H4 had an optical density at 680 nm higher than 2.0 (Table 2). When these isolates were incubated under aeration with 10% CO2, 25 isolates had an optical density at 680 nm higher than 2.0, and 22 isolates had cell dry weight higher than 0.5 g l-1 among 59 tested isolates over 5 days cultivation. The maximal optical density was 3.06 while the minimal value was only 0.02. The maximal cell dry weight was 0.79 g l-1, and the minimal one was 0.06 g l-1 (Table 2). When incubated under aeration with 20% CO2 for 5 days, 13 of the 47 tested isolates had an optical density at 680 nm that was higher than 2.0. The maximal optical density was 2.81, and the minimal value was 0.08. From the cell growth under aeration with 10% and 20% CO2, isolates NTU-H3, NTU-H15, NTU-H25, NTU-H33, NTU-H36, NTU-H39, NTU-H40, NTU-H47, NTU-M1, NTU-M5 and NTU-M21 were selected for further studies. Flue gas contains 13 to 15% CO2, meaning these isolated microalgae were incubated at 30°C and 589 µmol m-2 s-1 under aeration with 15% CO2. Cell dry weight increased on incubation. Five isolates had a cell dry weight higher than 1.6 g l-1, and the maximal growth rate was more than 0.18 g l-1 d-1 (Table 3). The specific growth rates of these five isolates were be

tween 0.177 and 0.271 d-1 during 2 to 8 days incubation. Isolates NTU-H15 and NTU-25 had high cell biomass and appropriate specific growth rate during 2 to 6 days cultivation (0.268 to 0.271 d-1). Cell biomass of Chlorella sp. K35 and Oocystis sp. was only 1.0 g l-1 when they were cultivated in the broth under aeration with 10 to 20% CO2 for 10 days (Hanagata et al., 1992; Takeuchi et al., 1992). Isolates NTU-H15 and NTU-H25 were screened from the hog wastewater. They could tolerate high concentration of salts and had high growth rates at 15% CO2. Therefore, these two algae were used for this CO2 fixation study.

The effect of CO2 concentration on the cell growth of Chlorella sp. NTU-H15 and NTU-H25 is shown in Figure 1. Aeration with addition of CO2 stimulated cell growth, and both strains had a maximal growth at 5% CO2, which decreased gradually with increasing CO2 concentration. A long lag period was observed under aeration with 40% CO2, and the cell growth decreased significantly. Both strains had a maximal linear growth rate under aeration with 5% CO2 (between 0.28 and 0.31 g l-1 d-1). This rate decreased slightly under aeration with 15 to 20% CO2 (from 0.21 to 0.27 g l-1 d-1), fell moderately under aeration with 40% CO2 (between 0.15 and 0.18 g l-1 d-1), and plunged under aeration with 60% CO2 (between 0.06 and 0.07 g l-1 d-1) (Table 4). Kodama et al. (1993) reported that Chlorococcum littorale, a highly CO2-tolerant microalgal strain, had growth rates of 0.4, 0.3, 0.2 and 0 g l-1 d-1 at 5, 20, 40 and 70% CO2, respectively. Hanagata et al. (1992) indicated that two CO2-tolerant microalgae, Scenedesmus sp. and Chlorella sp., had growth rates between 0.15 and 0.18 g l-1 d-1 at 10 to 40% CO2, and they could not grow at 60% CO2. Sung et al. (1999) showed that Chlorella KR-1 had growth rates of 1.1, 0.8, 0.6 and 0.1 g l-1 d-1 under aeration with 10, 30, 50, and 70% CO2, respectively. Sivla and Pirt (1984) reported that CO2 at PCO2 ³ 0.6 atm had a significantly inhibitory effect on the growth of Chlorella. The same phenomenon was also found in this study. The growth rates of our isolates were lower than those of Chlorococcum littorale and Chlorella KR-1, but they had higher growth rates than those of Scenedesmus sp. and


Botanical Bulletin of Academia Sinica, Vol. 44, 2003

erage phosphate and nitrate uptake rate was about 60 µM d-1 and 2 mM d-1, respectively. Kurano et al. (1995a) reported that 17 mM nitrate was consumed completely and phosphate uptake ceased after 50 h cultivation of Chlorococcum littorale. The average phosphate uptake of Chlorococcum littorale was about 300 µM d-1. When Oocystis sp. was cultivated under aeration with 10 and 20% CO2, it exhausted 6 mM nitrate at Day 6 and Day 13 (Takeuchi et al., 1992). Healey (1982) reported that phosphate and nitrogen metabolism were closely related and changed with the N/P ratio of lakes and the phytoplanktonic population. Phosphate might be a limiting factor for Chlorella sp. NTU-H15 growth in BG11 medium. Cell dry weight increased from 1.14 to 1.52 g l-1 after 7 days incubation when the phosphate concentration was doubled (400 µM) (data not shown).

Chlorella sp. This might be due to the CO2-tolerance and different culture conditions of Chlorococcum and Chlorella KR-1. The growth rate of isolates of Chlorella sp. NTU-H15 and NTU-H25 might be improved by the adaptation of carbon dioxide enrichment and by the adjustment of culture conditions.

Culture pH decreased dramatically at the initial growth stage, increased gradually with cultivation, and reached a plateau of pH 6.9 after more than 8 days incubation. Cell mass increased with cultivation for 8 days (Figure 2). Phosphate is one of the major nutrients for the normal growth of algae and plays an important role in most cellular processes (Vonshak, 1986). Phosphate and nitrate concentrations plummeted at the early growth stage. After 5 days of cultivation, phosphate concentration was below detection, and the cell concentration increased slowly. Av


Chang and Yang — Microalgae for biofixation of carbon dioxide

Identification of Isolated Microalgae

Some morphological and chemical characteristics of these five isolates and authentic strains are summarized in Table 5. All of them were unicellular spheroids with a diameter of 3-6 µm. Each cell had one cup-shaped chloroplast with a distinctive pyrenoid. Chlorophylls a and b were presented. No sexual reproduction was observed. They formed autospores inside the cell and multiplied to two, four, or more individuals. In addition, all isolates had a cell growth limit at pH 4.0, 2.0% NaCl and 40°C. Nitrate reduction activity was observed, but starch hydrolysis and gelatin liquefaction were not detected. On the basis of these characters and thermo-tolerance, these five isolates were fundamentally identical and belonged to the genus Chlorella (Harold and Michael, 1978; Kessler, 1985). Chlorella sorokiniana was able to grow at temperatures up to 38-42ºC (Kessler, 1985). The enzyme activity and molecular phylogeny of these isolates were analyzed for species identification as Kessler (1985) and Huss et al. (1999) described. The results of this species identification and molecular phylogeny will be published and discussed hereafter (Chang and Yang, unpublished data).

Figure 2. Cell growth and nutrient profile of Chlorella sp. NTU-H15 aerated with 15% CO2. ¢, cell mass; ~, pH; p, phosphate; r, nitrate.

Effect of Cultivation Temperature

The growth rates of the Chlorella isolates showed significant inhibition at incubation temperatures £ 28°C or ³ 42°C. Chlorella sp. NTU-H15 had a high growth rate at 35 and 39°C (A680 nm = 1.50) while Chlorella sp. NTU-H25 had a high value at 30°C (A680 nm = 1.51). The optical density was only 0.05 to 0.20 when they were cultivated at 25, 28 or 42°C. Kessler (1985) reported that C. sorokiniana had an upper growth limit at 38 to 42°C, and temperature tolerance appeared as a species-specific character in the genus Chlorella. Hanagata et al. (1992) indicated that Chlorella sp. strain 35 had a five-day lag phase when it was cultivated at 40°C. Sung et al. (1999) showed that 30°C was the maximal growth temperature of Chlorella KR-1. The isolate Chlorella sp. NTU-H15 had high thermostability at 39°C and was able to tolerate a high CO2 concentration (40%). Therefore, this isolate might have a high potential for biofixation of CO2 emitted from coal-fired thermal power plants.

Effect of pH

The linear growth rate of Chlorella sp. NTU-H15 was 0.12 g l-1 d-1 at an initial pH of 3.5, increased gradually to 0.24 g l-1 d-1 at an initial pH of 6.0, and remained constant at an initial pH of 7.0. The cell growth of Chlorella sp. NTU-H15 was inhibited at an initial pH below 3.0. Kodama et al. (1993), Sung et al. (1999) and Morita et al. (2000) also reported that the growth of Chlorococcum littorale, Chlorella KR-1, and Chlorella sorokiniana was not affected by culture pH when the value was higher than pH 4.0, and the growth rate was inhibited drastically at pH 3.0. In this study, Chlorella sp. NTU-H15 was able to grow at pH 3.5 to 7.0. This characteristic is very important and suitable for stack gases using the cultivation of Chlorella for biomass production.

Effect of Light Intensity

Chlorella sp. NTU-H25 had a high growth rate at a light intensity of 589 to 912 µmol m-2 s-1, and the growth rate decreased at 190 to 293 µmol m-2 s-1. Chlorella sp. NTU-H15 had the highest growth rate at a light intensity of 589

Figure 1. Effect of carbon dioxide concentration on the growth rate of Chlorella isolates at 30°C and 589 µmol m-2 s-1. (a) Chlorella sp. NTU- H15; (b) Chlorella sp. NTU- H25. ~, 0.035% CO2; ™, 5% CO2; q, 15% CO2; s, 20% CO2; ¢, 40% CO2.


Botanical Bulletin of Academia Sinica, Vol. 44, 2003

µmol m-2 s-1, a lower rate at 912 and 293 µmol m-2 s-1, and the lowest rate at 190 µmol m-2 s-1 (Figure 3). Chlorella sp. NTU-H25 had a high growth rate at light intensity of 912 and 589 µmol m-2 s-1, followed by 293 and 190 µmol m-2 s-1. Saturating light intensity for the tested Chlorella strains was about 589 µmol m-2 s-1. Low light intensity reduced the growth rate and biomass production.

The effect of light intensity on the photosynthetic oxygen evolution of Chlorella sp. NTU-H15 is shown in Figure 4. Oxygen evolution increased with the increasing of light intensity, becoming saturated at around 700 µmol m-2 s-1 at 30ºC and 10 mM NaHCO3. Each mg of chlorophyll produced 1.6 µM O2 min-1. The light intensity saturation of Chlorella sp. NTU-H15 was higher than that of Oocystis sp. (around 300 µmol m-2 s-1) (Takeuchi et al., 1992), Chlorella sp. and Scenedesmus sp. (around 200 µmol m-2 s-1) (Hanagata et al., 1992), and was equivalent to that of Chlorella sp. isolated from hot spring (about 800 µmol m-2 s-1) (Murakami et al., 1998). Therefore, Chlorella sp. NTU-H15 and NTU-H25 had a higher growth rate than Chlorella sp. or Scenedesmus sp. due to the high light intensity saturation. But the oxygen evolution of chlorophyll in Chlorella sp. NTU-H15 was lower than that of Oocystis sp. (each mg produced 2.5 µM O2 min-1) (Takeuchi et al., 1992), perhaps due to the high light intensity saturation in Chlorella sp. NTU-H15. During incubation of Chlorella sp. NTU-H15, the light intensity was only around 600 µmol m-2 s-1; therefore, the growth rate of Chlorella sp. NTU-H15 might be improved if the cultures were grown under high light intensity and a sufficient nutrient supply.

In conclusion, the local isolates Chlorella sp. NTU-H15 and NTU-H25 grew well at high temperature, high cell density, high CO2 concentration, and over a broad-range of pH values. They are suitable strains for large-scale, dense cultivation with industrial discharge gases to fix CO2 directly to reduce global warming and create a cell biomass for producing industrially valuable compounds.

Acknowledgements. The authors thank Professors Y. C. Hsieh, Dr. C. R. Lan and Miss Y. Y. Horng for their helpful discussion and comments. Thanks also to the Taiwan Power Company and Power Development Foundation for financial support (NSC89-TPC-7002-017).

Literature Cited

Akimoto, M., T. Ohara, K. Ohtaguchi, and K. Koide. 1994. Carbon dioxide fixation and a-linolenic acid production by the hot-spring alga Cyanidium caldarium. J. Chem. Eng. Japan 27: 329-333.

Cawse, P.A. 1967. The determination of nitrate in soil solution by ultraviolet spectrophotometry. Analyst 92: 311-355.

Chang, T.C., Y.C. Luo, and S.S. Yang. 2001. Determination of greenhouse gases by open-path gas-type FTIR spectroscopy. Food Sci. Agric. Chem. 2: 7-14.

Hanagata, N., T. Takeuchi, Y. Fukuju, D.J. Barnes, and I. Karube. 1992. Tolerance of microalgae to high CO2 and high temperature. Phytochemistry 31: 3345-3348.

Harold, C.B. and J.W. Michael. 1978. Division Chlorophycophyta. In Introduction to the Algae. Prentice-Hall Press, USA, pp. 63-244.

Healey, F.P. 1982. Phosphate. In N. G. Carr, and B. A. Whitton (eds.), The Biology of Cyanobacteria. Blackwell Scientific, Oxford, pp. 120-140.

Huss, V.A.R., C. Frank, E.C. Hartmann, M. Hirmer, A.

Figure 3. Effect of light intensity on algal growth rate of Chlorella aerated with 15% CO2. (a) Chlorella sp. NTU-H15; (b) Chlorella sp. NTU-H25. ~, 190 µmol m-2 s-1; ™, 293 µmol m-2 s-1; q, 589 µmol m-2 s-1; s, 912 µmol m-2 s-1.

Figure 4. Effect of light intensity on photosynthetic O2 evolution of Chlorella sp. NTU-H15 at 30°C and 10 mM NaHCO3.


Chang and Yang — Microalgae for biofixation of carbon dioxide

Kloboucek, B.M. Seidel, P. Wenzeler, and E. Kessler. 1999. Biochemical taxonomy and molecular phylogeny of the genus Chlorella sensu lato (Chlorophyta). J. Phycol. 35: 587-598.

Ike, A., C. Saimura, K. Hirata, and K. Miyamoto. 1996. Environmental friendly production of H2 incorporating microalgal CO2 fixation. J. Mar. Biotech. 4: 47-51.

Karube, I., T. Takeuchi, and D.J. Barnes. 1992. Biotechnolgical reduction of CO2 emissions. Adv. Biochem. Eng./Biotech. 46: 63-79.

Kessler, E. 1985. Upper limits of temperature for growth in Chlorella (Chlorophyceae). Plant Syst. Evol. 151: 67-71.

Kodama, M., H. Ikemoto, and S. Miyachi. 1993. A new species of highly CO2-tolerant fast growing marine microalga suitable for high density culture. J. Mar. Biotech. 1: 21-25.

Kurano, N., H. Ikemoto, H. Miyashita, T. Hasegawa, and S. Miyachi. 1995a. Carbon dioxide uptake rate of Chlorococcum littorale. J. Mar. Biotech. 3: 108-110.

Kurano, N., H. Ikemoto, H. Miyashita, T. Hasegawa, H. Hata, and S. Miyachi. 1995b. Fixation and utilization of carbon dioxide by microalgal photosynthesis. Energy Convers. Mgmt. 36: 689-692.

Law, E.A. and J.L. Berning. 1991. Photosynthetic efficiency optimization studies with macroalga Gracilaria tikvihae: Implication for CO2 emission control from power plants. Biores. Technol. 37: 25-33.

Lee, C.Y., S.F. Bai, F.L. Chang, and C.H. Chen. 1998. Utilization of carbon dioxide with microalgae and its application. In H. C. Lin and S. S. Yang (eds.), Greenhouse Gases Effect and Energy Development. Biomass Energy Society of China, Taipei, Taiwan, pp. 94-108.

Liu, C.Y., C.Y. Wang, and S.S. Yang. 1981. Seasonal variation of the chlorophyll contents of Gracilaria Cultivated in Taiwan. In T. Levring (ed.), Proceedings of the International Seaweed Symposium. Vol. 10. Walter de Gruyter & Co., Berlin, Germany, pp. 455-460.

Mayo, A.W. 1997. Effects of temperature and pH on the kinetic growth of unialga Chlorella vulgaris cultures containing bacteria. Water Environ. Res. 69: 64-72.

Morita, M., Y. Watanabe, and H. Saiki. 2000. High photosynthetical productivity of green microalga Chlorella sorokiniana. Appl. Biochem. Biotech. 87: 203-218.

Murakami, M., F. Yamada, T. Nishide, T. Muranaka, N. Yamaguchi, and Y. Takimoto. 1998. The biological CO2 fixation using Chlorella sp. with high capability in fixing CO2. Stud. Surface Sci. Catal. 114: 315-320.

Rippka, R., J. Deruelles, J.B. Waterbury, M. Herdman, and R.Y. Stanier. 1979. Genetic assignments, strain histories and

properties of pure cultures of cyanobacteria. J. Gen. Microbiol. 111: 1-61.

Sawayama, S., S. Inoue, Y.D. Dote, and S.Y. Yokoyama. 1995. CO2 fixation and oil production through microalga. Energy Convers. Mgmt. 36: 729-731.

Sivla, H.J. and S.J. Pirt. 1984. Carbon dioxide inhibition of photosynthetic growth of Chlorella. J. Gen. Microbiol. 130: 2833-2838.

Strickland, J.D.H. and T.R. Parsons. 1968. A practical handbook of seawater analysis. Fish. Res. Board Canada Bull. No. 167: 211-229.

Sung, K.D., J.S. Lee, C.S. Shin, S.C. Park, and M.J. Choi. 1999. CO2 fixation by Chlorella sp. KR-1 and its cultural chracterisistics. Biores. Technol. 68: 269-273.

Takano, H. and T. Matsunaga. 1995. CO2 fixation by artifical weathering of waste concrete and coccolithophorid algae cultures. Energy Convers. Mgmt. 36: 697-700.

Takeuchi, T., K. Utsunomiya, K. Kobayashi, M. Owada, and I. Karbue. 1992. Carbon dioxide fixation by a unicellular green Alga Oocystis sp. J. Biotech. 25: 261-267.

Vonshak, A. 1986. Laboratory techniques for the cultivation of microalgae. In A. Richmond (ed.), Handbook of Microalgal Mass Cultures. CRC Press, FL. pp.117-199.

Watanabe, Y. and D.O. Hall. 1995. Photosynthetic CO2 fixation technologies using a helical tubular bioreactor incorporating the filamentous cyanobacterium Spirulina platensis. Energy Convers. Mgmt. 36: 721-724.

Wintermans, J.F.G.M. and A. De Mots. 1965. Spectrophotometric characteristics of Chlorophylls a and b and their pheophytins in ethanol. Biochim. Biophy. Acta 109: 448-453.

Yamada, H., N. Ohkuni, S. Kajiwara, and K. Ohtaguchi. 1995. CO2-removal characteristics of Anacystis nidulans R2 in airlift bioreactors. Energy Convers. Mgmt. 36: 349-352.

Yang, S.S. and E.H. Chang. 1997. Effect of fertilizer application on methane emission/production in the paddy soils of Taiwan. Biol. Fertil. Soils 25: 245-251.

Yang, S.S., E.H. Chang, J.Y. Lee, Y.Y. Horng, and C.R. Lan. 2000. Isolation and application of carbon dioxide fixation microbes in Taiwan. Month. J. Taipower's Eng. 624: 65-82.

Yun, Y.S. and J.M. Park. 1997. Development of gas recycling photobioreactor system for microalgal carbon dioxide fixation. Korean J. Chem. Eng. 14: 297-300.

Zeiler, K.G., D.A. Heacox, S.T. Toon, K.L. Kadam, and L.M. Brown. 1995. The use of microalgae for assimilation and utilization of carbon dioxide from fossil fuel-fired power plant flue gas. Energy Convers. Mgmt. 36: 707-712.


Botanical Bulletin of Academia Sinica, Vol. 44, 2003