Bot. Bull. Acad. Sin. (2004) 45: 339-346

Cheng — Statistical approaches on discriminating spatial variation of species diversity

Statistical approaches on discriminating spatial variation of species diversity

Chi-Chuan CHENG*

Division of Forest Management, Forestry Research Institute, Council of Agriculture, Taipei 100, Taiwan, Republic of China

(Received May 12, 2003; Accepted May 19, 2004)

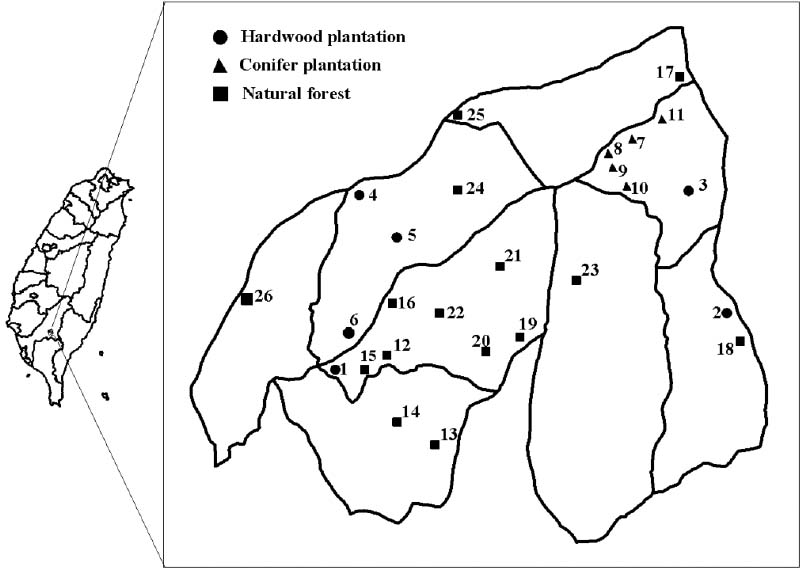
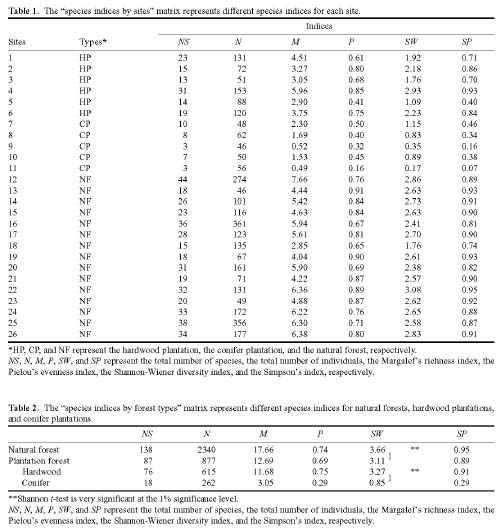
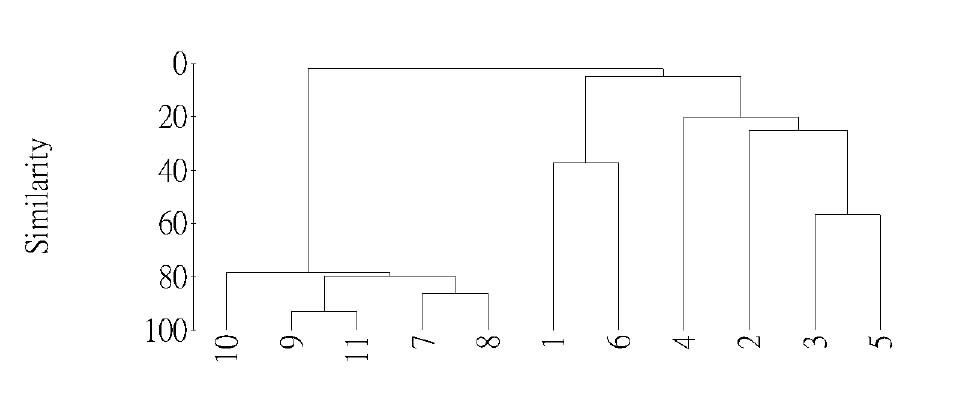
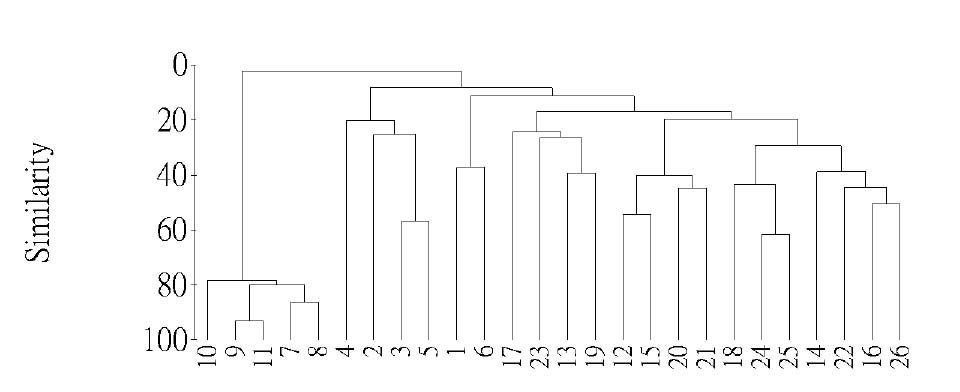
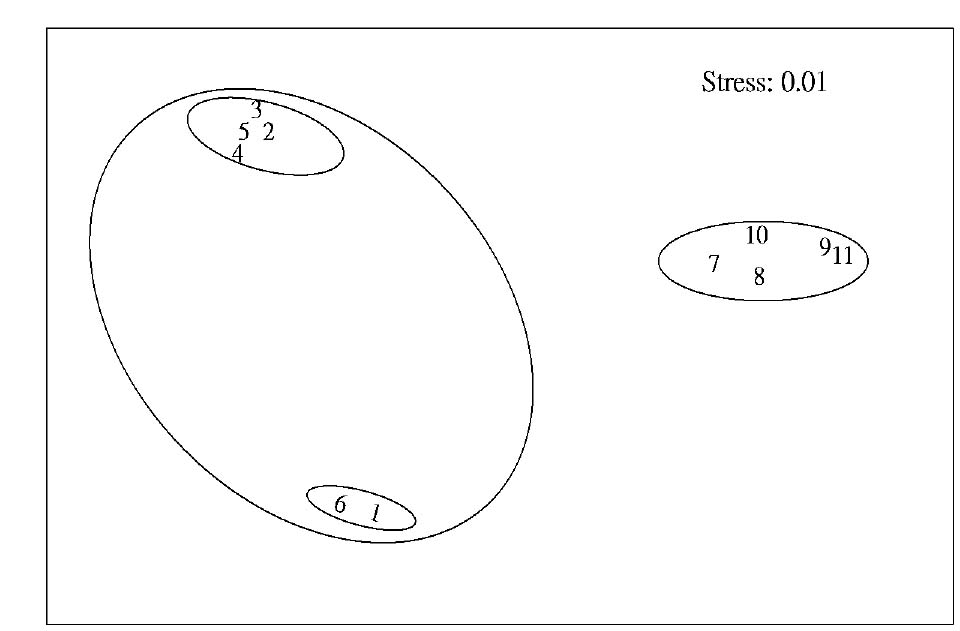
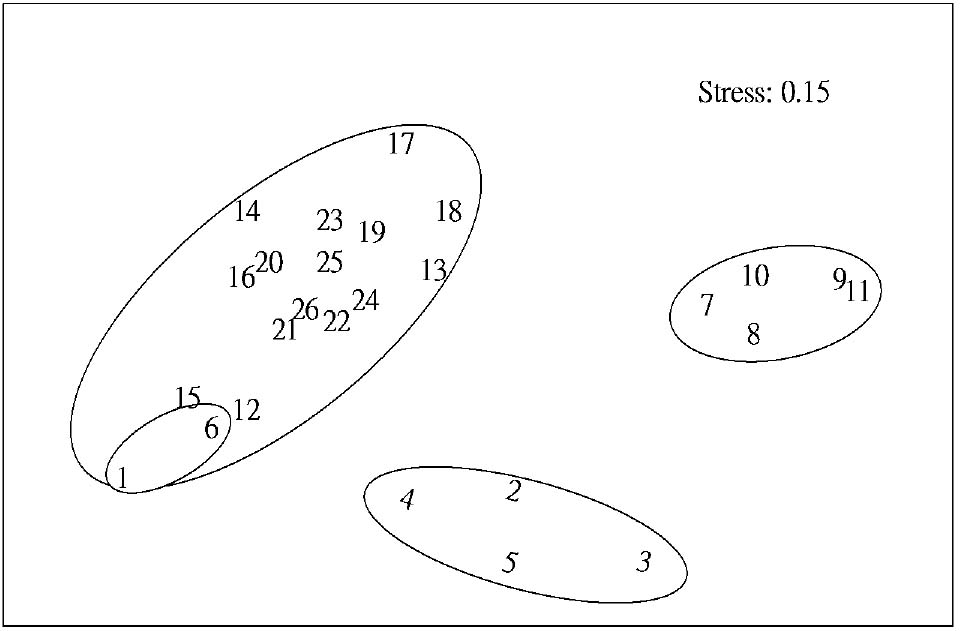
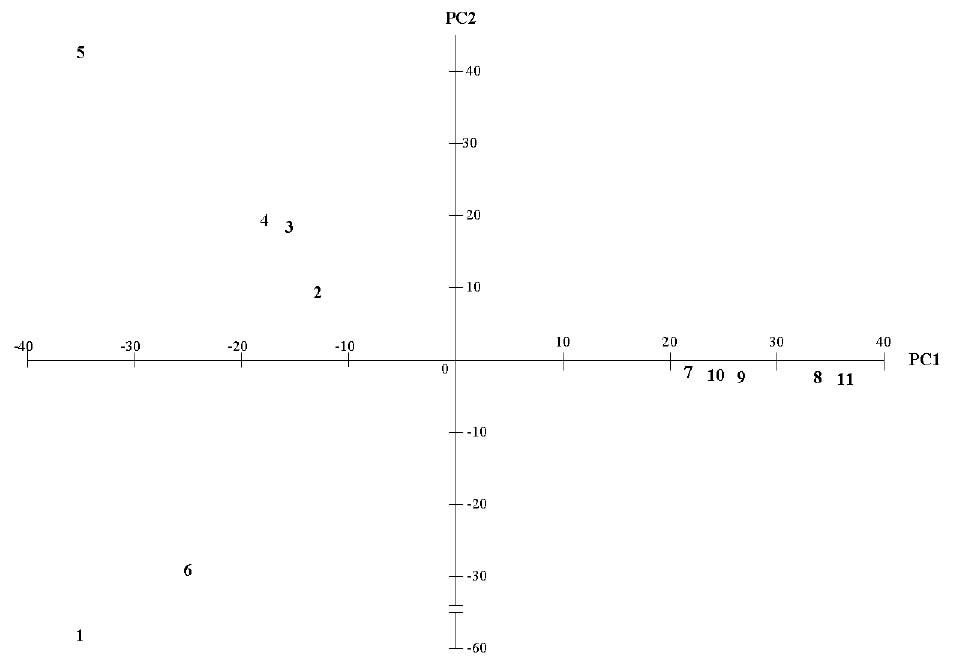
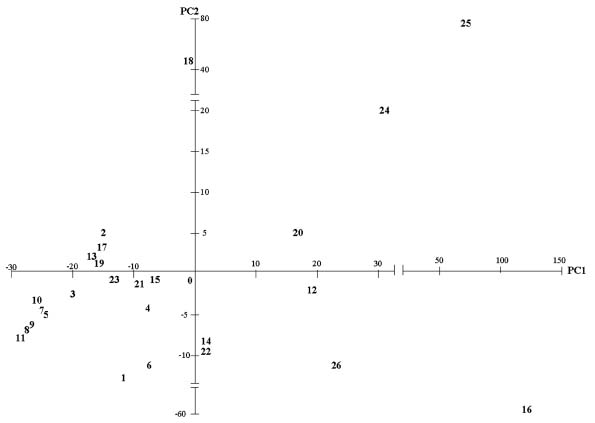
Abstract. This study applied statistical approaches to the discrimination of spatial variations between sites and between forest types in the upper area of the Liukuei Experimental Forest of Taiwan Forestry Research Institute, Taiwan. The main purpose was to compare the effectiveness of various statistical approaches and then present the best strategy for discriminating the spatial variations of species diversity. The two methods used were (1) univariate methods by diversity measures, Shannon t-test, and (2) multivariate methods by cluster analysis, ordination by non-metric multi-dimensional scaling, and principal component analysis. The results by univariate methods indicate that diversity differences exist between sites and between forest types. Meanwhile, the natural forest has more diversity than the plantation, and the hardwood plantation has more diversity than the conifer plantation. The differences between forest types are very significant at the 1% significance level according to the Shannon t-test. The results indicate that univariate methods by diversity measures are a flexible way to reduce the complexity of "species by sites" matrices into a single coefficient. The results of using multivariate methods indicate that cluster analysis and ordination by non-metric multi-dimensional scaling and principal component analysis are useful techniques for discriminating spatial variations. However, ordination by non-metric multi-dimensional scaling discriminates better than principal component analysis. In addition, ordination by non-metric multi-dimensional scaling is a more informative summary than cluster analysis, and the combination of both the analyses is more effective than either alone for the mutual consistency of representations. It is concluded that the most powerful tools for discriminating the spatial variations of species diversity are in the multivariate category. Among multivariate methods, ordination by non-metric multi-dimensional scaling is preferable, and its superimposition with cluster analysis is recommended in order to obtain more information regarding the relationship between sites and between forest types.

Keywords: Spatial variation; Species diversity; Statistical approach.

Introduction

Ecological research on the relationship between biodiversity and forest management practices has been increasingly emphasized (Burton et al., 1992; Halpern and Spies, 1995; Roberts and Gilliam, 1995). As for biodiversity, a variety of different indices (e.g., total number of individual, total number of species) can be used as measures of some attribute of community structure because they are often seen as ecological indicators (Magurran, 1988). However, these indices tend to be less informative and less amenable to simple statistical analysis than species diversity (Clarke and Warwick, 1994). Two different aspects of community structure contribute to species diversity, i.e., species richness and species evenness. Different species diversity indices emphasize species richness or evenness to varying degrees. Hill (1973) pointed out that several of these indices are used as special cases, and a good account of their relative merits and disadvantages

can be found in Magurran (1988). Among the species diversity indices, the Shannon-Wiener diversity index is the most commonly used because it incorporates both species richness and evenness components and can provide heterogeneity information for vegetation and wildlife studies (Rosenstock, 1998; Blair, 1999; Cheng, 1999). Also, it is possible to test the differences between two communities using a Shannon t-test (Hustcheson, 1970; Magurran, 1988; Cheng, 1999).

In most community structure studies, the "species-by-samples" matrices are typically large because an abundance of readings for a set of species is usually taken at a number of sites at one time (spatial analysis) and at the same site at a number of times (temporal analysis). For the data interpretation on community structure, several sophisticated statistical techniques for handling, interpreting, and analyzing "species-by-samples" matrices are used, ranging from the reduction of multi-dimensional data to simple diversity indices through distributional representations of richness, dominance, evenness, to multivariate approaches involving cluster analysis or ordination methods by multi-dimensional scaling (MDS) or principal component analysis (PCA).

*Corresponding author. Tel: 886-2-23039978 ext. 1318; Fax: 886-2-23754216; E-mail: cccheng@serv.tfri.gov.tw


Botanical Bulletin of Academia Sinica, Vol. 45, 2004

richness on sample (Magurran, 1988). For detailed information please refer to Cheng and Lai (2002). Within the entire study area, 26 different sites including 15 natural forests and 11 plantation forests were selected. Among the 11 plantation forests, five were man-made conifer plantations (Taiwania cryptomerioides), and six were man-made deciduous hardwood plantations (Machilus kusanoi). According to the site history, various degrees of thinning have been performed in man-made conifer plantations in order to increase productivity while no thinning was performed in deciduous hardwood plantations. Also, attempts to seed and plant a few of the deciduous hardwood plantations were unsuccessful because of poor germination and/or survival of deciduous hardwood tree species. Therefore, these resulting stands contain components of natural regeneration, and some variations are inevitable.

The site numbers for the hardwood plantation were from 1 to 6, and those for the conifer plantation were from 7 to 11. The natural forest was from 12 to 26. At each site, 10 sample plots were designed systematically along transects, and each sample plot covered 5 m × 5 m. Therefore, the sample plots for natural forests, man-made hardwood plantations, and man-made conifer plantations are 150, 60, and 50, respectively. According to Cheng and Lai (2002), 50 sample plots were regarded as a valid sample size in this study area. Within each sample plot, woody vegetation taller than 1 m, species name, height, dbh, and canopy coverage were recorded. All above surveyed data were finally established in a geographic information system, including spatial and non-spatial data. In addition, the PRIME (version 5) computer package (Clarke and Gorley, 2001) was used for the following statistical processes.

The motivation of this study is to apply univariate and multivariate methods for discriminating the spatial variations of species diversity in the Liukuei Experimental Forest of Taiwan Forestry Research Institute, where several studies related to ecosystem management are currently being undertaken. The purpose is to compare the effectiveness of various statistical approaches and then present the best strategy for discriminating the spatial variations of species diversity.

Materials and Methods

Study Area and Material

The study area is located in the upper portion (called Shanpin) of Liukuei, one of the six experimental forests of the Taiwan Forestry Research Institute, Taiwan (Figure 1). The area covers about 2400 ha. Most of the areas are covered by natural hardwood forest. The conifer plantations form a continuous patch of 500 ha, about 20% of the area. The hardwood plantations are more scattered and form less continuous patches with total areas of 90 ha, about 4% of the area. The conifer plantations in the upper Liukuei mainly belong to Taiwania (Taiwania cryptomerioides) species. On the other hand, the primary planting tree species in deciduous hardwood plantations in the upper Liukuei are Aelkova (Aelkova serrata) and large-leaved Nanmu (Machilus kusanoi).

This study employed the pooled quadrat sampling method, which has proven effective at determining valid sample size (Peilou, 1975), to set the sample plots from May to September in 2000. Meanwhile, the same sample size was used at all sites to encounter the dependence of species

Figure 1. Spatial location of twenty-six sites within the study area. (See Table 1)


Cheng — Statistical approaches on discriminating spatial variation of species diversity

though there are many classes of clustering methods (Johnson and Wichern, 1992; Clarke and Warwick, 1994), this study applies hierarchical clustering with group-average linking to achieve its purpose because the technique has proven useful in a number of ecological studies conducted during the last two decades (Clarke and Warwick, 1994).

2. Ordination by MDS and PCA. This study applied two kinds of ordinations, i.e., non-metric MDS and PCA, to construct a low-dimensional plot and make a comparison for discriminating spatial variations between sites and between forest types.

(1) Ordination by MDS. As with the clustering analysis, two kinds of sampling sites were used for ordination by MDS. The hope was to make a comparison and find out what difference using different sites of various forest types made. For a detailed ordination by MDS, one can refer to Clarke and Warwick (1994). In addition, the above clustering results were also combined with ordination in order to further investigate whether the combination was an effective way of checking the adequacy and mutual consistency of both representations.

(2) Ordination by PCA. As with the ordination by MDS, ordination by PCA was applied to reduce the complexity of multivariate information in the "species by sites" matrices to obtain a low-dimensional picture of how various sites interrelate. For a detailed ordination by PCA, one can refer to Clarke and Warwick (1994) and Johnson and Wichern (1992).

Results

Species Indices Measured by Univariate Methods

Table 1 shows the species indices measured by univariate methods. The result shows that the 26 sites have different species richness, evenness, or Shannon-Wiener index values, and it seems that they can be separated into three groups according to species indices. The data in Table 2 confirm this impression. If we take the Shannon-Wiener index (SW) as an example, the value for natural forest is 3.66 and plantation forest is 3.11. As for plantation forest, hardwood is 3.27 and conifer is 0.85. Obviously, diversity differences exist between different forest types. The natural forest has more diversity than the plantation, and the hardwood plantation has more diversity than the conifer plantation. The differences are significant at the 1% significance level according to the Shannon t-test. This result shows that spatial variations of species diversity measured by univariate methods exist between sites and between forest types in the Liukuei Experimental Forest.

Spatial Discrimination by Multivariate Methods

1. Hierarchical clustering. Figure 2 shows a dendrogram for the abundance similarity matrix of 11 sites, including five conifer sites and six hardwood sites. Five conifer

Univariate Methods

Reducing the complexity of "species by sites" matrices into a single coefficient, species diversity measures, to which species richness and evenness both contribute to a varying degree, seems a flexible way. In this study, the Shannon-Wiener diversity index (SW) was applied because it incorporated the species richness and evenness and adapted to a simple statistical analysis. In addition, Margalef's richness index (M), Pielou's evenness index (P), and Simpson's index (SP) were also applied for a comparison. All the above indices were used to visually discriminate the spatial variations, and the Shannon t-test which Hutcheson (1970) proposed was used to compare the differences of Shannon diversities between forest types. For the equations of the above indices and the Shannon t-test, one can refer to Clarke and Warwick (1994) and Magurran (1988).

Multivariate Methods

This step applied multivariate techniques, e.g., hierarchical clustering (CLUSTER), non-metric MDS, and PCA to discriminate spatial variations between sites and between forest types. The first two methods start from a triangular matrix of similarity coefficients computed between every pair of sites. To measure the similarity coefficients between various sites, a data matrix with p rows (species) and n columns (sites), filled with entries of abundance counts of each species for each site was first constructed. The similarity based on the Bray-Curtis coefficient (equation 1) was calculated between every pair of sites, and an abundance similarity matrix was then constructed. The Bray-Curtis similarity coefficient was used because it is often a satisfactory coefficient for biological data on community structure (Clarke and Warwick, 1994). However, unlike cluster analysis and ordination by MDS, ordination by PCA uses the original abundance matrix to define dissimilarity between samples as their Euclidean distance from each other in the full p-dimensional species space. Furthermore, to reduce the large disparities in counts between species and to validate statistical assumptions for parametric techniques, standardization and transformation were applied to the original species abundance counts before computing the Bray-Curtis coefficient.

The Bray-Curtis coefficient (BC) is given by

.....................(1)

where BCjk is the similarity between the jth and kth sites, and yij represents the abundance for the ith species in the jth site.

1. Hierarchical clustering. Cluster analysis was implemented to spatial grouping based on the abundance similarity matrix. In this study, two kinds of sampling sites (i.e., 26 sites and 11 sites) were used to analyze and compare the differences between different forest types when partitioning the sampling sites into different clusters. Al


Botanical Bulletin of Academia Sinica, Vol. 45, 2004

sites clearly have quite high levels of between-site similarities (e.g., similarity=78%). On the other hand, six hardwood sites can firstly form two distinct groups (one group including sites 2, 3, 4, and 5 and the other sites 1 and 6) as the similarity is about 20%, and finally form a group with quite low levels of between-group similarities (e.g., similarity=5%). Therefore, according to the species similarity matrix, the formation of two distinct groups (hardwood and conifer) by hierarchical clustering seems reasonable and satisfactory.

Figure 3 shows a dendrogram for the abundance similarity matrix of 26 sites. It can be seen that 15 sites of natural forests form a group with a low level of between-site similarities (e.g., similarity=20%). As for the eleven man-made plantation sites, the result is similar to that of Figure 2, except that sites 1 and 6 belonging to the hardwood plantations are grouped with natural forests when the similarity equals 10%. If we check the sampling location in Figure 1, both sites are obviously very close to natural forests. As mentioned previously, these deciduous hardwood plan


Cheng — Statistical approaches on discriminating spatial variation of species diversity

Figure 2. Cluster analysis of the 11 sites based on the abundance similarity matrix.

Figure 3. Cluster analysis of the 26 sites based on the abundance similarity matrix.

tations may contain components of natural regeneration and will cause some variations. Therefore, the result seems reasonable.

From the discrimination of spatial variations by hierarchical clustering, it can be inferred that hierarchical clustering is a useful technique for spatial grouping.

2. Ordination by MDS. Figure 4 displays the results of ordination by MDS based on the abundance similarity matrix of 11 sites. The generated stress value is 0.01. According to a rough rule of thumb for two-dimensional ordinations, stress<0.05 gives an excellent representation with no prospect of misinterpretation (Clarke and Warwick 1994). From Figure 4, it can be seen that sites 7, 8, 9, 10, and 11 are similar and form one group, site 1 and site 6 are the next closest and form another group, and sites 2, 3, 4, 5 form the third group. Obviously, the eleven sites can be divided into three groups in the two-dimensional plot, and the result shows that the same species group together. If we compare this result with hierarchical clustering, both results are reasonably consistent. However, from the resulting figure, spatial discrimination by ordination of MDS is clearly a more informative summary than the corresponding cluster analysis. Furthermore, if we superimpose groups from the cluster analysis on the ordination plot, the output (Figure 4 with solid line) shows that the combination of these two analyses is an effective way to check the mutual consistency of both representations.

Figure 5 is the result of ordination by MDS based on the abundance similarity matrix of 26 sites. The generated stress value (=0.15) still gives a potentially useful two-dimensional representation according to a rough rule of thumb. From Figure 5, it is clear that the 26 sites can form three distinct groups in the two-dimensional plot. Within the biggest group, sites 1 and site 6 belonging to the hardwood plantation can obviously be grouped with natural forests, and this is similar to the result of hierarchical clustering in Figure 3.

From the discrimination of spatial variations by ordination of MDS, it can be inferred that although ordination by MDS is more informative than cluster analysis, the combination of both analyses is more effective for the mutual consistency of representations.

3. Ordination by PCA. Figure 6 is a two-dimensional PCA ordination using the original abundance matrix of eleven sites. The cumulative variation of PC1 and PC2 accounts for 81% of the total variation. It is almost an accepted two-dimensional summary of the n-dimensional data. From Figure 6, it is clear that all hardwood plantation sites are located on the left hand of PC1 while conifer plantation sites are located on the right hand. Looking at the PC2 axis, we see that all conifer plantation sites lie nearly on a line and that hardwood plantation sites are separated into two groups. One includes sites 2, 3, 4, 5, and the other includes sites 1, 6. In fact, this result is simi

Figure 4. MDS ordination of the 11 sites based on the abundance similarity matrix.

Figure 5. MDS ordination of the 26 sites based on the abundance similarity matrix.


Botanical Bulletin of Academia Sinica, Vol. 45, 2004

Figure 6. PCA ordination of the 11 sites based on the original abundance matrix.

of "species by sites" matrices into a single coefficient and to present significant interpretations of spatial data between sites or forest types.

As for the multivariate methods, cluster analysis, ordination by MDS, and PCA are obviously the most powerful tools for discriminating spatial variations of species diversity between sites and forest types. Cluster analysis is a useful technique for spatial grouping. It is appropriate for delineating groups of sites with distinct species diversity. Ordination by PCA is also a good technique for spatial discrimination. However, it is inferior to cluster analysis and the ordination of MDS because it lacks flexibility in defining dissimilarity and has poor distance-preserving properties. Ordination by MDS discriminates sites and forest types better because it has a number of practical advantages stemming from its flexibility and few (lack of) assumptions. Therefore, the spatial discrimination by ordination of MDS is more informative than the cluster analysis or PCA. Furthermore, a combination of MDS and cluster analysis results in a mutual consistency of representations. Therefore, ordination by MDS is preferable, and its superimposition with cluster analysis is recommended in order to display and interpret the spatial relationship between the groups of various sites and forest types more effectively.

This study compares the effectiveness of various statistical approaches based on the spatial variations of spe

lar to that of ordination by MDS. Figure 7 displays the results obtained from 26 sites. The cumulative variation of PC1 and PC2 accounts for only 53% of the total variation. The output seems different and much more complex than Figure 6 or Figure 5, and it is difficult to discriminate the spatial variation between forest types despite the PC1 or PC2 axis.

From the discrimination of spatial variations by ordination of PCA, it can be inferred that ordination of PCA is also a useful technique for spatial discrimination,though it is still inferior to ordination by MDS.

Discussion

Species diversity, to which species richness and evenness contribute to a varying degree, is the subject matter of biodiversity and conservation biology because it acts as an indicator in ecological studies. There are many measures of species diversity, but only six (i.e., the total number of species, the total number of individuals, the Shannon-Wiener diversity index, the Margalef's richness index, the Pielou's evenness index, and the Simpson's index) were used in this study. From the results that spatial variations of species diversity exist between forest types and have a significant difference at the 1% significance level, it is clear that univariate methods by diversity measures are a flexible way to reduce the complexity


Cheng — Statistical approaches on discriminating spatial variation of species diversity

Figure 7. PCA ordination of the 26 sites based on the original abundance matrix.

(Shanping) Area. Taiwan J. For. Sci. 17: 155-170.

Clarke, K.R. and R.M. Warwick. 1994. Change in Marine Communities. Plymouth Marine Laboratory, 144 pp.

Clarke, K.R. and R.N. Gorley. 2001. PRIME v5: User Manual/Tutorial. Plymouth Marine Laboratory, 91 pp.

Halpern, C.B. and T.A. Spies. 1995. Plant species diversity in natural and managed forests of the Pacific northwest. Ecol. Appl. 5: 913-934.

Hill, M.O. 1973. Diversity and evenness: a unifying notation and its consequences. Ecology 54: 427-432.

Hutcheson, K. 1970. A test for comparing diversities based on the Shannon formula. J. Theor. Biol. 29: 151-154.

Johnson, R.A. and D.W. Wichern. 1992. Applied Multivariate Statistical Analysis. Prentice-Hall International, Inc., pp. 573-602.

Magurran, A.E. 1988. Ecological Diversity and its Measurement. Princeton University Press, Princeton, New Jersey, 179 pp.

Pielou, E.C. 1975. Ecologcial diversity, Wiley, New York. 165 pp.

Roberts, M.R. and F.S. Gilliam. 1995. Patterns and mechanisms of plant diversity in forested ecosystems: implications for forest management. Ecol. Appl. 5: 969-977.

Rosenstock, S.S. 1998. Influence of Gambel oak on breeding birds in ponderosa pine forests of Northern Arizona. Condor 100: 485-492.

cies diversity, and then recommends the best strategy as one that combines MDS and cluster analysis for the spatial discrimination of species diversity. In addition, this result may extend to further studies, for example, the determination of stress levels on impact studies and the linkage of data in environmental studies.

Acknowledgements. This study was financially supported by the National Science Council, Taiwan, Republic of China. I would like to express my gratitude to the Division of Forest Management, Taiwan Forestry Research Institute for its help in many aspects.

Literature Cited

Blair, R.B. 1999. Birds and butterflies along an urban gradient: Surrogate taxa for assessing biodiversity? Ecol. Appl. 9: 164-170.

Burton, P.J., A.C. Balisky, L.P. Coward, S.G. Cumming, and D.D. Kneeshaw. 1992. The value of managing for biodiversity. For. Chron. 68: 225-237.

Cheng, C.C. 1999. Monitoring of forest landscape change. Taiwan J. For. Sci. 14: 493-507.

Cheng, C.C. and Y.C. Lai. 2002. Biodiversity in deciduous hardwood and conifer plantations of the upper Liukuei


Botanical Bulletin of Academia Sinica, Vol. 45, 2004