Bot. Bull. Acad. Sin. (2005) 46: 155-162

LI and XIA — Genetic variation of Glyptostrobus pensilis

Population structure and genetic diversity of an endangered species, Glyptostrobus pensilis (Cupressaceae)

Fagen LI and Nianhe XIA*

South China Botanical Garden, The Chinese Academy of Sciences, Guangzhou 510650, P.R. China

(Received January 2, 2004; Accepted December 14, 2004)

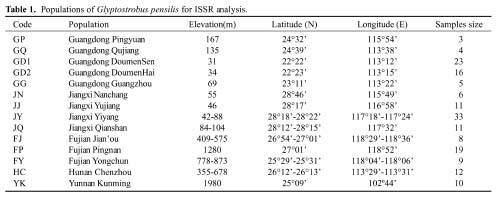
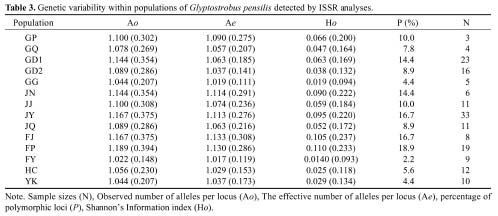
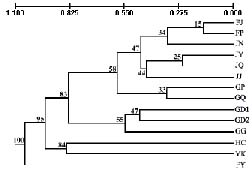
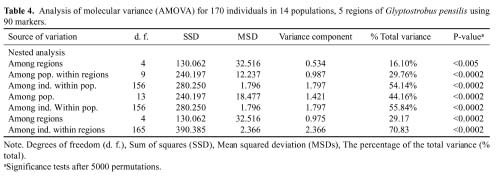
Abstract. Glyptostrobus pensilis (Staunton ex D. Don) K. Koch is a critically endangered species, only distributed in South China and Vietnam. Genetic variation within and between populations was investigated using inter-simple sequence repeat (ISSR). One hundred and seventy individuals from fourteen populations representing five regions in southern and southeastern China were sampled. The results show that genetic diversity of G. pensilis is rather low: P = 10.2%, Ae = 1.070 and Hpop = 0.058 at population level; P = 24.7%, Ae = 1.140 and Hsp = 0.122 at species level. The results further indicate significant genetic differentiation between regions (16.10%, analysis of molecular variance [AMOVA], p<0.005), between populations within particular regions (29.76%, P<0.0002), and between individuals within populations (54.14%, P<0.0002). High levels of genetic differentiation between populations were also detected based on Nei's genetic diversity analysis (51.36%), and Shannon's diversity index (52.54%). Possible reasons for the high genetic differentiation and its low level of diversity within populations are discussed. Possible in situ and ex situ conservation strategies for G. pensilis are suggested.

Keywords: Conservation strategies; Endangered species; Genetic diversity; Glyptostrobus pensilis; ISSR (inter-simple sequence repeat).

Introduction

Glyptostrobus pensilis (Staunton ex D. Don) K. Koch has been recognized as a unique monotypic genus in the family Cupressaceae on the basis of its distinct morphology (Zheng and Fu, 1978; Farjon and Page, 1999). Fossil evidence indicates that G. pensilis was widely distributed in the Far East, Siberia, Canada, and the United States in the Late Cretaceous, and in Siberia and Thailand in the Pliocene (Florin, 1963; Yu, 1995). Due to the early Pleistocene glaciations and subsequent desertification during the Quaternary, this species occurs now only in South China and Vietnam (Farjon and Page, 1999; Li and Xia, 2004). Glyptostrobus pensilis is a monoecious, wind-pollinated, heliophilous and sub-evergreen tree, which is tolerant of waterlogging and can grow in most soils that are not saline or alkaline. The species is adapted to warm and humid habitats. Seedlings or saplings demand sufficient sunlight in addition to fertile and moist soil (Fu and Jin, 1992; Yu, 1995). Glyptostrobus pensilis has been classified as endangered by the IUCN categories and listed in the China Plant Red Data Book: Rare and Endangered Plants (Fu and Jin, 1992; Farjon and Page, 1999). Previous studies of G. pensilis focused mostly on chemical composition (Lan et al., 1992), cytology (Xiao and Dong, 1983; Li, 1987), pollen morphology (Xi, 1986), ecology (Yu, 1995),

and geography (Xu and Li, 1959). Research on the genetic variation within and among populations of G. pensilis has not been reported to date. Genetic variation within and among populations of rare and endangered species plays a significant role in the formulation of appropriate management strategies directed towards their conservation (Milligan et al., 1994).

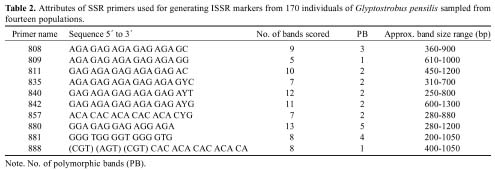
In recent years, a relatively novel molecular technique that permits the detection of polymorphisms in micro-satellite and inter-micro-satellite loci without previous knowledge of the DNA sequences has been described: "inter-simple sequence repeat PCR" (ISSR-PCR) (Zietkiewicz et al., 1994). This technique has been widely used to investigate genetic diversity and population genetic structure because it overcomes some limitations of allozymes and requires a small amount of DNA (Wolfe et al., 1998; Ratnaparkhe et al., 1998; Esselman et al., 1999). Each primer is composed of di- or trinucleotide repeats with or without one to three additional nucleotides at the 5´- or 3´- end to serve as anchors against reverting strand slippage during amplification (Gupta et al., 1994). The sequences of repeats and anchor nucleotides are arbitrarily selected, and identical repeat sequences with different anchoring sequences can yield different banding patterns (Wolfe et al., 1998). In contrast with other molecular techniques, the sequences that ISSR target are abundant throughout the eukaryotic genome and evolve rapidly. Consequently ISSR may reveal a much higher number of polymorphic fragments per primer than random amplified

*Corresponding author. Tel: + 86-20-37252565; Fax: + 86-20-37252565; E-mail: nhxia@scbg.ac.cn


Botanical Bulletin of Academia Sinica, Vol. 46, 2005

polymorphic DNA (RAPD), and ISSR reaction is more specific than RAPD analysis (Williams et al., 1990; Fang and Roose, 1997; Wolfe et al., 1998; Esselman et al., 1999). However, ISSR loci are dominant markers with the assumption of only two alleles per locus, which may bias some population genetic parameters if selection is occurring or if the population is not randomly mating.

In this investigation, ISSR analysis was used to detect the genetic diversity within and among populations of G. pensilis in order to provide information for conservation strategies for this species.

Materials and Methods

Population Sampling

Sampling included materials from five regions (Province of Guangdong, Jiangxi, Hunan, Fujian, and Yunnan) of G. pensilis. Fourteen populations of G. pensilis were collected in spring, 2002. The locations of these populations are given in Table 1. Trees for sampling were selected randomly within each population. For some populations, only three or four individuals were obtained, owing to the low number of trees and very low accessibility. For other populations, about twenty individuals were sampled. Leaf samples were obtained from a total of 170 individuals from 14 populations (Table 1). Samples consisted of a single twig and a few leaves taken from a tree in the field.

Genomic DNA Extraction

Total DNA of the leaves was extracted from leaf tissue using a modified CTAB extraction (Doyle and Doyle, 1990; Doyle, 1991). 0.5 g of dried leaves was ground to fine powder in liquid nitrogen. Extraction was conducted in 1.5 mL plastic microcentrifuge tubes followed by two chloroform-isoamyl alcohol (24:1) purifications. The resulting DNA pellet was washed with 70% ethanol before the final suspension step. DNA concentrations were determined with uncut lambda DNA of a different known concentration as a size marker, on 1% agarose gels.

ISSR PCR Amplification

PCR amplification was carried out in a volume of 20 mL. The reaction mixture consisted of 20 ng of template DNA, 10 mmol/L Tris-HCl (pH 9.0) reaction buffer, 50 mmol/L KCl, 0.1% Triton X-100, 2.7 mmol/L MgCl2, 0.1 mmol/L dNTPs, 2% formamide, 200 nmol/L primer, and 1.5 units of Taq polymerase. A negative control reaction, in which DNA was omitted, was included with every PCR run in order to test that no self-amplification or DNA contamination occurred. PCR reactions were performed in a PTC-100 thermocycler (MJR Research, Inc., USA) using an initial 5 min denaturation at 94°C followed by 35 cycles of 30 s denaturation at 94°C, 45 s of annealing temperature (48°C-53°C) and 1.5 min extension at 72°C, with a final 10 min extension at 72°C. One hundred ISSR primers of 15-23 nucleotides in length from the Biotechnology Laboratory, University of British Columbia (UBC primer set # 9) were initially screened, and 10 primers (Table 2) that gave distinct, repeatable fragment patterns were finally chosen for amplification. In order to avoid biasing estimates, the selection of primers for full analysis was dependent only on the clearness and reproducibility of ISSR fragments and not on the level of polymorphism. A DNA Ladder (New England Biolabs, cut with EcoRI/HindIII) was used as a size marker (100-1500 bp). Amplification products were resolved electrophoretically on 1.5% agarose gels run at 180 V in TBE and visualized by staining with ethidium bromide. The gel images were identified by image analysis software (LabWorks Software, Version 3.0; UVP, Upland, CA, USA). Only bands showing consistent amplification were considered for this study. All smeared and weak bands were excluded.

Data Analysis

Polymorphic ISSR bands were scored as present (1) or absent (0). POPGENE, v. 1.31 (Yeh et al., 1999) was used to calculate genetic diversity for each population, including the mean number of alleles per locus (A) and the percentage of polymorphic loci (P). The level of gene flow


LI and XIA — Genetic variation of Glyptostrobus pensilis

(Nm) was measured using Nei's (1973) gene diversity statistics. The Shannon information measure (Ho) was calculated at two levels: the average diversity within populations (Hpop), and the total diversity within species (Hsp). The proportion of diversity between populations D = (Hsp-Hpop)/Hsp was estimated. The binomial matrix was used to calculate the level of polymorphism for each population. This matrix was used to construct a dendrogram using the unweighted pair group method (UPGMA) (Sneath and Sokal, 1973) and the SHAN (sequential, hierarchical, agglomerative and nested clustering) routine in NTSYS software (Rohlf, 1994), and the generation of the bootstrapped dendrograms was done with the program TFPGA 1.3 (Miller, 1997). The distance matrix was generated with the AMOVA-PREP version 1.01 (Miller, 1998). The resulting distance matrix was subjected to an analysis of molecular variance using WINAMOVA version 1.55 (Excoffier et al., 1992; Excoffier, 1993; Stewart and Excoffier, 1996). A Mantel test was used to determine whether the matrix of mean genetic distances between the locations was correlated with the matrix of geographic distances between the locations or not (Mantel, 1967). The Mantel test was conducted with the program TFPGA 1.3.

Results

The ISSR Bands

ISSR analysis using 10 primers generated a total of 90 different ISSR bands, with primer 880 yielding the highest number of products (13 amplicons) and primer 809 the least (5 amplicons), corresponding to an average of 9 bands per primer. The number of polymorphic bands also varied between primers, with primers 880 generating five polymorphisms, 809 and 888 yielding one polymorphism. The size of the amplified fragments ranged from 200 to 1200 base pairs (bp). Among the 90 loci, 24 (24.7%) were polymorphic at the species level. The polymorphic loci for each population are given in Table 2.

Genetic Diversity

The genetic data for each of fourteen populations of G. pensilis using ISSR are summarized in Table 3. The percentage of polymorphic loci (P) varied greatly between the five regions and between the fourteen populations. For a single population it ranged from 2.2% to 18.9%, with an average of 10.2%. The average effective number of alleles


Botanical Bulletin of Academia Sinica, Vol. 46, 2005

(Ae) per locus is 1.070. Very low levels of genetic diversity within populations were observed, and these standard measures of genetic diversity varied in all populations. Among the fourteen populations, population FP, FJ and JY exhibited the greatest level of variability (P: 18.9%, Ae: 1.130, Ho: 0.110; P: 16.7%, Ae: 1.133, Ho: 0.105; and P: 16.7 %, Ae: 1.113, Ho: 0.095, respectively) while the population FY exhibited the lowest (P: 2.2%, Ae: 1.017, Ho: 0.014). At the population level, the average values of Ae, Ho and P for all the populations were 1.070, 0.058 and 10.2%. At the species level Ae, Ho and P were 1.140, 0.122, and 24.7%, respectively. The Shannon indices (Ho) ranged from 0.014 to 0.110, with an average of 0.058 at the population level (Hpop) and 0.122 at the species level (Hsp).

Genetic Variation between Populations and Regions

The AMOVA analysis provided corroborating evidence for the genetic structure obtained from Nei's genetic diversity statistics and Shannon's diversity estimation. The total variance analyzed without considering the regional distribution of the populations was 44.16% between populations. Highly significant genetic differences were detected between regions (P<0.005), between the fourteen populations of G. pensilis, within populations (P<0.0002), and 55.84% between individuals (P<0.0002). Of the total genetic diversity, 16.10% was attributed to differences between regions, 29.76% to differences between populations within regions, and 54.14% to differences between individuals within populations. Furthermore, the total variance analyzed without considering the populations—29.17% for the regions and 70.83% between individuals within regions—suggested that most variation was within populations (Table 4).

A UPGMA dendrogram produced using the Jaccard coefficient between populations is shown in Figure 1. The bootstrap values of the groups ranged from 84% (HC and YK) and 47% (GD1 and GD2) to 33% (GP and GQ) and 15% (FJ and FP), and some of them were not very high. The coefficient of genetic differentiation between populations was 0.5136 as estimated by partitioning of the total gene

diversity (Gst). The matrix of the genetic distances did not correlate significantly with the corresponding matrix of geographical distances (Mantel test, correlation coefficient of r=0.53 and a significance of p<0.002). The UPGMA cluster analysis based on the genetic distances showed three clusters of populations were relevant to geographical position: populations FJ, FP, populations GD1, GD2, GG, and populations JY, JQ, JJ (Figure 1). Bootstrap values for these groups are variable. The level of gene flow (based on Gst) estimated was very low (Nm = 0.24); the Shannon's diversity index (D) was 52.54%, suggesting that rather high genetic differentiation existed between populations.

Discussion

Genetic Diversity

Genetic diversity is essential to the long-term survival of tree species to avoid risk of extinction. The loss of genetic variation is thought to decrease both the short-term

Figure 1. Bootstrapped cluster analysis (UPGMA) dendrogram for fourteen populations of Glyptostroubs pensilis, based on the Jaccard's similarity coefficient matrix. Numbers at the nodes indicate the probability of the branch when the bootstrap analysis was calculated with 1,000 iterations. Population abbreviations follow Table 1.


LI and XIA — Genetic variation of Glyptostrobus pensilis

and the long-term adaptability of populations in variable and changing environments (Hamrick, 1994; Young et al., 1996). Our investigations of the fourteen populations of G. pensilis indicated that this endangered species has a very low level of genetic diversity, particularly at the population level. Genetic diversity averaged 0.058 at the population level (Hpop) and 0.122 at the species level (Hsp). Similar levels and patterns of genetic diversity have been found for Asian Pinus species (Szmidt et al., 1996; Ge et al., 1998). As Table 3 indicates, large populations always have higher diversities. For example, the FP population has 19 individuals with P=18.9%, Ae=1.130, and Ho=0.110, in contrast to the GG population with only five individuals (P=4.4%, Ae=1.019, Ho=0.019), and the samples reflect actual numbers of G. pensilis in the field according to our field investigation. Population genetic theory predicts that small, isolated populations will lose genetic diversity and become increasingly differentiated from other populations (Buza et al., 2000). The clear relationship between population size and genetic diversity suggests that the restriction into small populations following habitat loss has been accompanied by a reduction of diversity within them (Li and Xia, 2004).

Glyptostrobus pensilis is a relict species currently restricted to areas of China and Vietnam that were not affected by Quaternary glaciations (Xu and Li, 1959; Yu, 1995). Its genetic diversity (P=10.2%, Hpop=0.058, Hsp= 0.122 and Gst was 0.514, Shannon's diversity index was 0.525) is structured, probably by geographical conditions, ecological factors, mating system, and influenced by historical events such as glacial periods. Fossils of G. pensilis are known from the Late Cretaceous of the Far East, Siberia, Canada, and United States to the Pliocene of Siberia and Thailand (Florin, 1963; Yu, 1995). Apparently, the geographic range of G. pensilis was largely constrained, and its populations were greatly reduced in size during the cold periods of Quaternary glaciations. In most cases, restriction of populations to small refugia, and reduction in population size at the time of fragmentation owing to climatic changes associated with Pleistocene glacial events, created genetic bottlenecks because the remaining individuals contained only a small sample of the original gene pool (Falk and Holsinger, 1991). Subsequent to this initial loss of variation, remnant populations that remain small and isolated for many generations continue to lose diversity due to random genetic drift. As with populations in rare and endemic species like Lactoris fernandeza (Lactoridaceae), which have 24.5% polymorphic bands (Brauner et al., 1992), the low level of variability (P=24.7%, Hsp=0.122, and Hpop=0.058) is considered to be a consequence of survival in isolated refugia during the Pleistocene.

In recent centuries, the habitats of G. pensilis have been devastated by human activities, and this has led to massive elimination of populations of this species. Changes in land use have caused increased fragmentation of the range of G. pensilis, in addition to isolation of particular small populations (Xu and Li, 1959; Han et al., 1997; Li and Xia, 2004). It has been demonstrated that the major cause

of the historical decline of G. pensilis is the deterioration of the environment and unsuitable conditions for seed germination, such as poor water quality (Xu and Li, 1959). In the face of man-made habitat fragmentation, studying the processes affecting genetic diversity in fragmented habitats has become increasingly important. Low levels of genetic diversity may reduce the potential of species or populations to survive in a changing environment (Ellstand and Elam, 1993). Such processes may have contributed to the lack of genetic diversity observed today, in addition to the historical effects of glaciation and confinement to refugia.

Genetic Structure of Populations

Genetic structure is the nonrandom distribution of alleles or genotypes in space or time. The investigated population of G. pensilis showed 54.14% genetic variation among the individuals within the same population and 44.16% within populations while only 16.10% variance was found among regions. In addition, for G. pensilis, the largest Gst (0.514) observed between populations was rather higher. The results of the analysis, therefore, showed a distinct geographical partitioning of genetic variance, and the estimates of Nm =0.24 revealed a low level of migration between the isolated locations, which resulted in considerable geographical differentiation. Similar results concerning genetic structure of G. pensilis populations were obtained using Shannon's diversity index (D=52.54 %).

Low diversity and high population partitioning in rare plants have previously been attributed to a number of factors, including adaptation of genetic systems in small populations, recent fragmentation of continuous genetic systems (human activity), and limited gene flow due to the combination of wind pollination and high inbreeding rate (Maguire and Sedgley, 1997). Now, G. pensilis is only distributed in southern and southeastern China, and in Vietnam. Like many glacial relicts (Demesure et al., 1996; Tremblay and Schoen, 1999), G. pensilis showed high genetic differentiation. Bauert et al. (1998) observed strong differentiation among rare relict populations of Saxifraga crenua (Saxifragaceae) in the Alps. Cardoso et al. (1998) investigated relict populations of Caesalpinia echinata (Caesalpiniaceae) in Brazil, which had expanded in distribution during the cold periods of the Quaternary and contracted to a few sites with the return of the warmer climate. C. echinata also showed considerable genetic differentiation among the rare and isolated populations. In addition, distances between populations of G. pensilis are large: the mean distance in our sample was 630 km, and the farthest distance between populations was 1662.6 km (between FY and YK). Reflecting these facts, the strong genetic differentiation of G. pensilis clearly can be attributed to its long-term isolation since the end of the last glaciations.

Conservation Consideration

Information about the genetic diversity of threatened species is a prerequisite to designing suitable strategies


Botanical Bulletin of Academia Sinica, Vol. 46, 2005

for genetic conservation and establishing effective and efficient conservation practices (Falk and Holsinger, 1991). Declines in genetic variation in wild populations are of great concern to conservation biologists (Hedrick et al., 1992). The ultimate goal of conservation is to ensure the continuous survival of populations and to maintain their evolutionary potential (Godt and Hamrick, 1995). The determination of genetic structure for G. pensilis, one of the most acutely threatened tree species in China, allows us to undertake an appropriate strategy for its conservation. The high degree of genetic differentiation between populations of G. pensilis indicates that a considerable amount of the overall genetic variation of the species in the study area may be lost if management focuses only on conservation of large populations. For conservation it is necessary to protect the existing populations in situ in order to preserve as much genetic variation as possible, especially for those populations with higher genetic diversity. For example, the FP, FJ and JY populations harbor a significant amount of the genetic diversity, and these should be a priority for conservation action. This is particularly the case for population FP, which showed the highest variability of all populations.

A major goal of conservation is the maintenance of genetic diversity and evolutionary processes in viable populations in order to prevent potential extinction (Falk and Holsinger, 1991). It was demonstrated that the major cause of the decline of G. pensilis was the damage and fragmentation of habitats by human activities and industrial exploitation (Han et al., 1997; Li and Xia, 2004). Habitat destruction, which leads to the elimination of species, should therefore be prevented. Secondly, conservation management of the remaining populations is required. In order to increase genetic variation and accelerate gene flow, ex situ conservation should be provided for as many of the introduced populations as possible in the same place because even a low differentiation can be a starting point for further evolutionary development. In particular, considering the habitats suitable for this species is very important. By this means, the remaining genetic diversity resources of the species can be preserved to the greatest extent. Further studies are underway to directly document the breeding system and pollination of G. pensilis. These data will be integrated into a management plan to meet the goal of preserve design that optimizes conservation of G. pensilis.

Acknowledgements. The authors gratefully acknowledge the anonymous reviewers for their careful work. We thank Deng Yun-Fei for sampling, Sun Ye and Yu Yan for their help with the lab work, and Dr Farjon, Dr. Stapleton and Dr. Wójcicki, Dr. Ge, Dr. Hao, and Dr. Li for their valuable comments on the manuscript. This work was partly supported by the National Nature Science Foundation of China (30070056).

Literature Cited

Bauert, M.R., M. Kälin, M. Baltisberger, and P.J. Edwards. 1998. No genetic variation within isolated relict populations

of Saxifraga cernua in the Alps using RAPD markers. Mol. Ecol. 7: 1519-1527.

Brauner, S., D.J. Crawford, and T.F. Stuessy. 1992. Ribosomal and RAPD variation in the rare plant family Lactoridaceae. Amer. J. Bot. 79: 1436-1439.

Buza, L., A. Young, and P. Thrall. 2000. Genetic erosion, inbreeding and reduced fitness in fragmented populations of the endangered tetraploid pea Swainsona recta. Biol. Conserv. 93: 177-186.

Cardoso, M.A., J. Provan, W. Powell, C.G. Ferreiras, and D.E. de Oliveira. 1998. High genetic differentiation among remnant populations of the endangered Caesalpinia echinata Lam. (Leguminosae-Caesalpinoideae). Mol. Ecol. 7: 601-608.

Demesure, B., B. Comps, and R.J. Petit. 1996. Chloroplast DNA phylogeography of the common beech in Europe. Evolution 50: 2515-2520.

Doyle, J. 1991. DNA protocols for plants—CTAB total DNA isolation. In G.M. Hewitt and A. Johnston (eds.), Molecular Techniques in Taxonomy. Springer, Berlin, pp. 283-293.

Doyle, J.J. and D.J. Doyle. 1990. Isolation of plant DNA from fresh tissue. Focus 12: 13-15.

Ellstrand, N.C. and D.R. Elam. 1993. Population genetic consequences of small population size: implications for plant conservation. Annu. Rev. Ecol. Syst. 24: 217-242.

Esselman, E.J., J.Q. Li, D.J. Crawford, J.L. Windus, and A.D. Wolfe. 1999. Clonal diversity in the rare Calamagrostis porteri spp. Insperata (Poaceae): comparative results for allozymes and random amplified polymorphic DNA (RAPD) and inter-simple sequence repeat (ISSR) markers. Mol. Ecol. 8: 443-451.

Excoffier, L., P.E. Smouse, and J.M. Quattro. 1992. Analysis of molecular variance inferred from metric distances among DNA haplotypes: application to human mitochondria DNA restriction sites. Genetics 131: 479-491.

Excoffier, L. 1993. Analysis of molecular variance (AMOVA) version 1. 55. Genetics and Biometry Laboratory , University of Geneva , Switzerland.

Falk, D.A. and K.E. Holsinger. 1991. Genetics and Conservation of Rare Plants. Oxford University Press, New York.

Fang, D.Q. and M.L. Roose. 1997. Identification of closely related citrus cultivars with inter-simple sequence repeat markers. Theor. Appl. Genet. 95: 408-417.

Farjon, A. and C.N. Page. 1999. Conifers Status survey and conservation action plan. IUCNISSC Conifer Specialist Group. IUCN, Gland, Switzerland and Cambridge, UK.

Florin, R. 1963. The distribution of conifer and taxad genera in time and space. Acta Horti. Bergiani. 20: 121-312.

Fu, L.G. and J.M. Jin. 1992. The Red Book of Chinese Plants—Rare and Endangered Plants. Science Press, Beijing. Volume 1, pp. 148-149.

Ge, S., D.Y. Hong, H.Q. Wang, Z.Y. Liu, and C.M. Zhang. 1998. Population genetic structure and conservation of an endangered conifer, Cathaya argyrophylla (Pinaceae). Int. J. Plant Sci. 159: 351-357.

Godt, M.J.W. and J.L. Hamrick. 1995. Allozyme variation in two Great Smoky Mountain endemics: Cacalia regelia and Glyceria nubigena. J. Hered. 86: 194-198.

Gupta, M., Y.S. Chyi, J.R. Severson, and J.L. Owen. 1994. Amplification of DNA markers from evolutionarily diverse ge


LI and XIA — Genetic variation of Glyptostrobus pensilis

nomes using single primers of simple-sequence repeats. Theor. Appl. Genet. 89: 998-1006.

Hamrick, J.L. 1994. Genetic diversity and conservation in tropical forests. In R.M. Drysdale, S.E.T. John, and A.C. Yapa (eds.), Proceedings of the International Symposium on Genetic Conservation and Production of Tropical Forest Tree Seed. ASEAN-Canada Forest Tree Seed Center Project, Muak-Lek, Saraburi, Thailand, pp. 1-9.

Han, L.J., Y.X. Hu, J.X. Lin, and X.P. Wang. 1997. The biology and conservation of Glyptostrobus pensilis (A review). Subtrop Plant Res. Commun. 26: 43-47.

Hedrick, R.P., T.S. McDowell, J.M. Groff, S. Yun, and W.H. Wingfield. 1992. Isolation and some properties of an Iridovirus-like agent from white sturgeon Acipenser transmontanus. Dis. Aquat. Org. 12: 75-81.

Lan, L., Z.W. Ma, G.F. He, Z.L. Xu, and J.G. Pan. 1992. Essential oil components from leaves of Glyptostrobus pensilis. Bot. Res. 6: 235-239.

Li, F.G. and N.H. Xia. 2004. The geographical distribution and cause of threat to Glyptostrobus pensilis (Taxodiaceae). J. Trop. Subtropical Bot. 12: 13-20.

Li, L.C. 1987. Cytological study on Glyptostrobus pensilis Koch (Taxodiaceae). Guihaia 7: 101-106.

Maguire, T.L. and M. Sedgley. 1997. Genetic diversity in Banksia and Dryandra (Proteaceae) with emphasis on Banksia cuneata, a rare and endangered species. Heredity 79: 394-401.

Mantel, N. 1967. The detection of disease clustering and a generalized regression approach. Cancer Res. 27: 209-220.

Miller, M.P. 1997. Tools for Population Genetic Analyses (TFPGA) 1.3: A Windows program for the analysis of allozyme and molecular population genetic data. Computer Software Distributed by Author.

Miller, M.P. 1998. AMOVA-PREP 1.01: A program for the preparation of AMOVA input files from dominant-markers raw data. Computer Software Distributed by Author.

Milligan, B.G., J. Leebens-Mack, and A.E. Strand. 1994. Conservation genetics: beyond the maintenance of marker diversity. Molecular Ecol. 3: 423-435.

Nei, M. 1973. Analysis of Gene Diversity in Subdivided Populations. Proc. Nat. Acad. Sci. USA 70: 3321-3323.

Ratnaparkhe, M.B., M. Tekeoglu, and F.J. Muehlbauer. 1998. Intersimple-sequence-repeat (ISSR) polymorphisms are useful for finding markers associated with disease resistance gene cluster. Theor. Appl. Genet. 97: 515-519.

Rohlf, F.J. 1994. NTSYS-pc, Numerical Taxonomy and Multivariate Analysis System 1.80. Exeter Software, New York.

Sneath, P. and R. Sokal. 1973. Numerical Taxonomy. W.H. Freeman and Company, San Francisco.

Stewart, C.N. and L. Excoffier. 1996. Assessing population genetic structure and variability with RAPD data: application to Vaccinium macrocarpon (American Cranberry). J. Evol. Biol. 9: 153-171.

Szmidt, A.E., X. Wang, and M. Lu. 1996. Empirical assessment of allozyme and RAPD variation in, Pinus sylvestris (L.) using haploid tissue analysis. Heredity 76: 1112-1120.

Tremblay, N.O. and J. Schoen. 1999. Molecular phylogeography of Dryas integrifolia: glacial refugia and postglacial recolonization. Mol. Ecol. 8: 1187-1198.

Williams, J.G.K., A.R. Kubelik, K.J. Livak, J.A. Rafalski, and S.V. Tingey. 1990. DNA polymorphism amplified by arbitrary primers are useful as genetic markers. Nucleic Acid Res. 18: 6531-6535.

Wolfe, A.D., Q.Y. Xiang, and S.R. Kephart. 1998. Assessing hybridization in natural populations of Penstemon (Scrophulariaceae) using hypervariable inter-simple sequence repeat (ISSR) bands. Mol. Ecol. 7: 1107-1125.

Xu, X.H. and M.P. Li. 1959. The ecological and geographical distribution of Glyptostrobus pensilis. South China Normal University (Nat Sci Edit), 3: 84-99.

Yeh, F.C., R.C. Yang, and T. Boyle. 1999. POPGENE. Microsoft Windows-Based Freeware for Population Genetic Analysis. Release 1.31. University of Alberta, Edmonton.

Young, A., T. Boyle, and T. Brown. 1996. The population genetic consequences of habitat fragmentation for plants. Trends Ecol. Evol. 11: 413-418.

Yu, Y.F. 1995. Origin, evolution and distribution of the Taxodiaceae. Acta Phytotaxon. Sin. 33: 362-389.

Xi, Y.Z. 1986. Studies on pollen morphology of Taxodiaceae. Bull. Bot. Res. 6: 127-144.

Xiao, D.X. and J.S. Dong. 1983. Early study on Karyotype of Glyptostrobus. Acta Agricul. Univ. Jiangxiensis 17: 87-90.

Xu, X.H. and M.P. Li. 1959. The ecological and geographical distribution of Glyptostrobus pensilis. J. South China Normal Univ. (Natural Science Edition) 3: 84-99.

Zheng, W.J. and L.G. Fu. 1978. Flora of China. Vol 7. Gymnosperms. Academy Sinica Press.

Zietkiewicz, E., A. Rafalski, and D. Labuda. 1994. Genome fingerprinting by simple sequence repeat (SSR)-anchored polymerase chain reaction amplification. Genomics 20: 176-183.


Botanical Bulletin of Academia Sinica, Vol. 46, 2005