Bot. Bull. Acad. Sin. (2005) 46: 347-353

ZHANG et al. — Abscisic acid affects self-thinning

Sensitivity of response to abscisic acid affects the power of self-thinning in Arabidopsis thaliana

Hao ZHANG, Gen-Xuan WANG*, Zhi-Qiang LIU, Zhu-Xia SHEN, and Xing-Zheng ZHAO

State Key Laboratory of Plant Physiology & Biochemical, College of Life Sciences, Zhejiang University, Hangzhou, Zhejiang Province, 310029, P. R. China

(Received November 12, 2004; Accepted May 11, 2005)

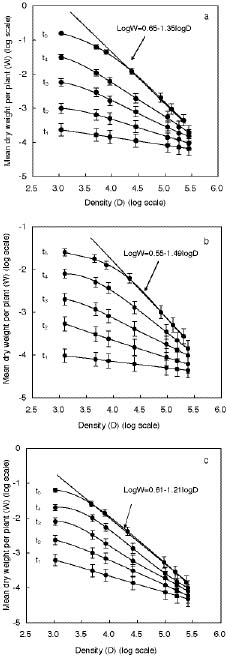
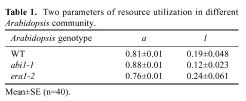
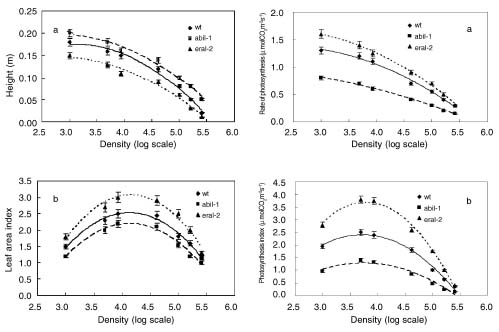
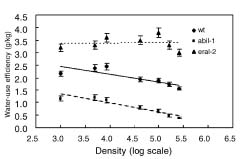
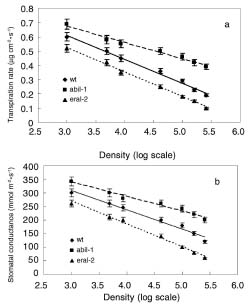
Abstract. The effect of sensitivity of abscisic acid (ABA) on the power of self-thinning was studied with two Arabidopsis mutants (abi1-1, insensitive to ABA and era1-2 hypersensitive to ABA). The experimental results showed that the self-thinning power of abi1-1 (-1.49) was smaller than that of wild type (-1.35), and the self-thinning power of era1-2 (-1.21) was greater than that of wild type. Two parameters of resource utilization (l mean height from root to leaf; a total area of leaves) were more advantageous to era1-2 than to abi1-1 under density stress. Physiological indices of light use (photosynthetic rate, photosynthesis index PSI), water loss (transpiration rate, stomata area index SAI), and water-use efficiency (photosynthetic rate/ transpiration rate) of abi1-1 and era1-2 were consistent with the resource utilization parameters of these Arabidopsis mutants. It can be concluded that the different self-thinning power of the two Arabidopsis mutants resulted from their different resource utilization (such as light and water use) in response to density stress.

Keyword: Abscisic acid; Arabidopsis thaliana; Photosynthesis; Resource utilization; Self-thinning.

Abbreviation: ABA, abscisic acid; LAI, leaf area index; PSI, photosynthesis index; SAI, stomatal area index.

Introduction

The self-thinning law describes variation in population density with body size in the ecological community (Yoda et al., 1963). The -3/2 self-thinning law is described by Formula 1:

logW = logK + blogD (1)

where W and D were the average weight and real density of surviving individuals, respectively (Yoda et al., 1963). Also, K and b were the constant and the power of self-thinning, respectively. Many ecological scientists have devoted themselves to research on the self-thinning law for the past 30 years, and none of this research has disproven the -3/2 or -4/3 self-thinning law (White and Harper, 1970; Harper, 1977; White, 1980, 1981, 1985; Westoby, 1984; Hutching, 1983; Dewar, 1993). Moreover, the power of self-thinning was extended from -1 to -2, according to the relationship between the weight and metabolic rate of animal and microbe (West et al., 1997, 1999b, 2001). Results also indicated that the power of self-thinning phenomena is usually regulated by abiotic or biological factors (Yoda et al., 1963; Weller, 1987a). Some abiotic factors, such as light, water, nutrition and temperature, can affect the power of self-thinning in plant communities directly (Thomas and Weiner, 1989; Morris, 1999; Callaway,

2002). Additionally, gene expression, intracellular signaling, and hormone response may also affect the power of self-thinning in plant communities indirectly.

The power of the self-thinning law should be mediated by the rate of resource utilization, which is in proportion to the physiological metabolism of the plant (Equist et al., 1998; Brian et al., 2003; Jorg et al., 2003). The model of the four dimensions of life showed that all unicellular and multicellular organisms have either virtual or real fractal-like distribution networks for the internal transport of metabolites, thereby endowing them with a "fourth spatial dimension" (Equist et al., 1998; West et al., 1999b). These networks are purported to maximize metabolic capacity and efficiency by maximizing the available surface area for absorption of limiting resources from the environment, yet minimizing transport distance and time. In the N (N ł 3) dimension, the power of the self-thinning law should be modulated by parameters of resource utilization, such as l and a, as in Equation 2:

where represents the power of self-thinning; 1 is the internal distance associated with the network of fractal plant and is negatively correlated with resource utilization rate; and a is effective surface area or fractal dimension and positive to resource utilization . The sum of l and a is 1; the definition of W and D are the same as in Formula 1.

*Corresponding author. E-mail: wanggx@zju.edu.cn; Tel and Fax: +86-571-86971083.


Botanical Bulletin of Academia Sinica, Vol. 46, 2005

Practically, mean height from root to leaf and leaf area can be used to describe l and a of the plant, respectively (West et al., 1999b).

Abscisic acid (ABA) is a sesquiterpene produced in plants that has been shown to mediate growth and development in processes such as control of the stomatal aperture in leaves and the establishment of seed dormancy (Leung and Giraudat, 1998; Bonetta and McCourt, 1998). In Arabidopsis, an allelic series of mutations that reduces endogenous ABA levels demonstrates that seed dormancy correlates directly with the level of ABA synthesized by the embryo (Karssen et al., 1983). ABA insensitive mutants of Arabidopsis were identified by their ability to germinate on concentrations of ABA that normally inhibit wild-type germination (Karssen et al., 1983). Genetic screens to identify ABA response genes in Arabidopsis have identified two protein phosphatases (abi1, abi2) and two transcription factors (abi3, abi4). Further results indicate that two ABA insensitive loci, designated abi1 and abi2, encode homologous protein type 2C phosphatases (Leung, 1994; 1997; Meyer, 1994). Other results show that the era1 mutation results in ABA hypersensitivity of guard cell anion activation and of stomatal closing (Pei et al., 1998). Farnesyltransferase (era1), a novel protein (era3/ein2), was involved in ABA hypersensitivity of era1-2. Fortunately, these changes of metabolism are all induced by mutation of the ABA locus. Hence, mutations of ABA sensitivity provide well defined experimental material to test the effect of sensitivity to ABA on resource utilization through physiological activities.

Here, we hypothesized that the sensitivity of response to ABA may affect the power to self-thinning in the plant community through resource utilization. If this hypothesis is true, we can predict that: (1) the sensitivity of response to ABA is closely related to the power of self-thinning in the Arabidopsis community; (2) the different self-thinning powers of two Arabidopsis mutants resulted from their different resource utilization and sensitivity to ABA under stress. In this study, we investigated the effect of sensitivity to abscisic acid (ABA) on the power to self-thinning of two Arabidopsis mutants (abi1-1, insensitive to ABA and era1-2, hypersensitive to ABA).

Materials and Methods

Plant Material and Growth Conditions

Plant material included wild type (WT) and two mutants (abi1-1, insensitive to ABA; era1-2, hypersensitive to ABA) in Arabidopsis thaliana. The medium of cultures used was mixed soil (clay:sand=1:1). An Arabidopsis community was established by sowing seeds of Arabidopsis directly into a thin layer of sand over substrate (soil mix) in 10-cm-diameter pots with a soil depth of 10 cm. Sowing densities were in seven grades: 1000, 5000, 10000, 20000, 50000, 80000, and 100000 /m2, and there were 25 replicates for each. A perspex template was used to establish a hexagonal arrangement of seeds at the two lowest densities, and seeds were scattered as evenly as possible on the

substrate surface at high densities, where use of a template was not feasible. Mixed soil was automatically irrigated by mineral nutrients (Hogland solution). To ensure that the degree of water stress perceived by different mutants was similar, an automatic system (Israel, Lady Bug-3) was used to keep the volumetric soil water content at 0.1±0.02 g cm3. Pots were kept in a 12-h light/12-h dark cycle and a photon fluency rate of 100 µmol m-2s-1 at 22°C for 6-8 weeks (Allen et al., 2002). A collar of 70% shadecloth at canopy height was used to reduce edge effects when plants grew about 5 cm above the soil. Higher collars were successively added as the plants grew higher.

Measurement of Density and Individual Weight in the Arabidopsis Community

A circular quadrat was sampled in the center of each pot (using PVC pipe, internal diameter either 1.5 or 3.0 cm) in the 15th(t1), 25th(t2), 35th(t3), 45th(t4) and 55th(t5). The small quadrat was used in the populations with high density and the large quadrat in the populations with low density. The total numbers of plants with stem/roots in the quadrat were converted to density (D, number per m2). All fresh plants were killed by N2 (liquid) to stop their metabolism, before being dried for 24 h under 85°C. The biomass (dry weight) of root, stem, and leaf was measured after drying.

Parameters of Resource Utilization and Light, Water Physiological Index in the Arabidopsis Community

On the 55th day after the Arabidopsis had been planted in pots, we measured the parameters of resource utilization (leaf area, height from root to middle leaf), light physiological indices (photosynthesis ratio, photosynthesis index), and water loss indicator (transpiration rate, stomata area index) of the Arabidopsis community. Leaf area was measured with a CI-202 Leaves Area Instrument (America, CID). Transpiration rate, photosynthesis rate, and stomatal conductance of individual leaves were measured with a LI-6400 photosynthesis system (America, LI-COR). These rates were measured on randomly chosen replicate treatment plants under 12-h light conditions to obtain mean values. The ratio of photosynthetic rate to transpiration rate gives the water-use efficiency (Hacker and Bertness, 1995). Mean height from root to middle leaf of an Arabidopsis individual was measured with a common rule. Stomatal number and stomatal aperture were observed with a NI-KON E600 microscope (Japan, NIKON). The stomatal aperture was calculated as pore width/length. We measured individual leaves in 10-20 plants and the stomatal aperture in 15-30 cells for each treatment. All data were presented as mean ± S.D.

Analyses of Data

We calculated the power of self-thinning with Formula 1 (logW=logK+blogD), where W and D were the average weight and the real density of surviving individuals, respectively, and K and b were the constant and the power


ZHANG et al. — Abscisic acid affects self-thinning

of self-thinning, respectively (Yoda et al., 1963). In order to reflect the resource utilization rate of Arabidopsis, we used l and a as parameters of resource utilization according to Equation 2. In this study, l and a could be described by mean height from root to leaf and total area of leaves, respectively (West et al., 1999a and 1999b). Photosynthesis index PSI and stomata area index SAI were calculated with photosynthesis ratio and stomatal density multiplied by leaf area index LAI, respectively.

Additionally, computations and analyses related to the power of self-thinning used the software package JMP, Version 3 (SAS Institute, Cary, NC). Model Type II (reduced major axis, denoted as RMA) regression analysis was also used to compute scaling exponents (slopes of curves designed as RMA) because the error variance resulting from measurement error and real biological variation was equivalent among all variables (Niklas, 1994). The 95% confidence intervals of RMA were used to assess whether an empirically determined power of self-thinning complied with that of control (Niklas, 1994). Analysis of variance was conducted on all data. When significant differences occurred, means were separated by the LSD (P-0.05) method.

Results

Sensitivity of Response to ABA is Closely Related to the Power of Self-Thinning in the Arabidopsis Community

At a population level, slopes of the scaling relationship between average weight of surviving individuals (W) and population density (D) were different among the three genotypes of Arabidopsis under the same conditions (Figure 1). The slope of the scaling relationship of abi1-1 was steeper than that of WT, which in turn was steeper than that of era1-2. Powers of self-thinning in all three genotypes of Arabidopsis ranged from -1.49 to -1.21. The curves of self-thinning of abi1-1 and era1-2 were defined by logW=0.55-1.49logD (RMA=-1.49±0.05) and logW=0.61-1.21logD (RMA=-1.21±0.04), respectively, while the self-thinning trajectory of wild type Arabidopsis was defined by logW=0.62-1.35logD (RMA=-1.35±0.05).

Different Power of Self-Thinning Resulted from Different Parameters of Resource Utilization

Different powers of self-thinning among Arabidopsis mutants (abi1-1 and era1-2) should be determined by different rates of resource use (West et al., 1999b). According to the general model for the structure and allometry of plant vascular systems, we could predict that rate of resource use of abi1-1 was minimal and that that of era1-2 was maximal among all Arabidopsis types (Table 1). It was implied that the distance of resource utilization of abi1-1 was maximal and that that of era1-2 was minimal in three Arabidopsis. The resource utilization area should be reversed to the distance of resource utilization in the three Arabidopsis types. To more fully describe the resource

Figure 1. Graphical scheme to represent the competition-density effect and self-thinning of wild type (a), abi1-1 (b) era1-2 (c) in Arabidopsis thaliana. Successive time periods are indicated by subscripted t, t1 being the 10th day after seeding sowing at each density. Data of wt are from 210 plants (r2=0.953, n=210, P<0.01; 95% confidence interval: -1.30 to -1.40). The power of abi1-1 and era1-2 are distinguished from -4/3, indicating that sensitivity to ABA affects the power of self-thinning in populations of Arabidopsis.


Botanical Bulletin of Academia Sinica, Vol. 46, 2005

use trait of Arabidopsis, morphological and light physiological indices were measured.

Figure 2 shows that different sensitivity of responses to ABA could also affect parameters of resource utilization in Arabidopsis, such as l and a. For the parameter of l, the mean height measurements (from root to middle leaf) of abi1-1 were significantly greater than those of era1-2 owing to its insensitivity to ABA. It shows that the average distances of resource utilization of abi1-1 were greater than those of era1-2 in the three Arabidopsis types. In other words, the cost of resource utilization of era1-2 was lower than for abi1-1 due to its shorter average distance of resource utilization. In contrast, the relationship between abi1-1 and era1-2 under density and resource stress was almost the reverse of that of l. In brief, the different pow

ers of self-thinning resulted from greatly different resource utilization abilities induced by sensitivity to ABA.

Different Light and Water Physiological Response to Stress Induced by Different Sensitivities to ABA

Differences in the light and water utilization abilities of abi1-1 and era1-2 were also reflected in different light and physiological responses to water stress (Figure 3). The photosynthesis rate of abi1-1 was significantly slower than that of era1-2. Also, the trend of PSI was parabolic and that of abi1-1 was much smaller than that of era1-2 too (Figure 3). This showed that the carbon assimilation per unit of land of abi1-1 may be lower than that of era1-2. Transpiration rate and stomatal conductance are indices of water loss. Figure 4 shows that the transpiration rate of abi1-1 was maximal, and that of era1-2 minimal, in the three Arabidopsis types. The stomatal conductance of abi1-1 also significantly exceeded that of wild type, and that of era1-2 was significantly smaller. Also, the water use efficiency (transpiration rate/ transpiration rate) of abi1-1 fell significantly short of era1-2 (Figure 5). In summary, Figures 3-5 indicated that greatly different light and water physiological responses to stress were induced by differing sensitivities to ABA.

Figure 2. Two parameters of resource utilization related to the power of self-thinning in Arabidopsis community on the 55th day. (a) height from root to middle leaf; (b) leaf area index.

Figure 3. Light physiological indices (a photosynthesis ratio, b photosynthesis index) in three genotypes Arabidopsis on the 55th day.


ZHANG et al. — Abscisic acid affects self-thinning

Figure 5. Water use efficiency (transiration nate/ transpiration rate) of three genotypes Arabidopsis on the 55th day.

smaller than in era1-2 (Figure 2). Also, the data of Figure 2 is consistent with that of Table 1, which presents the theory value of resource utilization according to three powers of self-thinning. Previous results also demonstrated that significant difference of morphological characters as we above described exist in abi1-1 and era1-2 (Koornneef and Karssen, 1984; Pei et al., 1998) These data make it clear that two parameters of resource utilization (l mean height from root to leaf; a total area of leaves) of era1-2 were more advantageous to resource utilization than those of abi1-1 under density stress.

Additionally, the physiological characters of abi1-1 and era1-2 are closely related to resource utilization (Figures 3-5). The photosynthetic rate and photosynthesis index of abi1-1 are significantly bigger than those of era1-2 (Figure 3). Both Figure 4 and 5 indicate that era1-2 was more advantageous to water utilization than abi1-1 under density stress. To our knowledge, few studies have reported on the photosynthetic rate or photosynthesis index of abi1-1 and era1-2. However, previous results showed that the stomatal aperture of abi1-1 dwarfed that of era1-1, which could be due to different sensitivity responses to ABA (Pei et al., 1998). Insensitivity to stress signals always increases water loss easily and decreases water-use efficiency (Hetherington and Woodward, 2003; Wang et al., 2001).

Besides abscisic acid, other phytohormones—such as ethylene, auxin, gibberellin and cytokinins—are important to aspects of the growth and development of plants, such as stomata closure, seed gemmation, embryo control, seed development, and drought tolerance (Dodd, 2003). How these phytohormones affect the power of self-thinning is important to the development of phytohormones ecology (Farnsworth, 2004). Available hormonal mutants allow the study of other plant hormones and their relation to the power of self-thinning. Here, the effect of sensitivity to abscisic acid on the power of self-thinning was studied with two Arabidopsis mutants (abi1-1, insensitive to ABA and era1-2 hypersensitive to ABA). Our study paves the way to examining the functional diversity and complexity of phytohormones as plants react to abiotic stress, herbivores, and pathogens.

Figure 4. Water loss indices (a transpiration rate, b stomatal conductance) of three genotypes Arabidopsis on the 55th day.

Discussion

In this study, we examined the effect of sensitivity to ABA on the self-thinning power of abi1-1 and era1-2 and WT in Arabidopsis. We observed that the self-thinning power of abi1-1 (-1.49) was smaller than in wild type (-1.35), and the self-thinning power of era1-2 (-1.21) exceeded that of wild type (Figure 1). It disproves the -4/3 self-thinning law, which has ever been regarded as a universal model to explain the unique power of self-thinning in plants (West et al., 1997; 1999). Similarly, previous results showed the power of self-thinning was affected by light, water, nutrient, temperature, and water content of the soil (Westoby, 1984; Morris, 1999). Chen and Li (2003) also confirmed that the scaling exponents of 2-year-old seedlings were controlled by different soil water and genotypes of plants.

Based on previous results, resource utilization theory can be used to explain why the sensitivity to abscisic acid affects the power of self-thinning (West et al., 1997; 1999a and 1999b; Weller, 1987a and 1987b). West et al. (1999b) explained the self-thinning power of b=-4/3 (instead of -3/2) as being due to the fractal-like space-filling structure of networks that transport materials within living bodies. Figure 2 shows that the mean height from root to middle leaf of abi1-1 is significantly longer than that of era1-2, meaning that the resource transport distance is longer for abi1-1 than era1-2. Our data also indicated the resource utilization area, such as the leaf area of abi1-1 was far


Botanical Bulletin of Academia Sinica, Vol. 46, 2005

Acknowledgement. We thank T. J. Wang and W. Lang for help in data analysis. Comments from Dr. Yaw-Huei Lin and two anonymous reviewers have helped to improve the manuscript. This study was supported by the National Science Foundation of China (30170161 and 90102015) and by a grant of doctoral discipline from the Ministry of Education of China (20030335043).

Literature Cited

Allen, G.J., Y. Murata, S.P. Chu, M. Natisi, and J.I. Schroeder. 2002. Hypersensitivity of abscisic acid_induced cytosolic calcium increases in the Arabidopsis farnesyltransferase mutant era1-2. Plant Cell 14: 1649-1662.

Bonetta, D. and P. McCourt. 1998. Genetic analysis of ABA signal transduction pathways. Trends Plant Sci. 283: 231-235.

Brian, J.E., P.E. Evan, E.H. Travis, T.E. Huxman, A.P. Allen, D.D. Ignace, and J.F. Gillooly. 2003. Scaling metabolism from organisms to ecosystems. Nature 423: 639-642.

Callaway, R.M., R.W. Brooker, P. Choler, Z. Kikvidze, C.J. Lortie, R. Michalet, L. Paolini, F.I. Pugnaire, E. Newingham, E.T. Aschehoug, C. Armas, D. Kikodze, and B.J. Cook. 2002. Positive interactions among alpine plants increase with stress. Nature 417: 844-848.

Chen, X.W. and B.L. Li. 2003. Testing the allometric scaling relationships with seedlings. Acta Oecol. 24: 125-129.

Dewar, R.C. 1993. Mechanistic analysis of self-thinning in term of the carbon balance of trees. Ann. Bot. 71: 147-159.

Dodd, L.C. 2003. Hormonal interactions and stomatal response. J. Plant Growth Regul. 22: 32-46.

Equist, B.J., J.H. Brown, and G.B. West. 1998. Allomertric scaling of plant engergtics and population. Nature 395: 163-165.

Farnsworth, E. 2004. Hormones and shifting ecology throughout plant development. Ecology 85: 5-15.

Hacker, S.D. and M.D. Bertness. 1995. Morphological and physiological consequences of a positive plant interaction. Ecology 76: 2165-2175.

Harper, J.L. 1977. Population Biology of Plants. London: Academic Press, pp. 25-31.

Hetherington, A.M. and F.I. Woodward. 2003. The role of stomatal in sensing and driving environmental change. Nature 424: 901-907.

Hutchings, M.J. 1983. Ecology,s law in search of the theory. New Scientist 98: 765-767.

Jorg, S., K. Steffen, B. Katja., S. Stefan, and D.G. Ernst. 2003. Metabolic network structure determines key aspects of functionality and regulation. Nature 423: 639-642.

Karssen, C.M., D.L.C. Brinkhorst-van der Swan, A.E. Breekland, and M. Koornneef. 1983. Induction of dormancy during seed development by endogenous abscisic acid: Studies on abscisic acid deficient genotypes of Arabidopsis thaliana (L.) Heynh. Planta 157: 158-165.

Koornneef, M.R. and C.M. Karssen. 1984. The isolation and characterization of abscisic acid-insensitive mutants of Arabidopsis thaliana. Physiol. Plant. 61: 377-383.

Leung, J. and J. Giraudat. 1998. Abscisic acid signal transduction. Ann. Rev. Plant Physiol. Plant Mol. Biol. 49: 199-125.

Leung, J., M. Bouvier-Durand, P.C. Morris, D. Guerrier, F. Chefdor, and J. Giraudat. 1994. Arabidopsis ABA-response gene ABI1: features of a calcium-modulated protein phosphatase. Science 264: 1448-1452.

Leung, J., S. Merlot, and J. Giraudat. 1997. The Arabidopsis ABSCISIC ACID-INSENSITIVE2 (ABI2) and ABI1 genes encode homologous protein phosphatases 2C involved in abscisic acid signal transduction. Plant Cell 9: 759-771.

Meyer, K., M.P. Leube, and E. Grill. 1994. A Protein Phosphatase 2C involved in ABA signal transduction in Arabidopsis thaliana. Science 264: 1452-1455.

Morris, E.C. 1999. Effect of localized placement of nutrients on root competition in self-thinning populations. Ann. Bot. 78: 353-364.

Niklas, K.J. 1994. Plant Allometry. Chicago: Chicago University Press, pp. 101-125.

Pei, Z.M., M. Ghassemian, C.M. Kwak, P.M. Court, and J.I. Schroeder. 1998. Role of farnesyktransferase in ABA regulation of guard cell anion channel and plant water loss. Science 282: 287-290.

Thomas, S.C. and J. Weiner. 1989. Growth, death and size distribution changes in an Impatiens pallida population. J. Ecol. 77: 524-536.

Wang, G.X., J.X. Liao, and D.X. Wu. 2001. Evidence of hydropassive movement in stomatal oscillation of Glycyrrhiza inflata under desert condition. Acta Bot. Sin. 43: 41-45.

Weller, D.E. 1987a. A revaluation of the -3/2 power rule of plant self-thinning. Ecol. Monographic. 57: 23-43.

Weller, D.E. 1987b. Self-thining exponent correlated with allometric measures of plant geometry. Ecology 68: 813-821.

West, G.B., J.H. Brown, and B. J. Enquist. 1997. A general model for the origin of allometric scaling laws in biology. Science 276: 122-126.

West, G.B., J.H. Brown, and B.J. Enquist. 1999a. A general model for the structure and allometry of plant vascular systems. Nature 400: 664-667.

West, G.B., J.H. Brown, and B.J. Enquist. 1999b. The fourth dimension of life:fractal geometry and allometric scaling of organism. Science 284: 1677-1679.

West, G.B., J.H. Brown, and B.J. Enquist. 2001. A general model for ontogenetic growth. Nature 413: 628-631.

Westoby, M. 1984. The self-thinning rule. Adv. Ecol. Res. 14: 167-225.

White, J. 1980. Demographic factors in population of plants. In O.T. Solbrig (ed.), Demographic and evolution in plant populations. Berkeley, California: University of California Press, pp. 21-48.

White, J. 1981. The allometric interpretation of self-thinning rule. J. Theor. Biol. 89: 475-500.

White, J. 1985. The thinning rule and its application to mixtures of plant population. In J. White (ed.), Studies on Plant Demography. London: Academic Press, pp. 291-309.

White, J. and J.L. Harper. 1970. Correlated changes in plant size and number in plant population. J. Ecol. 58: 467-485.

Yoda, K., T. Kira, H. Ogawa, and K. Hozumi. 1963. Self-thinning in overcrowded pure stands under cultivated and natural conditions. J. Ins. Polytechnics Osaky City Univ. D. 14: 107-129.


ZHANG et al. — Abscisic acid affects self-thinning